Code Monkey home page Code Monkey logo

survey-analytics's Introduction

SurveyJS Dashboard

dashboard.mp4

Build Status Tested with TestCafe Open Issues Closed issues

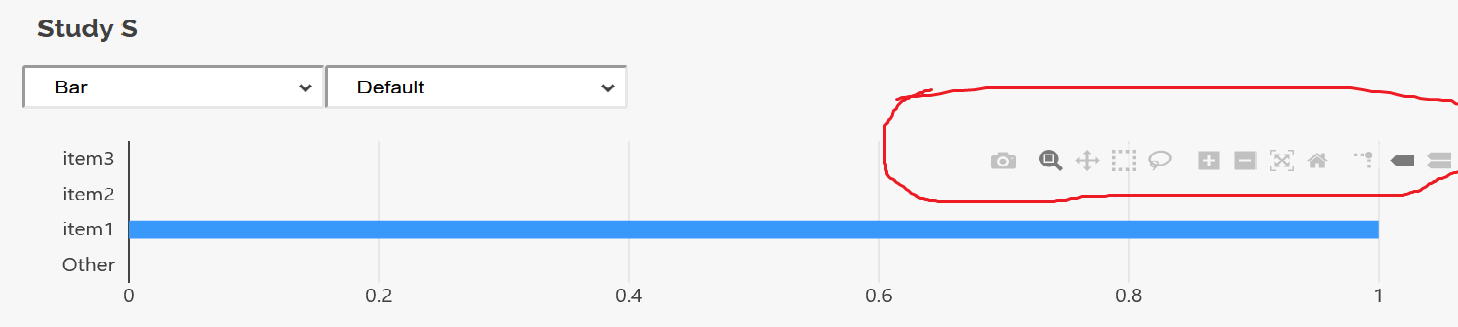
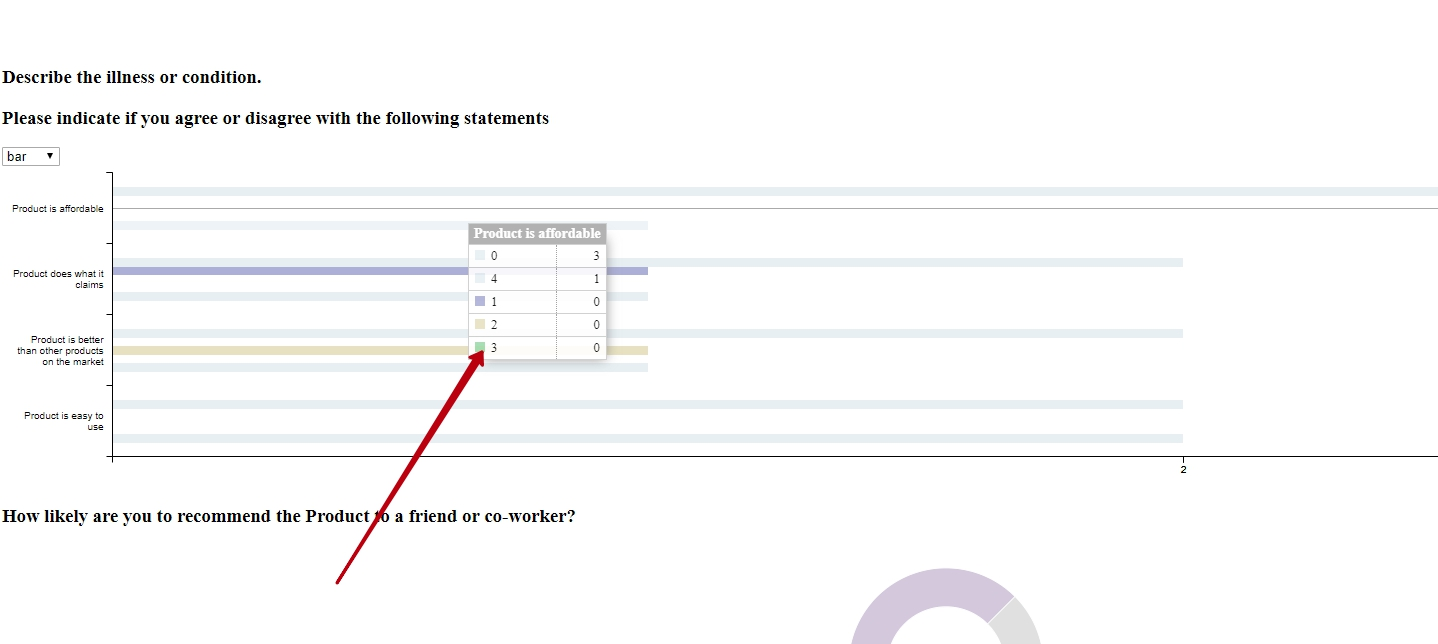
The SurveyJS Dashboard library lets you build survey data dashboards and simplify survey data analysis with interactive and customizable charts and tables. Visualize your insights and analyze survey results in one view.

Features

  • Supported chart and graph types:
    • Bar chart
    • Donut graph
    • Pie chart
    • Line chart (also known as line graph or curve chart)
    • Gauge chart
    • Bullet graph
    • Scatter plot
    • Word cloud
  • Interactive value filtering ordering
  • Customizable colors
  • Dynamic layout
  • Drag-and-drop chart reordering

SurveyJS Dashboard

Get Started

Resources

Build SurveyJS Dashboard from Sources

  1. Clone the repo

    git clone https://github.com/surveyjs/survey-analytics.git
    cd survey-analytics
    
  2. Install dependencies
    Make sure that you have Node.js v6.0.0 or later and npm v2.7.0 or later installed.

    npm install
    
  3. Build the library

    npm run build:prod
    

    You can find the built scripts and style sheets in the packages folder.

  4. Run test examples

    npm start
    

    This command runs a local HTTP server at http://localhost:8080/.

  5. Run unit tests

    npm test
    

Licensing

SurveyJS Dashboard is not available for free commercial usage. If you want to integrate it into your application, you must purchase a commercial license(s) for software developer(s) who will be working with the SurveyJS product's APIs and implementing their integration.

survey-analytics's People

Contributors

aboelkassem avatar andrewtelnov avatar dependabot[bot] avatar dk981234 avatar dmitry-kurmanov avatar dpco avatar elenagorbatkova avatar franckmarteau avatar gologames avatar griffen avatar janesjs avatar leandrosimoes avatar liu233w avatar maellyon avatar mviorno avatar nakano-shingo avatar natali93ale avatar novikov82 avatar olgalarina avatar romantsukanov avatar serge-sobchuk avatar tiagofranciscosta avatar timo-leanact avatar tsv2013 avatar

Stargazers

 avatar  avatar  avatar  avatar  avatar  avatar  avatar  avatar  avatar  avatar  avatar  avatar  avatar  avatar  avatar  avatar  avatar  avatar  avatar  avatar  avatar  avatar  avatar  avatar  avatar  avatar  avatar  avatar  avatar  avatar  avatar  avatar  avatar  avatar  avatar  avatar  avatar  avatar  avatar  avatar  avatar  avatar  avatar  avatar  avatar  avatar  avatar  avatar  avatar  avatar  avatar  avatar  avatar  avatar  avatar  avatar  avatar  avatar  avatar  avatar  avatar  avatar  avatar  avatar  avatar  avatar  avatar  avatar  avatar  avatar  avatar  avatar  avatar  avatar  avatar  avatar  avatar  avatar  avatar  avatar  avatar  avatar  avatar  avatar  avatar  avatar  avatar  avatar  avatar  avatar  avatar  avatar  avatar  avatar

Watchers

 avatar  avatar  avatar  avatar  avatar  avatar  avatar  avatar  avatar  avatar  avatar  avatar  avatar  avatar

survey-analytics's Issues

How to hide the unwanted tool icons on charts

Hi,
Could you please help me to remove certain icons or whole set of icons when question is displayed in chart.
Also, i noticed in pie chart and doughnut chart, on mouse hover the answers are displaying twice.
barchart
pieChart

Duplicated imports in the type declarations file

import { Question } from "survey-core";
import { Question, Event } from "survey-core";
import { SurveyModel, Event } from "survey-core";
import { Question, QuestionBooleanModel } from "survey-core";
import { ItemValue } from "survey-core";
import { Question, ItemValue } from "survey-core";

Support different calculation types for numeric answers - sum, avg, min, max and so on

See this thread for more details - https://surveyjs.answerdesk.io/ticket/details/t4431/graph-chart-visuals-for-numeric-datatypes

Suppose we want to get the number of covid patients in each hospital, then this data can be presented in several ways like total number of patients, average number of patients in each hospital, maximum and minimum number of patients across all hospitals. This can help to take decisions. (Furthermore scattering around these points will provide more useful information - not a required feature).

I get "Cannot read property 'extend' of undefined" when I try to instantiate a DataTables object.

When I run the code, I noticed that the window["jquery"] is undefined.

I am using Angular 9 and I installed the survey-analytics npm package.

In the component I imported:

import { SurveyModel } from 'survey-core';
import * as SurveyAnalytics from 'survey-analytics';

And I am trying to create a DataTables for the Feedback Survey example:

const surveyAnalyticsDataTables = new SurveyAnalytics.DataTables(
        document.getElementById('surveyAnalyticsDomNode'),
        new SurveyModel(feedbackSurveyJSON),
        normalizedData,
        dataTablesOptions
      );

surveyAnalyticsDataTables.render();

There is no documentation for the DataTablesOptions but they are required in the DataTables ctor, so I set the default values:

const dataTablesOptions = {
        buttons: true,
        dom: '',
        orderFixed: [],
        rowGroup: false,
        headerCallback: () => {},
      };

Implement getElements method for VisualizationPanel

It should return an array of

export interface IVisualizerPanelElement {
  name: string;
  displayName: string;
  visibility: ElementVisibility;
  type?: string;
}

where visibility is

export enum ElementVisibility {
  Visible,
  Invisible,
  PublicInvisible,
}

An array of the IVisualizerPanelElement items can be passed to VisualizationPanel constructor as 5th parameter. It represents the state of a panel (a set of elements, titles. visibility). The getElements method will allow to get the surrvey state of VisualizationPanel.

See the https://surveyjs.answerdesk.io/ticket/details/t3856/onvisibleelementschanged-event thread for more details

Pass elements and changed element in the onVisibleElementsChanged event handler

Now an object with the

      {
        elements: this._elements,
        changed: element,
      }

is passed in the event options:

  visibleElementsChanged(element: IVisualizerPanelElement) {
    if (!this.onVisibleElementsChanged.isEmpty) {
      this.onVisibleElementsChanged.fire(this, {
        elements: this._elements,
        changed: element,
      });
    }
    this.layout();
  }

Error when adding import survey-analytics

I only add import * as SurveyAnalytics from "survey-analytics" in my react component.
I get error after npm start:

FATAL ERROR: CALL_AND_RETRY_LAST Allocation failed - JavaScript heap out of memory

React version 16.12.0.
NPM version 6.9.0
Survey-analytics version 1.1.24.

What is the best way to use "survey-analytics" in React project?

Unable to render Data Table in Analytics in Vue

I am unbale to render the data table in my Vue component. I am guessing it is the way that jquery is loaded in the vue app.

I am just loading jquery and the plugins using the script tags in the index.html file

    <script src="https://unpkg.com/jquery"></script>
    <script src="https://code.jquery.com/ui/1.11.4/jquery-ui.min.js"></script>
    <script src="https://cdn.datatables.net/1.10.21/js/jquery.dataTables.js"></script>
    <script src="https://cdn.datatables.net/buttons/1.6.2/js/dataTables.buttons.js"></script>
    <script src="https://cdn.datatables.net/buttons/1.6.2/js/buttons.print.js"></script>
    <script src="https://cdn.datatables.net/buttons/1.6.2/js/buttons.html5.js"></script>
    <script src="https://cdn.datatables.net/colreorder/1.5.2/js/dataTables.colReorder.js"></script>
    <script src="https://cdn.datatables.net/responsive/2.2.4/js/dataTables.responsive.js"></script>
    <script src="https://cdn.datatables.net/rowgroup/1.1.2/js/dataTables.rowGroup.js"></script>
    <script src="https://cdn.datatables.net/select/1.3.1/js/dataTables.select.js"></script>

while survey-analytics is loaded in the vue component

import * as SurveyAnalytics from 'survey-analytics';

And the table is created as such:

const surveyTableNode = document.getElementById('surveyTable');
surveyTableNode.innerHTML = '';

const surveyAnalyticsDataTables = new SurveyAnalytics.DataTables(surveyTableNode, this.survey, normalizedData);

surveyAnalyticsDataTables.render();

However I am getting this error in the .render() function.

Screen Shot 2020-07-07 at 2 59 58 PM

and the error occurs at this line in survey.analytics.js

var datatableApiRef = (this.datatableApi = jquery__WEBPACK_IMPORTED_MODULE_1__(tableNode).DataTable(options));

Any idea what could be the problem? And is there a better way to load jquery and the plugins in vue apps?

Any help would be great thanks

Mark correct vs incorrect answers

I'm current evaluating the analytics-pack for our use. I managed to mark the correct answer with an asterisk (by iterating through the questions and modifying the correct choice:

// if choice is correct ...
choice.locTextValue.values.default += " *";

My question is: Is it somehow possible to just display "correct vs. wrong answers"? Instead of all individual replies?

Error survey.analytics v 1.1.9

ngAfterViewInit(): void {
..
..
..
..
..
const visPanel = new SurveyAnalytics.VisualizationPanel(
document.getElementById('surveyAnalyticsContainer'),
this.survey.getAllQuestions(),
this.normalizedData
);
visPanel.render();
..
..
..
..
..

uncaught TypeError: Cannot read property 'document' of undefined
at survey.analytics.js:25623
at Object.163 (survey.analytics.js:35169)
at o (survey.analytics.js:756)
at survey.analytics.js:756
at Object.719.../constants/numerical (survey.analytics.js:107754)
at o (survey.analytics.js:756)
at survey.analytics.js:756
at Object.1.../src/lib (survey.analytics.js:759)
at o (survey.analytics.js:756)
at survey.analytics.js:756

Question Matrix Dropdown doesn't work

Version: 1.5.13
Plunkr: https://plnkr.co/edit/pMMil9MHjY2eoeIXodHB?p=preview (open console and click Complete)

Error:

Uncaught TypeError: Cannot read property 'appendChild' of null
    at VisualizationPanel.render (visualizationPanel.ts:240)
    at VisualizationMatrixDynamic.VisualizationPanelDynamic.render (visualizationPanelDynamic.ts:33)
    at VisualizationPanel.renderVisualizer (visualizationPanel.ts:209)
    at visualizationPanel.ts:227
    at Array.forEach (<anonymous>)
    at VisualizationPanel.render (visualizationPanel.ts:226)
    at Array.<anonymous> (index.js:63)
    at Event.fire (base.ts:1065)
    at SurveyModel.doComplete (survey.ts:2694)
    at SurveyModel.doCurrentPageCompleteCore (survey.ts:2493)

Recommend Projects

  • React photo React

    A declarative, efficient, and flexible JavaScript library for building user interfaces.

  • Vue.js photo Vue.js

    ๐Ÿ–– Vue.js is a progressive, incrementally-adoptable JavaScript framework for building UI on the web.

  • Typescript photo Typescript

    TypeScript is a superset of JavaScript that compiles to clean JavaScript output.

  • TensorFlow photo TensorFlow

    An Open Source Machine Learning Framework for Everyone

  • Django photo Django

    The Web framework for perfectionists with deadlines.

  • D3 photo D3

    Bring data to life with SVG, Canvas and HTML. ๐Ÿ“Š๐Ÿ“ˆ๐ŸŽ‰

Recommend Topics

  • javascript

    JavaScript (JS) is a lightweight interpreted programming language with first-class functions.

  • web

    Some thing interesting about web. New door for the world.

  • server

    A server is a program made to process requests and deliver data to clients.

  • Machine learning

    Machine learning is a way of modeling and interpreting data that allows a piece of software to respond intelligently.

  • Game

    Some thing interesting about game, make everyone happy.

Recommend Org

  • Facebook photo Facebook

    We are working to build community through open source technology. NB: members must have two-factor auth.

  • Microsoft photo Microsoft

    Open source projects and samples from Microsoft.

  • Google photo Google

    Google โค๏ธ Open Source for everyone.

  • D3 photo D3

    Data-Driven Documents codes.