Please add your questions to the issue tracker for this repository and use the tag system to categorize the questions.
background's Introduction
background's People
Contributors

Watchers


background's Issues
Groups and Horizontals
@aculich
For coordination between horizontal groups, are you going to designate a single individual from the three horizontals as a coordinator or main individuals we can contact with questions.
Can you assign an individual if that is the point?
Or can we devise a sign up of which curator group is working with a analyzer group and then a visualizer group? (i.e. Curator Group B works with Analyzer Group A and Visualizer Group C.)
Types of Visualization
Distinguishing the different types of visualization - how would visualizations for the paper differ from visualizations for public understanding? Which components would be necessary for each case, and what considerations should be made?
Linear Programming Optimization
Here is a summary of the Linear Programming Optimization that we discussed today with Professor Stark. Hopefully this is a helpful resource.
Also, if you have any background in linear programming (or willing to learn!), comment on this issue so that we can form a group and begin discussing a potential solution.
I have linear programming experience, and some experience with AMPL.
To the Analyzers: Additional data sources?
My group: Curator Group 1: Cache Money is tackling the question of exploring additional data sources in addition to the SCEC data which we have already.
Analyzers: Do you guys need additional data sources? If so, what type of sources would you guys like to see?
@kqdtran
@teresita
@taywon
@johnrisko
@aparker92
@amx01
@lauraccunningham
@bonghyun5
@gnolnait
Chris's Explanation on plotting w(μ) = kμ^M
On Tuesday during lecture Chris went over finding the k.
Is the summary/detailed explanation available somewhere? I couldn't find it on bspace and was wondering if I had missed an e-mail.
Thank you.
Magnitude-Dependent Automatic Alarm Model
Are we optimizing on the magnitude-dependent automatic alarm model? Is this considered the simple model?
As a first step, should we be trying to reproduce Bradley Luen's dissertation analysis / magnitude-dependent automatic alarm model? Section 5.4: Automatic Alarms and ETAS Predictability
Code from Luen
Hey guys I have received a response from Luen quoted below and he has provided us with R functions of the best algorithm to fit ETAS (EM), simulate ETAS, as well as sample code to generate an error diagram! Please let me know if we need anything else from him, or if we have any further inquiries to ask him.
Hi Disi,
I don't know if any of the R packages fit ETAS using the method of Veen and Schoenberg (2009), which is the current best method. You might like to check if the methods give you stable results -- do changing the starting values give you very different parameter estimates?Let me at least send you some files to play with:
https://www.dropbox.com/sh/r73o1lk3rs4koxx/W6pgLP0vG_
socal.dat: Contains a set of Southern California earthquake times and magnitudes.
VS-functions.R: These are functions I got from Alejandro Veen to fit and simulate ETAS models.
etas-training.R: My inefficient (for loops everywhere!), barely annotated code to draw error diagrams for the fit to the training set.I also have a file to draw error diagrams for a test set but it has a comment saying "### THIS IS WRONG!" at the top so I should check that before giving that to you.
Best,
~brad.
[Analyzers - Group 3] Deliverable: S.M.A.R.T. Goal
Roland Shen (Presenter) @rolandshen
Teresa Tenfelder (Statistician, Analyzer) @teresita
Khoa Tran (Technical Lead, Analyzer) @kqdtran
Jody Zhang (Operational Lead, Analyzer) @jzhang
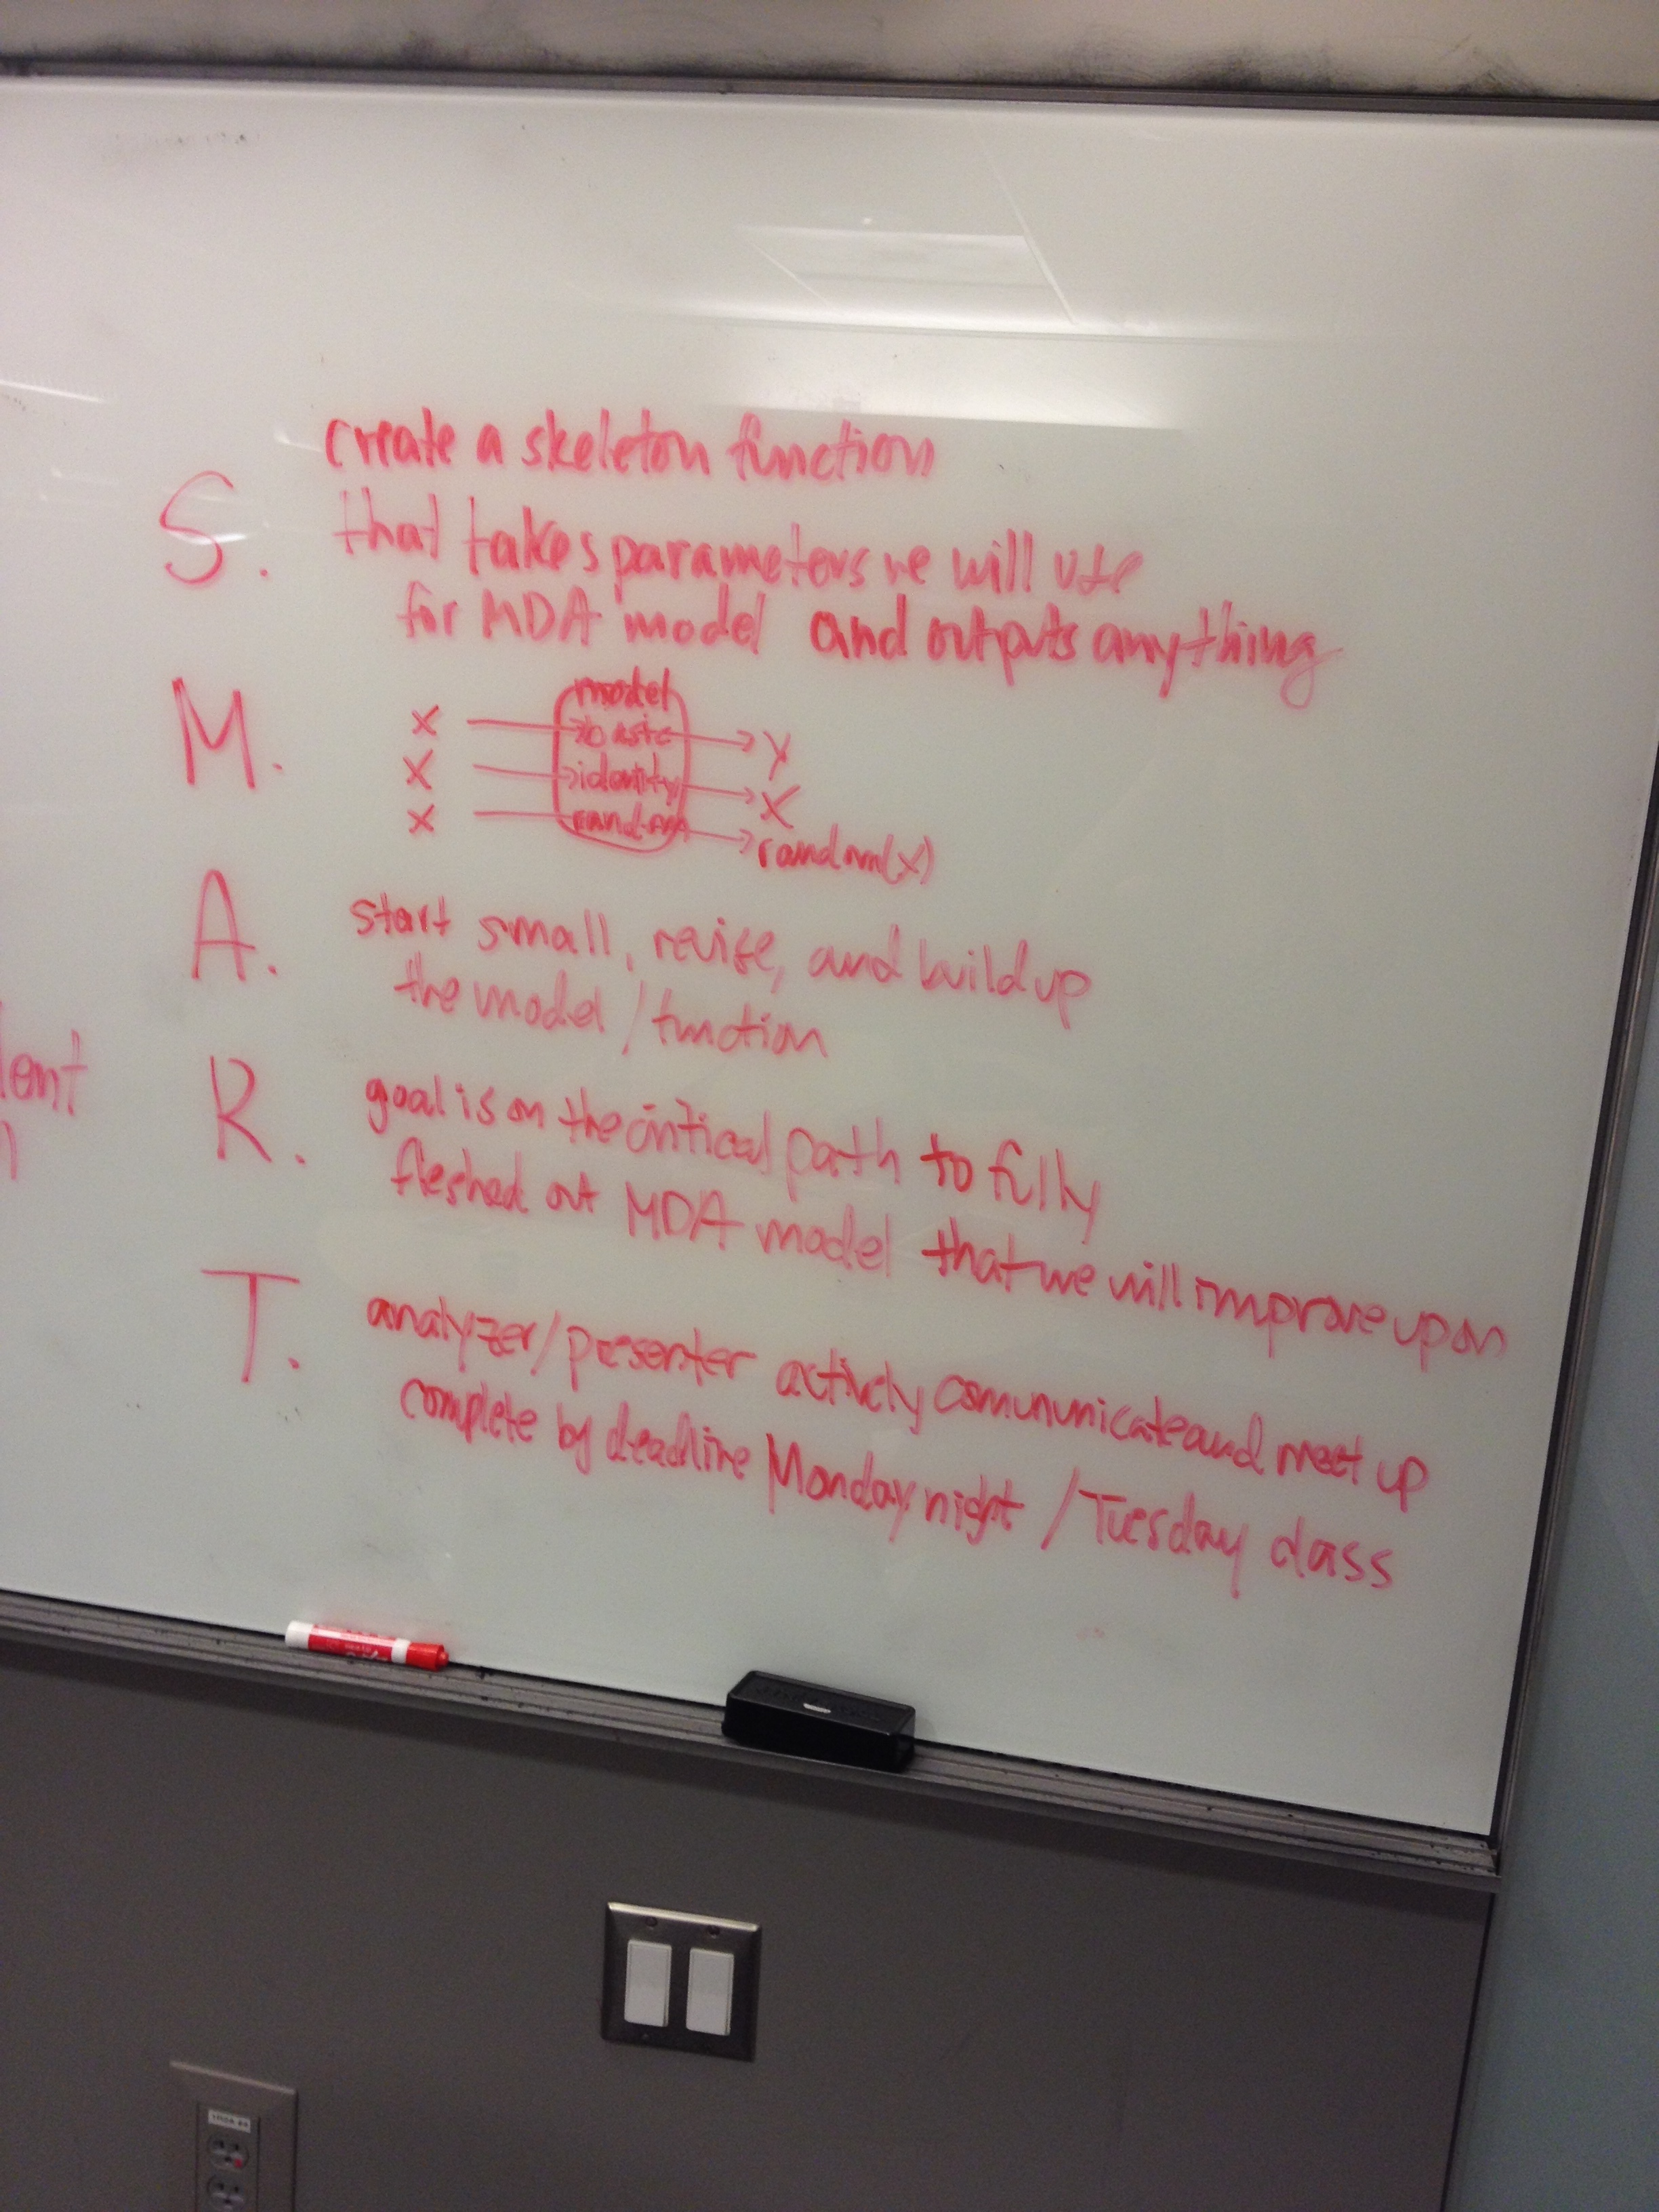
[S] create a skeleton function that takes parameters we will use for MDA model and outputs anything
[M] if the model has well-defined parameters for the input and well-defined output types
[A] start small, revise and build up the model / function
[R] goal is on the critical path to fully fleshing out the MDA model that we will improve upon
[T] analyzer / presenter actively communicate and meet up; complete by deadline of Monday night / Tuesday class
Data Domains
After reading more on Luen, Stark's paper, I think they set their data domains as: Use an earthquake of magnitude 5.5 or greater occurs anywhere in the world from 2000-2004, to predict that an earthquake at least as large will occur within 21 days and within an epicentral distance of 50 km.
So probably magnitude is something we need to take into consideration. I tried with all 1938-2013 SCEC earthquake's Mag >4.5, and now we have a data set with 640 points, which is roughly 1/6 of iran data. (Iran data takes 2 mins to be finished running). I have uploaded the New Data With Mag >4.5 csv file here. The new data frames with Mag >4.5 for ETAS & SAPP packages are uploaded as well. These Data frames for ETAS & SAPP has only 250 data points so you can play around with them first.
Sorry if I am confusing you, I got to go to a meeting in 15 mins. I can explain more after my meeting at 11pm. Comments and concerns are welcome.
Data Normalization?
If we get data from different sources, how do we normalize them? What about for different formats? Different Units?
Good Examples of Posters from the Cog Sci Deptartment for fairs
Reproducibility Group Poster guidelines
Office hour (12/7/2013) summary:
- assumptions of reproducibility: what are the assumptions that make reproducibility possible. For example, recall the first project we did in this class for making reproducible code. We have to make a readme file to clearly indicate how to make instructions to regenerate the work.
- tools:
During the data science faire, we will have a table to set up with monitors that can show people around the products of this class. We can show people some examples and product of the tools involved with reproducibility in the data science faire. Users are able to try on these tools, such as the ipython notebook - Goal of presenting poster during the faire:
we can introduce these tools we learned in class to people who come to the faire by showing them the work we have produced in this class using those tools.
I would suggest the following structural outline for the poster:
- Introduction of reproducibility and current research focus and applications on such area
- The concept of reproducibility applied in this class
- The examples and tools that assist our way to make reproducible products (e.g. ipython notebook, github, vagrant, markdown …)
- Using the survey results from students’ responses and make a data visualization summary graph.
out of food error
It seems that my plate has some kind of error that made all the food disappear and now I'm getting an "out of food error" every time I use my spoon. It was working just fine for a while, but after about 75 iterations of spoon-to-mouth it seems to no longer be working... at very least my mouth detects an empty spoon on each subsequent iteration. I am able to reproduce the problem, so I am pretty sure it must be some kind of bug. Can you check your plate to see if you're having the same problem?
Thanks,
your Instructor
05 November 2013, Class RECAP
Please Refer to this page for all information on groups, structure, etc.
https://github.com/lauraccunningham/s157.project/blob/master/classStructure.md
Structure will be updated later today.
L
ETAS in R: Resources, Overview, and Tasks Breakdown (Updated with resources and links)
So since there are multiple groups working on the ETAS model in R in the interest of reducing redundancy I would like to provide an overview and a breakdown of the possible sub-problems as I see it that we need to tackle so that we can more efficiently divide up tasks. I wrote up a comment in another thread previously explaining this but I will rehash for better visibility. This is the task as I see it and in my opinion here is how we might break it down.
End Goal: A method of comparison between ETAS and MDA. Either a loss function or an error diagram as in Luen's paper (with prediction accuracy(proportion of earthquakes missed) vs tau (proportion of time alarm is on), the lower the curve the better).
If we want to generate error diagrams in order to do so we need code that finds when alarm is on over the time domain (the level sets of conditional intensity over time) in order to find prediction error (proportion of earthquakes we missed) for a particular tau (proportion of alarm coverage).
Once we can compare models and we have established the benchmark predictions for ETAS to compare against we can get to the real meat of our problem which is modifying the MDA model to beat our benchmark.
Steps we need to take:
- Definition:
a. We need to define a domain for the modelling. This consists of a time range, a magnitude range, and a spatial range (drawing a geo-spatial polygon on the map to represent a specific earthquake fault we are modelling).
b. We need to decide which ETAS model to use. There are successive ones starting from the temporal ETAS, space-time ETAS, hierarchical space-time ETAS (HIST-ETAS), more recent extensions(Ogata 2011, Ogata and Zhuang 2006). See papers by Ogata et al. Using the most recent ETAS model would be more difficult to implement but would provide us a stronger adversary to conquer. Using an older version would be easier but runs the risk of fighting a strawman and dilutes the impact of our achievements.
c. We need to decide which package(s) (languages?) to use, and which code we may need to write ourselves.
-R ETAS sucks in my opinion, it only provides parameter estimation and generates some plots. The algorithm it uses to fit the model is very inefficient (David-Fletcher-Powell) compared to the most recent one (Expectation Maximization).
-R SAPP is great in my opinion, it provides functions for simulation and estimation of conditional intensity, both of which we need in the future.
-R PtProcess is more general and has more tools but is less specific to ETAS.
-Code from Luen. He has agreed to share his code but requests which specific code do we need, as he has written various code for different things. May or may not be in R.
d. What data are we going to compare on? True data? Simulated data? This effects our inference.
- Fitting the model:
Use one of the packages or write our own code to estimate the parameters for ETAS for our specified spatio-temporal domain so we can simulate data and compute our alarms. Computational time is a concern here so we may want to write our own implementation of EM or find one online. - (Optional) Simulating earthquake catalogs:
As part of Luen's methodology he ran comparisons on data generated from simulations. We could use just the true dataset. We could use permutation or bootstrapping or whatever. - Generating our predictions (alarms) and find prediction accuracy per tau
To generate predictions with ETAS Luen used the following rule: Alarm turns on when conditional intensity is above a certain threshold. If we use the same rule R SAPP has a conditional intensity estimation function we can use. We need code to find the level sets of conditional intensity (the times when alarm is on for each level of tau (alarm on proportion)) on the timeline. Once we have the alarms we can find prediction error. Once we have that we can compare ETAS and MDA and generate the error diagram. - Generate error diagrams
We could iterate over different levels of alarm coverage tau. We have now found a baseline for comparison against the MDA models we generate. - Iterate MDA to beat ETAS
We now have the framework set up to compare the MDA models we generate against ETAS
Resources and links:
-Our project:
stark slides
more stark slides
luen dissertation
luen slides
luen and stark paper
paper on math behind error diagrams(Molchan diagrams)
-ETAS model
overview of etas model
most recent etas model (Ogata 2011)
second most recent etas model (Ogata and Zhuang 2006)
etas parameter estimation
etas example lombardi paper
etas example paper china: geophysical interpretation of the ETAS parameters
implementation of the EM algorithm to estimate ETAS parameters
-ETAS R packages
PtProcess paper
PtProcess package
SAPP package
ETAS package
Curated Data to Analyzers
How is your data curation horizontal group planning to present the data to the analyzers? What format will the data be in? Where will you be storing the data, as mentioned in issue #1?
Role of Visualizers
We were curious as to what the role of the visualizer would look like moving forward. There are so many different types of visualizations and we have various skills, so we were wondering how our role would be split for this project.
SMART Goals & Task 2 Progress. Group 9. Chen.Kirschner.Liou.Tsai
Please follow the link below to our repository to view our SMART Goals and Task 2 progress:
https://github.com/joyyqchen/EarthquakeProject.Team-Chen.Kirschner.Liou.Tsai
MATLAB Code from USGS
I've been able to unpack the .tar file in Windows, and downloaded 7-zip, but running into a roadblock with the MATLAB file.
For the MATLAB code, part of a stochastic ETAS aftershock simulator program, that Professor Stark recommended as a resource, how would you recommend us using the product. Should we try and download a trial version, or does anyone in the class currently have access? Do we all need a copy of MATLAB?
Similarly, there is other code in C and Fortran from other resources, how should we approach these?
Matlab Computers on Campus
I know that access to Matlab has been a roadblock for some of the analyzers. Aside from the computer labs on the first floor of Moffit, there are also computer labs open on the basement floor and 3rd floor of Evans. To use either you need a class account, but for the basement floor lab, you can ask me privately for the username and password.
A enhanced tool for analyzers working on ETAS with R
Hi Analyzers,
If you feel the that all records from 1938 to 2013 is overwhelming, I just submitted a new tool which allows you to customize which records you want to keep in the PPX data structure. There is a sample of how to use it. Hopefully it is helpful. If you have any question, please let me know.
https://github.com/stat157/data-curators/blob/master/FlexiblePPX.R
Conference call with Luen
Hi all, I've received a reply from Dr. Luen about our request for holding a conference call with him during class so we can ask questions about his work and regarding our project. He has suggested scheduling the call at the beginning of class next Tuesday, November 19. Is that feasible for us?
Python for Data Science Webinar
Hi guys,
Think Big Analytics is offering a Python for Data Science Webinar tomorrow, right after class (11am-12pm). If you are interested in some of Python's advanced tools like Pandas or Matplotlib, this might be useful. Registration is here, but if the link doesn't work, you can go to TBA homepage and click on the middle box.
The event description says
The Python language combines human-friendly syntax, awesome libraries, and computational chops into one of the most powerful languages in the world today. This webinar provides practical tips for how to leverage Python in your data science projects. Mostly this will be specific code tricks and libraries to use, but will also discuss some more general principles (tradeoffs to make, code architecture, etc). To show you how this plays out “in the wild”, Field will also do a walk-through of a complete data science project.
This talk is geared toward people who have a “hello world” familiarity with Python, but who aren't familiar with it's more advanced tools.
On an unrelated note, some people at AT&T Research is working on an IPython Notebook equivalence for R!
Group Analyzer 3 SMART goal for Iteration 2
Goal for Nov 12.
S - Create a pseudocode to output a metric to measure the effectiveness of the ETAS model
M - We'll be able clearly understand how to measure a specific model
A - Alyssa - Understand in depth how to measure a model's performance.
Bonghyun - Write a pseudocode to output a metric
Alice - Write code using the given pseudocode [Doesn't have to be perfect]
R - We'll be able to have good understanding of measuring the model's performance.
T - Done by Monday night.
GitHub Repository for Analyzers
Everyone in the analyzers horizontal should already be a contributor to our GitHub repository from a month ago.
Everyone below is currently listed as a contributor; post if you're in the horizontal but not a contributor yet and we'll add you.
@kqdtran
@teresita
@taywon
@johnrisko
@aparker92
@amx01
@lauraccunningham
@bonghyun5
@gnolnait
IPython Notebook Talk by Fernando Pérez hosted by OCF
The Open Computing Facility is hosting an IPython Notebook talk by Fernando Pérez tomorrow, Friday (11/22) at 5 PM in 405 Soda Hall.
Fernando Pérez, the author of Interactive Python (IPython), is giving a hands-on talk/demo of IPython's shell and notebook features.
http://ipython.org/
http://ipython.org/notebook.html
Please come to the event with your laptop and install IPython (including IPython notebook) beforehand.
Error Analyzer PseudoCode
This is a psudoCode to generate the Error Diagram in R. This is for Analyzer group 3 + 1
Function to generate error diagram
data = Earth Quake Data
params = parameter for the ETAS Function
plotErrorDiagram = function(data, params) {
CI_Dist = #Generate Estimated Confidence Interval Distance for timeperiod of interest using the ETAS function and appropriate Parameters
CI_List = #Generate Confidence Interval Distance for each of the earthquake data points using the ETAS function and appropriate Parameters
#Generate error point given specific confidence interval
errorPoint = sapply(CI_Dist, function(ci) {mean(CI_List > ci)}
timePeriod = #Sequence of Time Period
#Generates the plot for the error diagram
plot(seq(0,1,length(timePeriod)), errorPoint[timePeriod],type = "l", xlab=expression(tau), ylab=expression(nu),main = "Training set Error Diagram", col="red")
}
etasMode = function(params) {
#Simply implement the ETAS Model.
}
Groupings
Hey guys,
On the list my group is signed up for the class management task, but I have been getting emails from the reproducibility group. I am in Analyzer Group 1/3 and am wondering which subject we should approach?
H@B D3 Workshop next week
Hi guys,
Hackers @ Berkeley is holding a D3.js workshop next Tuesday 11/12 at 6:30pm in Soda Hall. I'll update the exact location in this post later, but the current planned venue is 405 Soda. Looks like it is still taking place at 405 Soda Hall. You can also follow the Facebook event for more information.
Hope to see you guys there!
It's happening tonight!
Ya, not sure if the material will be posted, but if it does, I'll link it here!
Error Analyzer's Task Division
Overall Goal: Refactor the code to generate an error diagram given a dataset and a model.
Code is given: https://github.com/aparker92/error_analyzers/blob/master/etas-training.R
Each member of the group will try to create a function that will output what we need for the overall function to generate the plot.
Laura: Find out how etas.CI is given to us. Look at lines [25 - 27] in above R code.
Alyssa: Coordinate with the analyzer group 2 to homogenize the output for MDA model with the output for ETAS model we have now.
Tay:
Given the earthquake data, divide them up to {times, magnitude}.
Given start time and end time, get the period for them.
[Lines 1 - 20]
Alice:
Given you have training period, get number of training and testing set. Generate place holders for CI.dist and CI.list
[Lines 29 - 57]
Given you have parameters for ETAS model, and given you have the ETAS model, fill in CI.dist.
[Lines 24-27] [Lines 57-87]
Disi:
Given you have parameters for ETAS model and given you have ETAS model, fill in CI.list, which is values at event time.
[Lines 89 - 112]
Bonghyun:
Compile Everything from above
Given you have CI.list and CI.dist, generate sorted list for error plot
[Lines 116-135]
Given error plot numbers, plot it to error plot.
[Lines 140-144]
John:
Given list of timeperiod, and the Error Points, make a function to get the Area Under the Curve.
DEADLINES:
Everyone Except Bonghyun: 11/24 midnight.
Bonghyun: Monday night to compile everything.
Github Repo for Curators
Can we initialize a new Repo for our respective group?
Data Storage
How do we want to store the data?
WIll it be small enough to fit on github? Perhaps AWS?
How much of the data do we want to understand as a data curator?
How necessary is it to understand the earthquake terminologies and what each column is referring to during data curation?
(Would require us to do research on understanding how earthquakes work and what are characteristics of earthquakes that distinguish them from each other)
[Curators - Group 1] Deliverable: S.M.A.R.T. Goal
Kimberly Le (Technical Lead) @kimberlyle
Sherry Xia (Operational Lead) @xsherryxia
Arif Ali (Curator) @arifyali
David Barrera (Curator) @jest4pun
Wen Liang (Presenter) @wliang88
Finalized Error Diagram Code
Hello,
I have generated the code to produce error diagram for a given model in R.
https://github.com/aparker92/error_analyzers/blob/master/ErrorDiagram.R
Bonghyun
Notes in Prof. Stark's OH
Notes
Please attach your notes here if you also have attended the office hour.


Analyzer Subgroup 3 - R Task
Smart Goal for Nov 9
[S] Download the R package called "ETAS" and get sample data from the curators. Input the data into the ETAS model in R.
[M] If we can see some sort of graph using the ETAS model in R, we are successful.
[A] Since the scope of this specific subgroup's problem isn't too big, everyone in the group will try it.
[R] We will be able to reproduce some sort of graph using the ETAS model in R
[T] By next class
Dirks Inauguration Speech
Hi all!
Here is the Berkeley NewsCenter article regarding Dirks Inauguration speech-
https://newscenter.berkeley.edu/2013/11/12/behind-the-scenes-uc-berkeley-chancellor-dirks-inauguration/
Or better yet, here is the fully transcribed inauguration speech in PDF-
https://newscenter.berkeley.edu/wp-content/uploads/2013/11/DirksInauguralAddress.pdf
Group 3 + Group 1 Combined
Hello,
We have combined two of the Analyzer's group to tackle the problem of Error Evaluation for the models. Since the problem is one of the more essential tasks for, we figured two groups tackling this would be best for everyone.
Thanks
Data Scope
How much earthquake data will we be working with?
[Group Smile] SMART Goal - Task 1
Task 1: Preliminary Data Curation
Members:
Reena Shah (Operational Lead) @reenashah
Timothy Hoang (Analyzer) @timothyhoang
Tristan Tao (Technical Lead) @tristantao
David Wang (Presenter) @davidwang001
S.M.A.R.T. Goal:
- [S] Specific: Our current goal is to create a data curation program that extracts the files from a given URL and converts it to a CSV. This raw data can then be used by both the analyzers and the visualizers to carry out the specific tasks of the assignment.
- [M] Measurable: Our focus is producing a data frame that can be used by the other groups. If we can produce a data frame that other groups can implement, then we have achieved our goal. It is also important to ensure that the data frame is accurate, which is why we must conduct an integrity check.
- [A] Attainable: Our technical lead has contributed significantly to the project and maintains an understanding of how to appropriately extract the data. It will also be important to coordinate with the Analyzer and Visualizer groups to ensure that they know how to use the code to extract relevant data.
- [R] Relevant: This code is the first item in the conveyer belt of the project and is essential for other groups to begin their tasks.
- [T] Time-Bound: This task has already been completed, and has been shared with other groups on the GitHub.
[Visualizer - Task 8] - SMART GOALS
Used some of the other groups pages as reference! Thanks you guys:
#13
https://github.com/wliang88/Earthquake-Curators/blob/master/README.md
Members
Hong Shon @tzenarr - Presenter
Christina Ho @chocoho - Operational Lead, Visualizer
Sung Hoon Choi @shchoi - Visualizer
Jinsoo Lee (aka Jason) @annyeongjs - Visualizer
HyungKyu Chang @hkchang89 - Visualizer
OVERALL TASK - 8
Create Visual for ETAS and Alarm Data in Report
- Understand the parameters of the model
- What are our axes
- PDF versus CDF
- Create graph output for the coordinate data we receive from the analyzers - output the two graphs on the same coordinate plane
- Create a residual plot to compare the two models
- Is there a correlation between the two models? Is the residual plot white noise?
- How do we determine the fit between the lines in the plot?
S.M.A.R.T. Goals
Specific
- Create graph outputs for ETAS and Alarm Data based on the data provided by the analyzers
- Overlay two graphs on the same coordinate plane and compare
- Create a residual plot to compare the two models & determine if it is white noise
- Look for a correlation b/w the two models
Measurable
- (note all of this should be available after receiving the relevant data from analyzers)
- The data for each model will be measurable by its parameters and axes
- The fitness of the lines should be measurable (should come up with a way)
- If any, the correlation between the 2 models should be measurable
Attainable
- Contact analyzer groups to attain the data for visualization
- Our output is not attainable yet.
Relevant
- We thought it is a relevant idea to reach out for Brad Luen by identifying his current contact information and ask about - MDA model; -> We found that one of the vertical groups has already done so and supposedly got a reply back, which we should inquire them for.
- Will reach out for other visualizers to get a better picture of visualization of this project as a whole
Time bound
- By Sunday 10PM: post rough draft for SMART goals
- By Monday 11:59PM: post SMART goals; have an understanding of how our group fits into the big picture; get into contact with the other groups
- Most of our timeline is dependent on the timelines of the other groups (such as the analyzers)
ROADBLOCKS
- Difficulty in communicating with others
- To solve this, we tried contacting other groups using Github, Facebook, and office hours
- Our presenter met up with other presenters, and through this we were able to understand what the other groups are doing
- Visualizers created a Facebook group and tried to reorganize ourselves, following the analyzers' examples on Github
- Late group organization
- Because of this, we met up with each other twice, and kept in frequent contact via Facebook, Github, and phone apps
- Created a common Github issue tracker to organize our SMART goals (This one!)
Miscommunication & Confusion about the task list
On Thursday, I asked whether we can have a list of tasks and each individual group pick from there. Aaron said he wanted us break in a group of 2-5 people and work on a problem we came up, but make sure to communicate with other horizontal groups in terms of passing along information.
This task list was opened on Saturday. However, a lot of groups have already started tackling certain issues.
There have been miscommunication and confusion within the data curators, as well as a subgroup of the analyzers.
So, I would like to point out that there have been miscommunication and confusion. And my question is, if we have to pick one of the tasks list or if we can come up with goals of our own as long as they don't coincide with that of other groups?
Thanks.
Office hours with Professor Stark (on this Friday, November 15 at 1:30pm in 371 Evans)
Hi all, I ran into Professor Stark yesterday and took the opportunity to schedule office hours for us on this Friday, November 15 at 1:30pm in his chair office 371 Evans. I know many of us had a lot of questions to ask so please come if you can as he will soon be out of the country for a while.
-Disi
[Analyzer, SubGroup 2] S.M.A.R.T. Goals
Members:
Laura CUNNINGHAM (Operational Lead) @lauraccunningham
Disi KOA (Analyzer) @gnolnait
John RISKO (Analyzer) @johnrisko
Tay SHIN (Technical Lead) @taywon
S.M.A.R.T. Goals
- [S] Specific: As a group, John RISKO, Tay SHIN, Disi KOA, and I, want to produce a working function that incorporates the R packages ETAS, SAPP, and PtProcess, to understand a way of measuring error rates of alarm coverage by comparing our outputs with the MDA and simple Stark models. From the curators, we need a set of data to defining the temporal and magnitude aspects of our model, so we can compare, analyze, and help the visualizers produce visual representation of error rates of alarm coverage. To develop a better understanding of earthquakes models, we need to find a optimal relationship between time and error so we can understand earthquake modeling more accurately.
- [M] Measurable: Our results will conclude with a optimal result of which model best predicts the occurrence of an earthquake. Although our course has a definite end date, mid-December, our ability to understand the various models will adapt and change with time. We will have to halt our studies with a prediction of which model best suits our needs, yet can continue to be compared with changing data as time goes on.
- [A] Attainable: With coordination between the Curators & Visualizers we hope to use the
.ppxfile produced to understand parameters and outputs as a representation of earthquake model alarm error. Using R packages we want to accomplish a developed model of interesting information developing a clear relationship between time and error of earthquake model alarms. - [R] Relevant: As of now, we can produce sudo code and a simple subset to prepare a larger function we hope to run our model through in the future with the particular
.ppxfile given to us by the Curators. By looking at the various model types and understand the parameters and outputs clearly is where we can begin to understand how we are going to tackle out project. In the future we will use our acquired knowledge to understand where we will be getting out inputs from the.ppxand manipulating through analysis for our ETAS evaluation. - [T] Time-Bound: The semester concludes 18 December 2013.
Determining the domain and R packages to be used will be crucial in the formation of data we hope to evaluate.
Weekly Goals
- Use the SAPP program to estimate the model parameters:
- Week 1:
- Simulate a model using the ETAS model (Optional Step)
- This test the strength of our model against a data set created from the ETAS model.
- Simulate a model using the ETAS model (Optional Step)
- Week 2:
- Estimate conditional intensity over time. This step will help us create our alarms.
- Set up alarm function for ETAS from level sets of the conditional intensity over time.
- Week 3:
- Calculate the error rate through the simulated or real data set.
- We send to a visualizer group our error rate.
Helpful Links for Visualizers
- Visualizers
- GeoJSON Previewing Capabilities
- GeoJSON for Rendering Earthquake Data (@davidopluslau This might be helpful for your group's visualizations)
- 3D Model Viewing
- Task Lists & Task Lists in Gist
- GitHub Accounts
- USGS GitHub Account
- Anyone interested in understanding how Open Source Data is manifesting in other fields, like Open Government here on GitHub
- Even Oakland has a GitHub here
D3 team
Hey everyone,
I am trying to assemble a team of three or four to work on visualizations using d3. Please let me know if any of you are interested and we can talk more about it via email.
[Analyzers- plz read] -- Data Formats from Curators
The cleaned data that were produced by Curator subgroup 2 are in CSV formats, which are very large and currently unable to be pushed to git-hub.
Curator subgroup-Cache Money is trying to cache the clean data that were produced by Curator subgroup 2 onto google spreadsheets.
Analyzers, would you think these curated data may be the ones you want to use to analyze? If not, are there any other data formats you have in mind?
Thank you.
@xsherryxia
@arifyali
@kimbelyle
@jest4pun
Python Workshop
Hey guys,
I'm going to set up the Python workshop that Aaron mentioned in class today.
It's going to be from 1-4 on Saturday the 9th.
If people who are going to attend it can post comments here about what they would like to learn, that would really help Aaron prepare. Personally, I think we have lots of people here (myself included) who do not know a single line of code on Python, so I was hoping we start with the very basic material, and work through it together from data curation to visualization (if we have time).
Geographic location of our project
Are we basing our models on any specific regions or the entire world? The data set mentioned in Professor Stark's lecture is from Southern California. http://www.data.scec.org/eq-catalogs/date_mag_loc.php
Recommend Projects
-
 React
React
A declarative, efficient, and flexible JavaScript library for building user interfaces.
-
Vue.js
🖖 Vue.js is a progressive, incrementally-adoptable JavaScript framework for building UI on the web.
-
 Typescript
TypeScript is a superset of JavaScript that compiles to clean JavaScript output.
-
TensorFlow
An Open Source Machine Learning Framework for Everyone
-
Django
The Web framework for perfectionists with deadlines.
-
 Laravel
A PHP framework for web artisans
-
D3
Bring data to life with SVG, Canvas and HTML. 📊📈🎉
-
Recommend Topics
-
javascript
JavaScript (JS) is a lightweight interpreted programming language with first-class functions.
-
web
Some thing interesting about web. New door for the world.
-
server
A server is a program made to process requests and deliver data to clients.
-
Machine learning
Machine learning is a way of modeling and interpreting data that allows a piece of software to respond intelligently.
-
Visualization
Some thing interesting about visualization, use data art
-
Game
Some thing interesting about game, make everyone happy.
Recommend Org
-
Facebook
We are working to build community through open source technology. NB: members must have two-factor auth.
-
Microsoft
Open source projects and samples from Microsoft.
-
Google
Google ❤️ Open Source for everyone.
-
Alibaba
Alibaba Open Source for everyone
-
D3
Data-Driven Documents codes.
-
Tencent
China tencent open source team.