Code Monkey home page Code Monkey logo

serialchart's Introduction

SerialChart is an open source application developed by Sergiu Baluta. SerialChart is used for real-time charting of data sent via serial (RS-232) port. It supports other types of ports via plugins and WebView javascript integration. The modular design allows the motivtated coder to add new type of ports, decoders, and display filters. The basic data processing workflow is:

PORT (RAW DATA FROM SERIAL/USB PORT) -> DECODER(PROCESSES DATA) -> VALUES(displayed on screen/chart)

For basic users, a compiled read-to-use version can be downloaded at the official Serial Chart webpage: http://starlino.com/serialchart

For sample usage with a micro-controller (Arduino) project see: http://starlino.com/imu_kalman_arduino.html

http://starlino.com/data/imu_kalman_arduino/imu_arduino_serial_chart.png

Configuration file syntax for SerialChart application (.scc files)

Introduction

SerialChart configuration is done through a text file. The general format of the file is as follows:

[section1]
param1 = value
param2 = value
...

[section2]
param1 = value
param2 = value

Setup Section

Each configuration file starts with the [_setup_] section, here you can setup global parameters. For example:

[_setup_]
port=COM3   
baudrate=57600

width=1000
height=201
background_color = white

grid_h_origin = 100
grid_h_step = 10
grid_h_color = #EEE
grid_h_origin_color = #CCC

grid_v_origin = 0
grid_v_step = 10
grid_v_color = #EEE
grid_v_origin_color = transparent

Below are the parameters that can be used in the [_setup_] section:

port

Specifies the communication port to which the software connects. For ex: COM1,COM2,..

baudrate

Baudrate in bps (bits per second). Only certain values are currently supported: 110,300,600,1200,2400,9600,19200,38400,57600,115200.

Please note that currently no flow control parameters are supported, and parity will default to "none", stop bits defaults to 1, as these are most common values.

width, height

width and height of the chart area in pixels

background_color

Background color of the chart.

Note about color formats Please note that colors in .SCC files can be specified in hex format (for ex: #FFF, or #FFFFFF) or named color (white,blue,magenta,pink,gray) see: http://www.w3.org/TR/SVG/types.html#ColorKeywords . Please note the special value transparent which means "no color". You can use it if you don't want some elements to be drawn at all.

grid_h_origin, grid_v_origin

Both horizontal and vertical grids will have an origin axis line, usually of different color from the regular grid lines. These parameters specifies the shift of this line from top/left borders of chart in pixels.

grid_h_origin_color, grid_v_origin_color

Color of the grid origin (axis) line.

grid_h_step, grid_v_step

Draw a grid line at each step of pixels from the origin line.

grid_h_color, grid_v_color

Color of regular grid lines.

decoder

Specify CSV decoding (default)

decoder = csv

Specify binary decoding

decoder = bin

Specify HDLC-style decoding

decoder =hdlc
hdlc_esc =7d
hdlc_sep =7e
hdlc_xor =20

display

Display raw data coming from port (default)

display = raw

Display data as a list of values

display = list
display_sep = ,
display_skip_transparent = 1

Please note that the separator can be specified in Percent Encoded string for example for a TAB separated list use:

display = list
display_sep = %09

Tip: TAB separated values can be easily Copy & Pasted into an Excel spreadsheet. (In Excel use Paste > Paste Special and select Text as format).

Display data as HEX string

display = hex

Open a USB HID device (keyboard/mouse/gamepad)

port = HID   
vid = 0079
pid = 5d0f

Tip: use an utility like USBDeview http://www.nirsoft.net/utils/usb_devices_view.html to find the vendor and product IDs of a specific device (VID/PID).

Default and Field Sections

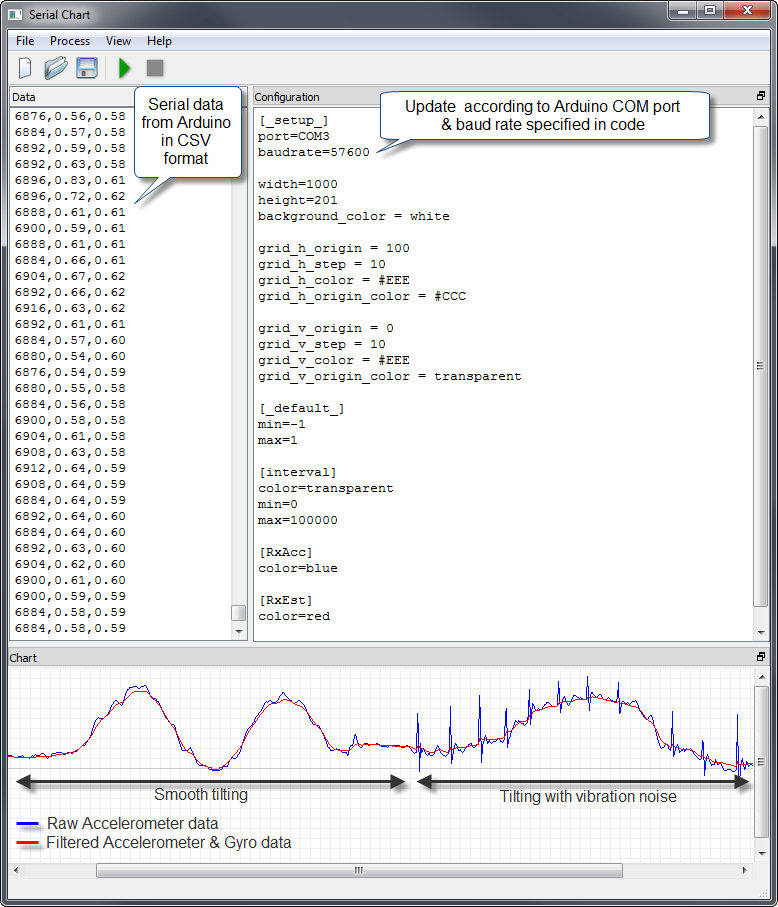
SerialChart accepts packets in CSV format (other formats might be supported in the future). Each packet comes on a separate line and each field value is separated by comma. Here is an example of sample data that SerialChart would receive:

100,0.50,0.70
101,0.30,0.50
102,0.25,0.35

The purpose of the following sections in the configuration file is to specify parameters for each field in the packet. For example:

[_default_]
min=-1
max=1

[Field1]
color=gray
min=0
max=255

[Field2]
color=blue

[Field3]
color=red

You can specify parameters that would apply by default to all fields in the [_default_] section. These parameters will apply to all field sections unless they will be overridden in the field section by parameters with the same name.

In the example above note that Field2 and Field3 will inherit min=-1 and max=1 from the [_default_] section. However Field1 will override these values with min=0 and max=255

After you have defined the default parameters, you should define one section for each field that will be received in a packet. Field sections should be in the order in which they are received in the packet.

The name of field sections can be chosen randomly but should be distinct from the reserved section names _setup_, _default_. For that matter avoid any names that start and end with _.

Below is an explanation of the parameters accepted in the [_default_] and field sections:

min,max

These are the field values that correspond to the top and bottom lines of the chart. In other words if you specify min = -1 and max = 1. A value of -1 will be plotted at the top border of the chart , and a value of 1 will be plotted at the bottom border of the chart. A value of 0 (which is is the midpoint between -1 and 1) will be plotted at the middle of the chart. Field values are linearly mapped from [min,max] range to [0,height] range where height is the chart height in pixels, specified in the setup section.

color

This is the color used to plot a field value. Use transparent color value if you don't want a specific field to be plotted.

dash

Creates an interrupted line. For example: dash = 3 will render 3 samples then will not render the next 3 samples, then render 3 samples, then again pause for 3 samples and so on...

Specify data length/type for BIN/HDLC decodings

type = byte / sbyte / word / sword / float

Specify data Endianness

see http://en.wikipedia.org/wiki/Endianness

endian  = msbf / lsbf

msbf -> most significant byte first lsbf -> least significant byte first

Specify data format for custom display (ex: display = list)

format = %g / %f / %d / %n / %s / %x

%n -> field name

%f -> float, format as -9.9

%g -> float, format as -9.9 or -9.9e+9 whichever is shorter

%d -> decimal integer

%s -> raw data for this value

%x -> hex of raw data

You can combine formats as follows:

[MyField]
type = float
precision = 3
format = %n = %f

will output for ex:

... , MyField = 1.123 , ...

Set precision of floats in format

precision = 6   

Here is how this formatting is applied (providing source code) :

v.replace(QByteArray("%g"),QByteArray::number(packetValues[i].toDouble(),'g',precision));
v.replace(QByteArray("%f"),QByteArray::number(packetValues[i].toDouble(),'f',precision));
v.replace(QByteArray("%d"),QByteArray::number(packetValues[i].toInt(),'f',0));
v.replace(QByteArray("%n"),field.toAscii());
v.replace(QByteArray("%s"),packetParts[i]);
v.replace(QByteArray("%x"),packetParts[i].toHex());

Using h_origin and pitch field parameters

Example:

[Field1]
h_origin = 50
pitch = 10

Use h_origin to specify what horizontal line corresponds to the field value of 0. So , in the example above 0 will be charted 50 pixels below the top border of the chart.

Use pitch to specify how many units of field's value correspond to 1 pixel on the chart. So in the example above Field1 = 20 will be charted at 50 - 20 / 10 = 48 pixels below the top border of the chart.

Please note that h_origin and pitch, just like any other field parameter, can be specified in the [_default_] section to apply by default to all fields.

If no h_origin or pitch is specified then it is calculated automatically based on field's min / max parameters, so that a value of max is always charted on the top-most line of the chart , and min value is charted on the bottom line on the chart.

Sending Data

As of version 0.3.2 it is possible to send data to COM ports. This can be done either by using the send box or automatically from configuration file (on run or stop).

The sent strings supports following escaped characters:

\\  ->  \
\n  ->  0x0A  (line end)
\r  ->  0x0D  (line feed)
\t  ->  0x07  (tab) 
\xAB -> byte with hex code AB
\d123 -> byte with decimal code 123

[_setup_] section

send_run

send a string when port is opened (run button clicked)

send_run = +++\nAT\n

send_stop

send a string when port is closed (stop button clicked)

send_stop = exit\n

serialchart's People

Contributors

starlino avatar

Stargazers

 avatar  avatar  avatar  avatar  avatar  avatar  avatar  avatar  avatar  avatar  avatar  avatar  avatar  avatar  avatar  avatar  avatar  avatar  avatar  avatar  avatar  avatar  avatar  avatar  avatar  avatar  avatar  avatar  avatar  avatar  avatar  avatar  avatar  avatar  avatar  avatar  avatar  avatar  avatar  avatar  avatar  avatar  avatar  avatar  avatar  avatar  avatar  avatar  avatar  avatar  avatar  avatar  avatar  avatar  avatar  avatar  avatar  avatar  avatar  avatar  avatar  avatar  avatar  avatar  avatar  avatar  avatar  avatar  avatar  avatar  avatar  avatar  avatar  avatar  avatar  avatar  avatar  avatar  avatar  avatar  avatar  avatar  avatar  avatar  avatar  avatar  avatar  avatar  avatar  avatar  avatar  avatar  avatar  avatar  avatar  avatar  avatar  avatar  avatar  avatar

Watchers

 avatar  avatar  avatar  avatar  avatar  avatar  avatar  avatar  avatar  avatar  avatar  avatar  avatar  avatar  avatar

serialchart's Issues

32-bit issue

What steps will reproduce the problem?
1. 32-bit Windows 7 or a 32-bit Windows XP
2.
3.

What is the expected output? What do you see instead?
Installing the actual program onto the computer. Gives a software 
incompatibility error.

What version of the product are you using? On what operating system?
v1.0 release date 08/23/11

Please provide any additional information below.
I've been recieving the same error message for 32-bit windows systems however I 
have gotten it to install on the Windows 7 64-bit system


Original issue reported on code.google.com by [email protected] on 12 Oct 2012 at 2:41

serial problem

What steps will reproduce the problem?
1. download program to the arduino 
2. open the exact file of serial chart  
3. then run 

What is the expected output? What do you see instead?
there should exist a graph in the chart zone of serial chart,but,nothing,and no 
data out from the data zone 

What version of the product are you using? On what operating system?
 latest version   ; win7 32bit

Please provide any additional information below.

I am using this with mpu6050 and arduino .it is expected to put out the data of 
accel ,ax ay az in the data zone and graph in the chart zone.there is really 
data out the serial(i test it in the serial monitor)

Original issue reported on code.google.com by [email protected] on 20 Mar 2014 at 3:47

Attachments:

cannot open virtual com poert such as FTDI on Arduino

What steps will reproduce the problem?
1. try to open a port to a virtual serial port (ie ftdi on Arduino)
2.
3.

What is the expected output? What do you see instead?

Expect it to open COM10 for example, instead "cannot open COM10, make sure the 
port is avaialable and not in use by another application"


What version of the product are you using? On what operating system?


Please provide any additional information below.


Original issue reported on code.google.com by [email protected] on 27 Mar 2013 at 9:47

Improvement request: save data to file

Add the possibility to save serial incoming data to a local file (named, for example, with date and time of first acquisition). If the file is too large, or larger than a specified value, a new file should be created.

Application Closes Unexpectedly

What steps will reproduce the problem?
1. Open SerialChart
2. Open Config File
3. Run SerialChart

What is the expected output? What do you see instead?
Expect chart output, application closes instead

What version of the product are you using? On what operating system?
Don't know where to find the version of the software.  Running on Windows XP

Please provide any additional information below.


Original issue reported on code.google.com by [email protected] on 18 Sep 2012 at 2:04

Serial chart says that the com port is busy when its not

What steps will reproduce the problem?
1. Set up to read data from arduino
2. Run
3.

What is the expected output? What do you see instead?
I expected the soft to connect to Serial port and display a graph. I get an 
error that the soft can't connect to configured COM port. I am sure that i 
closed all other applications and even unplugged and plugged the usb cable 
again and still nothing. g

What version of the product are you using? On what operating system?
I am using the most recent Serial Chart on windows 7 32 bit. 

Please provide any additional information below.
Somehow i believe that it must be something with windows 7

Original issue reported on code.google.com by [email protected] on 27 Nov 2011 at 9:33

Data not showing

What steps will reproduce the problem?
I took example configuration from this 
site:http://www.starlino.com/imu_kalman_arduino.html and modify it to my 
needs(I changed COM port number and speed). I get no data. I have tryed it with 
Hterm (terminal emulator), and data is displayed correctly


What is the expected output? What do you see instead?
Data from microcontroller. But nothing comes through

What version of the product are you using? On what operating system?
Win 7 64-bit

Please provide any additional information below.
I'm using AVR programmed in C. But as I said before in terminal emulator 
everything is displayed correctly (in format: number;number\n
example:
13;7
10;5
etc..)

Original issue reported on code.google.com by [email protected] on 10 Jul 2012 at 11:38

NO chart plot

Information from the designated COM port received (ASCII characters)and visible 
in data window.
Graphing parameters set up appears to be working OK.
Received data does not appear in the graphing window. Is this because of the 
data format (ie ASCII) or what? 
Any help provided would be greatly appreciated.

Original issue reported on code.google.com by [email protected] on 7 Jun 2015 at 7:12

SerialChart.exe fails to start

In the first instance this is for reference, as I feel that other users might stumble across the same issue.

I downloaded the read-to-use version as advised. But when I run SerialChart.exe an error occurs:
This application failed to start because it could not find or load the Qt platform plugin "windows".
Available platform plugins are: windows
Reinstalling the application may fix this problem.

To fix this issue, I had to install qt-opensource-windows-x86-mingw48_opengl-5.2.1.exe and extend the Windows environment:
set QT_QPA_PLATFORM_PLUGIN_PATH=C:\Qt\Qt5.2.1\5.2.1\mingw48_32\plugins\platforms\ (http://stackoverflow.com/questions/20495620/qt-5-1-1-application-failed-to-start-because-platform-plugin-windows-is-missi#comment50075432_24192521)

Crash of program after clicking "stop

What steps will reproduce the problem?
1. running the program normally, everything is fine.
2. click on the red stop button -> program crashes

What is the expected output? What do you see instead?
I want to see the process stopped to change Configuration and save data, but 
program crashes.

What version of the product are you using? On what operating system?
Windows Installation (released 8-13-2011) on Windows XP, SP3

Please provide any additional information below.

this config file i used:

[_setup_]
port=COM2
baudrate=9600
width=1000
height=200
background_color = white
grid_h_origin = 0
grid_h_step = 200
grid_h_color = #EEE
grid_h_origin_color = #CCC
grid_v_origin = 0
grid_v_step = 200
grid_v_color = #EEE
grid_v_origin_color = #CCC


[_default_]
min=1000
max=2000

[Output1]
color=blue

[Output2]
color=green

[Output3]
color=red


Original issue reported on code.google.com by [email protected] on 6 Apr 2015 at 11:19

Attachments:

Recommend Projects

  • React photo React

    A declarative, efficient, and flexible JavaScript library for building user interfaces.

  • Vue.js photo Vue.js

    ๐Ÿ–– Vue.js is a progressive, incrementally-adoptable JavaScript framework for building UI on the web.

  • Typescript photo Typescript

    TypeScript is a superset of JavaScript that compiles to clean JavaScript output.

  • TensorFlow photo TensorFlow

    An Open Source Machine Learning Framework for Everyone

  • Django photo Django

    The Web framework for perfectionists with deadlines.

  • D3 photo D3

    Bring data to life with SVG, Canvas and HTML. ๐Ÿ“Š๐Ÿ“ˆ๐ŸŽ‰

Recommend Topics

  • javascript

    JavaScript (JS) is a lightweight interpreted programming language with first-class functions.

  • web

    Some thing interesting about web. New door for the world.

  • server

    A server is a program made to process requests and deliver data to clients.

  • Machine learning

    Machine learning is a way of modeling and interpreting data that allows a piece of software to respond intelligently.

  • Game

    Some thing interesting about game, make everyone happy.

Recommend Org

  • Facebook photo Facebook

    We are working to build community through open source technology. NB: members must have two-factor auth.

  • Microsoft photo Microsoft

    Open source projects and samples from Microsoft.

  • Google photo Google

    Google โค๏ธ Open Source for everyone.

  • D3 photo D3

    Data-Driven Documents codes.