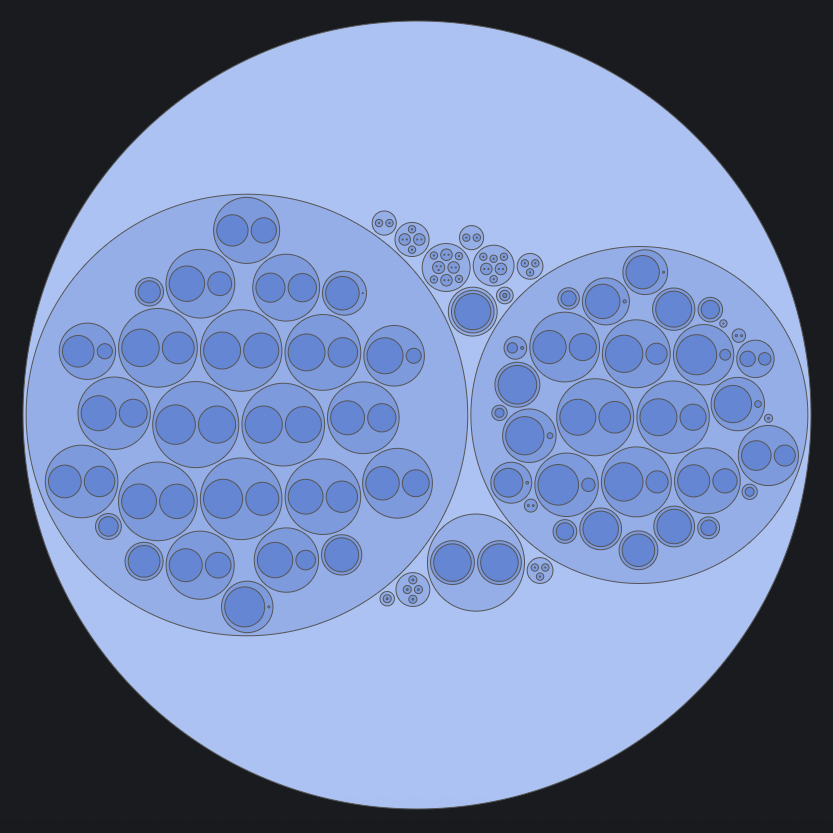
This panel is meant to have a centralized view of any component in the form of a bubble chart. Circles are grouped together into clusters based on tag values and circle size and color represents the aggregated value of time series data.
Circles are grouped in multiple clusters as per alias format. Tag values separated by a group separator in alias field define chart hierarchy and grouping. For e.g. '$tag_dc,$tag_host' or 'DataCenter: $tag_dc, Host: $tag_host' will group all hosts under each data center circle. By default, a comma is a group separator which can be changed under 'Options' tab.

- Show Text - Enable/Disable the text display within a circle.
- Stat - Aggregate data same as singlestat panel.
- Unit - Formats same as singlestate panel. Mouse hover on any circle will display the formatted value.
- Group Separator - Tag values separator in Alias for grouping.
- Color Schemes - Multiple color schemes.
- Group - In grouping scheme, circles are colored as per their grouping.
- Colors - Start and end range of colors for group hierarchy.
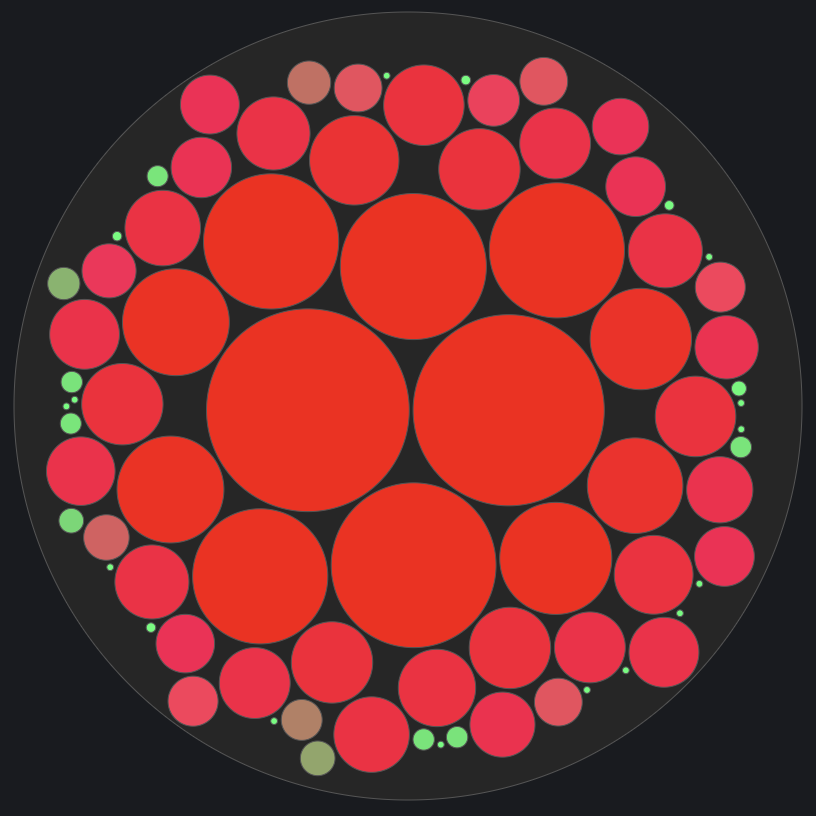
- Threshold - In threshold scheme, circles are colored as per threshold values.
- Thresholds - Threshold values.
- Colors - Colors for different threshold values.
- Gradient - In gradient scheme, circles are colored as per component value.
- Thresholds - Threshold values.
- Colors - Colors for gradient scale.
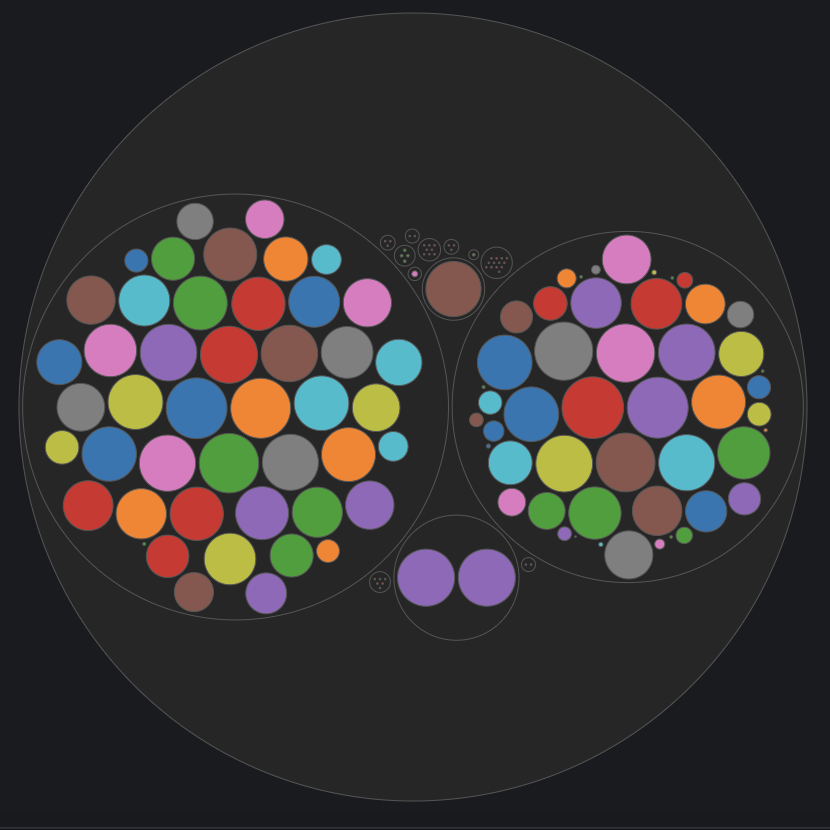
- Unique - In the unique scheme, different colors categories are applied to circles.
- Group - In grouping scheme, circles are colored as per their grouping.
Tested against following databases.
- OpenTSDB
- Bosun
- MySQL
- Use CONCAT function for the metric field in SQL expression to achieve multiple group hierarchy.
SELECT
UNIX_TIMESTAMP(date) as time_sec,
amt as value,
CONCAT(server, ',', org) as metric
FROM trade
WHERE $__timeFilter(date)
ORDER BY date ASC
Hopefully, it would work with other databases also.

- v1.0.0
- Initial commit.
- v1.1.0
- Compatability to Grafana 5.0.0 release.
- Changed outer circle tooltip name to panel title name.
- Fixes Tags not readable. CSS collision
- Fixes MySQL datasource example for grouping.
- Fixes Label artifact left behind on refresh.
- Fixes Chart is not show in combination with other d3 based plugin.
- v1.2.0

