
The goal of this project is to predict the demand for taxis at different hours of the day. The data used for this project includes the number of rides per daytime and various features that can be extracted from the date and time, such as the day of the week, holidays etc or can join on the datetime column as season, weather, etc. The main objective is to identify patterns and trends in the data and use them to make accurate predictions about future taxi demand.
Initially, the project aims to answer basic questions about trends and causality in the data.
Example for question and answer : Is the number of rides derived from a normal distribution?

Simple baselines are also created to establish a benchmark for comparison. The first baseline does not use any data from the test set, while the second one uses data from the test set. An example of a baseline that uses different time periods for predicting future demand.

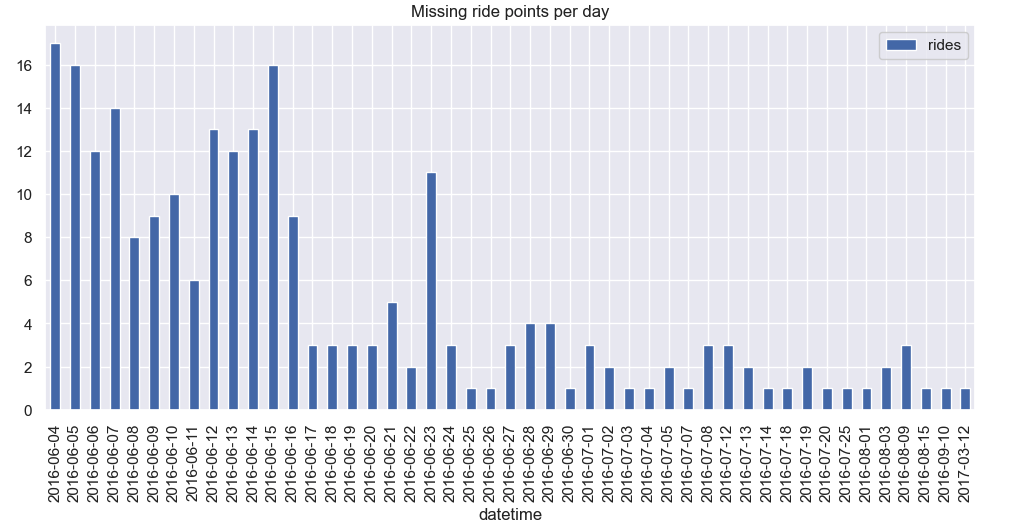
We also perform Exploratory Data Analysis (EDA) to understand the distribution of the data, identify outliers and missing values, and uncover any underlying patterns or trends.
missing target data points across dates
Two models are created to predict taxi demand. The first model is a regular ML model (CatBoost Regressor) that uses independent samples to predict demand. This model is trained using a set of features such as the day of the week, season, and weather, and the goal is to find the best set of features that can improve the accuracy of the predictions. The second model is a time series model, specifically a vanilla LSTM architecture, which is used to show how to use models that are built for time series cases and can generate features by themselves. The LSTM model is trained on the time series data of taxi demand, and the goal is to see how well it can capture the temporal dependencies in the data. Additionally, we do not add additional features even though we believe it could improve the LSTM model, for the sake of simplicity.
Once the models are trained, we evaluate their performance using mean absolute error (MAE). For further research, additional metrics such as mean squared error (MSE) and root mean squared error (RMSE) would also be used. We also perform a visual comparison of the predicted values with the true values to understand the level of accuracy and identify any patterns or trends in the errors.
Please note that this is a first and short iteration, and its main goal is to prove the concept. Given this, there is a lot of room for improvement and further research. Some things that could be added include:
- Grid search to optimize model parameters
- Comparison with other time series models such as ARIMA
- Comparison with other ml models such as regression, loightGBM etc
- Further EDA to uncover more insights from the data
- Showing the differences between the results of the test and train sets
- Testing the statistics of the results, such as the mean, max errors and median
- Adding more features from external sources
- Plotting the error against time
- Adding a histogram of errors for better visualization.
- Cross validation.
- Using standard pipeline functionality that exists as part of the scikit-learn framework.
Please note that the code for this project is not written in classes as is typically done. Instead, the code is organized in a procedural manner for simplicity and ease of understanding.