Code Monkey home page Code Monkey logo

speckle-powerbi-visuals's Introduction


Speckle | PowerBI Visuals

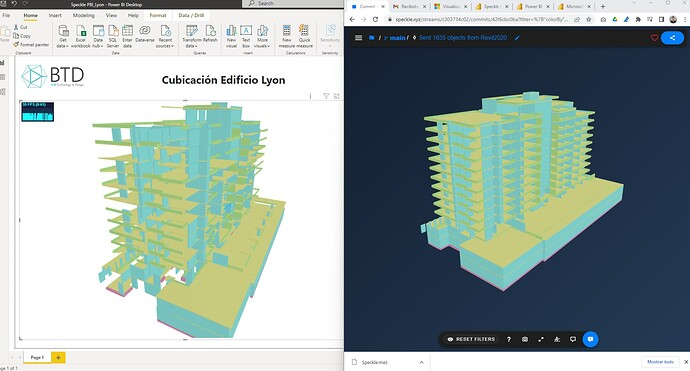
3D Viewer for PowerBI and more... Expected use case is that the visual displays data pulled from Speckle via the Speckle Data Connector for PowerBI (https://github.com/specklesystems/speckle-powerbi)

⚠️ This repo is still in very early stages of development, use at your own risk!

Speckle is data infrastructure for the AEC industry.


Twitter Follow Community forum users website docs

About Speckle

What is Speckle? Check our YouTube Video Views

Features

  • Object-based: say goodbye to files! Speckle is the first object based platform for the AEC industry
  • Version control: Speckle is the Git & Hub for geometry and BIM data
  • Collaboration: share your designs collaborate with others
  • 3D Viewer: see your CAD and BIM models online, share and embed them anywhere
  • Interoperability: get your CAD and BIM models into other software without exporting or importing
  • Real time: get real time updates and notifications and changes
  • GraphQL API: get what you need anywhere you want it
  • Webhooks: the base for a automation and next-gen pipelines
  • Built for developers: we are building Speckle with developers in mind and got tools for every stack
  • Built for the AEC industry: Speckle connectors are plugins for the most common software used in the industry such as Revit, Rhino, Grasshopper, AutoCAD, Civil 3D, Excel, Unreal Engine, Unity, QGIS, Blender and more!

Try Speckle now!

Give Speckle a try in no time by:

  • speckle ⇒ creating an account
  • create a droplet ⇒ deploying an instance in 1 click

Resources

  • Community forum users for help, feature requests or just to hang with other speckle enthusiasts, check out our community forum!
  • website our tutorials portal is full of resources to get you started using Speckle
  • docs reference on almost any end-user and developer functionality

Untitled

Repo structure

This repo follows the default structure of any Custom PowerBI Visual, generated by the pbiviz tool.

For now, it only contains a single visual -> The Speckle 3D Viewer

For more information about how a PowerBI visual is structured, you can check out the official documentation

Other repos

Make sure to also check and ⭐️ these other Speckle repositories:

Developing and Debugging

There's a neat guide on setting up your environment for developing visuals here

You'll need to properly set up the certificate in order to be able to use the hot-reloading feature.

Hot Reload will only work on PowerBI Web (not on Desktop).

Contributing

Please make sure you read the contribution guidelines for an overview of the best practices we try to follow.

Security

For any security vulnerabilities or concerns, please contact us directly at security[at]speckle.systems.

License

Unless otherwise described, the code in this repository is licensed under the Apache-2.0 License. Please note that some modules, extensions or code herein might be otherwise licensed. This is indicated either in the root of the containing folder under a different license file, or in the respective file's header. If you have any questions, don't hesitate to get in touch with us via email.

speckle-powerbi-visuals's People

Contributors

alanrynne avatar garylzimmer avatar

Stargazers

 avatar  avatar  avatar  avatar  avatar  avatar  avatar  avatar  avatar  avatar  avatar  avatar  avatar  avatar  avatar  avatar  avatar  avatar  avatar  avatar  avatar  avatar  avatar  avatar  avatar  avatar

Watchers

 avatar  avatar  avatar  avatar

speckle-powerbi-visuals's Issues

Figure out authentication strategy for visual

From #10 and #11

Viewer cannot fetch data from private streams due to it lacking access to the Data Connector token.

Not sure if this is something that can be provided, or if we're going to have to re-invent the wheel on this one.

Possible options:

  • Have the Data Connector pass the token to the Visual (not sure if it is doable)
  • Have the visual receive the actual objects from the data connector instead of fetching them

Adopt new `FormattingModel` class for settings

PowerBI API was switched their settings implementation to a new Formatting Model, including a set of utilities released as an npm package.

More info here:

This will enable a better abstraction between the settings panel and the actual visual, and provide more control on how visual settings are displayed.

Precursor to enabling Conditional Coloring and Color slices.

bug: Visual Issues with GH data

Description

When working on Grasshopper to Power BI workflow for a tutorial, i faced a bug. I created a Speckle object inside Grasshopper. I connected the GH geometry as the displayValue key for the object. And I added two custom parameters too, Area and Department.

image

I received this data in Power BI and filtered out only Speckle objects from the flat list of elements. I visualized the GH data in 3D using 3D Viewer Visual. But there are 3 issues when using Visual with Speckle data:

  1. Selection doesn't work when i connect "Filtered" data

When i receive Grasshopper data in Power BI and filter only the Speckle objects i created (and remove meshes and breps from the Source data), selection items in the Visual stops working.

PBIDesktop_ki1l7yp1JI

  1. Shadows are way too dark

PBIDesktop_fGDRoHX4Tm

  1. Inconsistent behavior: Visual Zooms in when tooltip info connected

When i connect "Department" key that i extracted from the received data as the "Tooltip Info", Visual zooms in for whatever reason. Zoom Extent on change option is turned on.

PBIDesktop_omK0GXLgbD

Sometimes i couldn't reproduce this.

Streams Used

https://speckle.xyz/streams/4f6eeaa421/branches/intro-gh-powerbi

Split highlight and filtering logic into 2 input fields

Currently, Object Data is used as a way to:

  • Color objects in the viewer based on a specific property
  • Enable object highlighting when connected

Instead, we should keep Object Data for the source of the tooltips (#16) and create a new Color By property to use exclusively to drive the color filtering.

The way the PowerBI api works, adding data to any of the 2 fields will effectively enable highlighting, so the current way of doing things (filter + highlight in a single input) will continue to work.

bug: 3D Viewer Visual doesn’t correctly color by parameter

Description

Related to this thread reported by Mohamed_Manseur.

3D Viewer Visual does not color objects by parameter values. This can be tested and confirmed using the files/commit below👇.

Expected Behaviour

Correctly coloring by the parameter value.

Streams/Commits Used

https://speckle.xyz/streams/8ae610689c/commits/d633cd7548

Files Used

[Hopital test.pbix](https://s3-us-west-2.amazonaws.com/secure.notion-static.com/ba213fba-c506-434a-8060-ce9ec134bc02/Hopital_test.pbix)

Screenshots

image

Store viewer state using LocalStorage API

PowerBi visuals have a LocalStorage API that allows to save some data. This API also allows for multiple visuals of the same type to share that localStorage data.

https://learn.microsoft.com/en-us/power-bi/developer/visuals/local-storage

This could be potentially used to sync up store the "last known view" of a report for a given user, sync up multiple viewer cameras, and other neat stuff... although it may be a pipe-dream

For now, we could just store some info on the viewer state so that hard reloads wouldn't reset your last known view.

Errors with packaging of Speckle

I am getting 6 errors when I do pbiviz start

Prerequisites

What package are you referring to?

https://github.com/specklesystems/speckle-powerbi-visuals/tree/main/src

Describe the bug

When I run the command pbiviz start I am getting 6 errors related to the webpack tool.

To Reproduce

  1. Go to (https://github.com/specklesystems/speckle-powerbi-visuals/tree/main/src)
  2. Download and unpack the sources
  3. Open Powershell with the directory containing the source code
  4. Run pbiviz start

Expected behavior

On the Power BI Service the developer's visual must show a content but it shows the error

Screenshots

2023-08-16 06_26_05-

Image20230816062824

System Info

Desktop (please complete the following information):

  • Windows 10 x64
  • Chrome Version 115.0.5790.171 (Official Build) (64-bit)

Smartphone (please complete the following information):

Failure Logs

build_package.log.txt

Additional context

Proposed Solution (if any)

Answer here please

Optional: Affected Projects

Add viewer controls for Views and SectionBox

Similar to what the viewer already does, we need to add some buttons to enable:

  • Selecting available views in the loaded models
  • Activating the section box.

Ideally, we should use the new @speckle/ui-components for this purpose.

Dependent on switching the Visual to work with Vue #30

bug: Power BI parameters and 3D viewer Visual

Description

They are using Power BI parameters to quickly switch between different Speckle models. Our 3D Viewer currently doesn’t play nicely with this. When switched to a different model, previous version is still visible in the viewer as greyed out.

@bimgeek can reproduce this.

Screenshots

PBIDesktop_eOtyspwkrB

bug: Geometry from Sketchup not visible

Description

Geometry sent from Sketchup received successfully but can not be viewed in 3D Viewer Visual.

Expected Behaviour

View the geometry in 3D Viewer Visual, regardless of its source application.

Steps to reproduce

  1. Receive below stream in PowerBI👇
  2. Add 3D Viewer Visual
  3. Connect Stream URL and Object ID inputs.
  4. You will not be able to view any geometry in the Viewer.

Streams/Commits Used

https://latest.speckle.dev/streams/5ae0332cc7/branches/sketchup

Screenshots

image

Reload Visual When filtering

What package are you referring to?

Alpha 5

Describe the bug

Trying Alpha 5 release, I noticed that loading is much faster than before (batch loading). Great Improvement!! Thanks
But when I filter data, it is like those elements are removed from the 3D visual, and when I undo the filter, It start loading again (for those filtered elements). I think normal behavior should be to "Gray Out" filtered elements from visualization, so you don't have to fetch elements again. (Just fetch the first time you open Power BI).

Best Regards

To Reproduce

Try filtering data in any project

Screenshots

screenshot1
screenshot2
screenshot3

Add context menu support

PowerBI visuals can have context-menu support when right-clicking our visual.

This can be used to show extra options on a "Visual" level, or even on an object by object level (i.e. show meta data, or additional actions to be performed)

Add tracking

We're currently not reporting any metrics to MixPanel.

Ideally, we would want per-user metrics but that may prove tricky to implement so initially we can:

  • Add authentication to the Viewer, using the token in the DataConnector when available.
  • Report all metrics using the token of the report owner (instead of the user viewing it).

This ensures that there are no access mismatches between the viewer credentials and the DataConnector credentials.

Inputs / Colors / Slicers

Helloo :)

I noticed a couple of things while trying the PowerBI connector:

  • Slicers do not affect the model
  • Colors are not/no longer functional no matter what data is loaded
  • Changing inputs (URL, object ID, etc.) involves deleting and reloading the viewer.

Any fixes in perspective?

bug: Geometry sent from Rhino not visible

Description

Geometry sent from Rhino received successfully but can not be viewed in 3D Viewer Visual.

Expected Behaviour

View the geometry in 3D Viewer Visual, regardless of its source application.

Steps to reproduce

  1. Receive below stream in PowerBI👇
  2. Add 3D Viewer Visual
  3. Connect Stream URL and Object ID inputs.
  4. You will not be able to view any geometry in the Viewer.

Streams/Commits Used

https://latest.speckle.dev/streams/5ae0332cc7/branches/rhino

Screenshots

PBIDesktop_b0vzF8gfHi

PowerBI uses ctrl+click instead of shift+click for multiple selection

Our viewer assumes shift+click to select multiple items in the scene.

PowerBI, on the other hand, expects that to be ctrl+shift. This makes our viewer not respond well when trying to select multiple items.

Currently, the visual must allow selection, and you must ensure the viewer is in focus by double clicking it at least twice. This is quite hacky though, so it would be nice to either:

  • Figure out a way to make shift+click work better or,
  • Have an option for the viewer to allow this combo to be changed so that instead of shift we use ctrl.

This may have to be brought up with Alex, but I'll first have to have a good picture of the options and problems that could cause here.

Add customisable tooltips

The current tooltip implementation displays all the data available for that object in the viewer, this has a couple of limitations:

  • It will only properly display the first level of properties.
  • Cannot be customised to show other data that is not contained in the object. i.e. mapping data from non-speckle sources to existing speckle objects.

Ideally, the tooltip should show only the fields that have been added to Object Data, which would fix both issues mentioned above

This requires compiling a map of TooltipData objects when new data is loaded, in a similar way we're currently keeping track of selectionIds.

Elements not displaying in big models

Prerequisites

What package are you referring to?

3D Viewer Visual for Power BI 2.0.0 Alpha.2

Describe the bug

Not all elements of the model are displayed in PowerBI Visual

To Reproduce

Import my model to power bi with this stream: https://speckle.xyz/streams/62e91d9637

Expected behavior

Not all wall wil display, some of them are missing.

Screenshots

image

System Info

If applicable, please fill in the below details - they help a lot!

Desktop (please complete the following information):

  • OS: Windows 11
  • Browser: Chrome Version 106.0.5249.103 (Official Build) (64-bit)

Failure Logs

Additional context

Proposed Solution (if any)

Optional: Affected Projects

Improved selection and drilldown/up support

Current selection logic of the visual is "Per Object", but this could be modified to be "per category" or "per grouping".

This would align with how other visuals do selections (which by default will select the entire grouping).

Furthermore, we could add drilldown support, which in essence means you can:

  • Select a single object and "drill up" to select it's parent category
  • Select a category and "drill down" to select individual children

My understanding of this may be flawed and should require prior scoping.

Switch to Vue3 + Webpack

Our current frontend is made with vanilla JS, but it's a PITA to work with.

Given that we now have ui-components available as nuget packages, we should switch to using this instead.

This would also speed up development of some features (such as login for the visual), error reporting, view loading... etc....

feat: New Viewer Integration

Description

There is a new viewer made by Alex The Wizard🧙‍♂️. This new viewer should replace the old viewer in the PowerBI Visual. Hopefully, with this new viewer, it will be easier to add features like bi-directional selection.

Input name cleanup does not work when language is not English

From the forum: https://speckle.community/t/new-powerbi-visual-2-0-0-alpha5/4769/7?u=alanrynne

Our CleanupName function is in charge of removing the prefixes added by PowerBI so that the color filters can use the raw '.' separated path to the original object.

This, sadly, is only prepared to work in English, and any other languages are forced to remove their prefixes manually to get it to work.

Possible solutions

Look into the PowerBI viewer API to figure out if:

  • We have access to these possible prefixes so we can be ready.
  • Directly access the query's column name, which should be unaltered by PowerBI.

Add bi-directional selection logic

Most of the boilerplate things are already working.

It basically boils down to 2 different steps:

Update from PowerBI to our visual:

This is done via the Update function, which takes care of multiple things (changes in styles, data, properties of the visual, filters, etc...)

Update from our visual to PowerBI

This is done via the "SelectionManager", one has already been initialised in our Visual class, but it only works by filtering, not highlighting.

This is a problem really in both directions, the Highlight functinality doesn't seem to work as expected, leading us to only be able to hard filter on selection.

I asked @Reynold-Chan to setup PowerBI on his side and check if it is some sort of setup problem local to my computer.

Visual fails to load DataView: Repeated Indices found in `GroupBy` or `Projections`

Reported in the forum https://speckle.community/t/3d-viewer-visual-doesnt-color-by-parameter/3773/35

Seems like there are potential combinations of inputs that will trigger an error while parsing the DataView.

Surely this is based on the new matrix view we've implemented, as it will now try to group things together using PowerBI's logic, there may be some extra setup needed in capabilities.json to allow for this combinations to happen without fail.

feat: Speckle Branding in the 3D Visual

Description

Adding Speckle brading to the 3D viewer Visual, similar to embedding.

We just need to come up with the design that uses the new logo.

Screenshot

image

Recommend Projects

  • React photo React

    A declarative, efficient, and flexible JavaScript library for building user interfaces.

  • Vue.js photo Vue.js

    🖖 Vue.js is a progressive, incrementally-adoptable JavaScript framework for building UI on the web.

  • Typescript photo Typescript

    TypeScript is a superset of JavaScript that compiles to clean JavaScript output.

  • TensorFlow photo TensorFlow

    An Open Source Machine Learning Framework for Everyone

  • Django photo Django

    The Web framework for perfectionists with deadlines.

  • D3 photo D3

    Bring data to life with SVG, Canvas and HTML. 📊📈🎉

Recommend Topics

  • javascript

    JavaScript (JS) is a lightweight interpreted programming language with first-class functions.

  • web

    Some thing interesting about web. New door for the world.

  • server

    A server is a program made to process requests and deliver data to clients.

  • Machine learning

    Machine learning is a way of modeling and interpreting data that allows a piece of software to respond intelligently.

  • Game

    Some thing interesting about game, make everyone happy.

Recommend Org

  • Facebook photo Facebook

    We are working to build community through open source technology. NB: members must have two-factor auth.

  • Microsoft photo Microsoft

    Open source projects and samples from Microsoft.

  • Google photo Google

    Google ❤️ Open Source for everyone.

  • D3 photo D3

    Data-Driven Documents codes.