Code Monkey home page Code Monkey logo

pidusage's Introduction

pidusage

Lint MacOS Ubuntu Windows Alpine Code coverage npm version license

Cross-platform process cpu % and memory usage of a PID.

Synopsis

Ideas from https://github.com/arunoda/node-usage but with no C-bindings.

Please note that if you need to check a Node.JS script process cpu and memory usage, you can use process.cpuUsage and process.memoryUsage since node v6.1.0. This script remain useful when you have no control over the remote script, or if the process is not a Node.JS process.

Usage

var pidusage = require('pidusage')

pidusage(process.pid, function (err, stats) {
  console.log(stats)
  // => {
  //   cpu: 10.0,            // percentage (from 0 to 100*vcore)
  //   memory: 357306368,    // bytes
  //   ppid: 312,            // PPID
  //   pid: 727,             // PID
  //   ctime: 867000,        // ms user + system time
  //   elapsed: 6650000,     // ms since the start of the process
  //   timestamp: 864000000  // ms since epoch
  // }
  cb()
})

// It supports also multiple pids
pidusage([727, 1234], function (err, stats) {
  console.log(stats)
  // => {
  //   727: {
  //     cpu: 10.0,            // percentage (from 0 to 100*vcore)
  //     memory: 357306368,    // bytes
  //     ppid: 312,            // PPID
  //     pid: 727,             // PID
  //     ctime: 867000,        // ms user + system time
  //     elapsed: 6650000,     // ms since the start of the process
  //     timestamp: 864000000  // ms since epoch
  //   },
  //   1234: {
  //     cpu: 0.1,             // percentage (from 0 to 100*vcore)
  //     memory: 3846144,      // bytes
  //     ppid: 727,            // PPID
  //     pid: 1234,            // PID
  //     ctime: 0,             // ms user + system time
  //     elapsed: 20000,       // ms since the start of the process
  //     timestamp: 864000000  // ms since epoch
  //   }
  // }
})

// If no callback is given it returns a promise instead
const stats = await pidusage(process.pid)
console.log(stats)
// => {
//   cpu: 10.0,            // percentage (from 0 to 100*vcore)
//   memory: 357306368,    // bytes
//   ppid: 312,            // PPID
//   pid: 727,             // PID
//   ctime: 867000,        // ms user + system time
//   elapsed: 6650000,     // ms since the start of the process
//   timestamp: 864000000  // ms since epoch
// }

// Avoid using setInterval as they could overlap with asynchronous processing
function compute(cb) {
  pidusage(process.pid, function (err, stats) {
    console.log(stats)
    // => {
    //   cpu: 10.0,            // percentage (from 0 to 100*vcore)
    //   memory: 357306368,    // bytes
    //   ppid: 312,            // PPID
    //   pid: 727,             // PID
    //   ctime: 867000,        // ms user + system time
    //   elapsed: 6650000,     // ms since the start of the process
    //   timestamp: 864000000  // ms since epoch
    // }
    cb()
  })
}

function interval(time) {
  setTimeout(function() {
    compute(function() {
      interval(time)
    })
  }, time)
}

// Compute statistics every second:
interval(1000)

// Above example using async/await
const compute = async () => {
  const stats = await pidusage(process.pid)
  // do something
}

// Compute statistics every second:
const interval = async (time) => {
  setTimeout(async () => {
    await compute()
    interval(time)
  }, time)
}

interval(1000)

Compatibility

Property Linux FreeBSD NetBSD SunOS macOS Win AIX Alpine
cpu ℹ️
memory
pid
ctime
elapsed
timestamp

✅ = Working ℹ️ = Not Accurate ❓ = Should Work ❌ = Not Working

Please if your platform is not supported or if you have reported wrong readings file an issue.

By default, pidusage will use procfile parsing on most unix systems. If you want to use ps instead use the usePs option:

pidusage(pid, {usePs: true})

API

pidusage(pids, [options = {}], [callback]) ⇒ [Promise.<Object>]

Get pid informations.

Kind: global function Returns: Promise.<Object> - Only when the callback is not provided. Access: public

Param Type Description
pids Number | Array.<Number> | String | Array.<String> A pid or a list of pids.
[options] object Options object. See the table below.
[callback] function Called when the statistics are ready. If not provided a promise is returned instead.

options

Setting the options programatically will override environment variables

Param Type Environment variable Default Description
[usePs] boolean PIDUSAGE_USE_PS false When true uses ps instead of proc files to fetch process information
[maxage] number PIDUSAGE_MAXAGE 60000 Max age of a process on history.

PIDUSAGE_SILENT=1 can be used to remove every console message triggered by pidusage.

pidusage.clear()

If needed this function can be used to delete all in-memory metrics and clear the event loop. This is not necessary before exiting as the interval we're registring does not hold up the event loop.

Related

Authors

See also the list of contributors who participated in this project.

License

This project is licensed under the MIT License - see the LICENSE file for details.

pidusage's People

Contributors

basiam avatar dependabot-preview[bot] avatar dependabot[bot] avatar echiu64 avatar essays-on-esotericism avatar filipesilva avatar hornwitser avatar igortodorovskiibm avatar johnnyasantoss avatar kadler avatar mjas1 avatar notfalsey avatar simonepri avatar soyuka avatar stonecypher avatar unitech avatar yazshel avatar zarda avatar

Stargazers

 avatar  avatar  avatar  avatar  avatar  avatar  avatar  avatar  avatar  avatar  avatar  avatar  avatar  avatar  avatar  avatar  avatar  avatar  avatar  avatar  avatar  avatar  avatar  avatar  avatar  avatar  avatar  avatar  avatar  avatar  avatar  avatar  avatar  avatar  avatar  avatar  avatar  avatar  avatar  avatar  avatar  avatar  avatar  avatar  avatar  avatar  avatar  avatar  avatar  avatar  avatar  avatar  avatar  avatar  avatar  avatar  avatar  avatar  avatar  avatar  avatar  avatar  avatar  avatar  avatar  avatar  avatar  avatar  avatar  avatar  avatar  avatar  avatar  avatar  avatar  avatar  avatar  avatar  avatar  avatar  avatar  avatar  avatar  avatar  avatar  avatar  avatar  avatar  avatar  avatar  avatar  avatar  avatar  avatar  avatar  avatar  avatar  avatar  avatar  avatar

Watchers

 avatar  avatar  avatar  avatar  avatar  avatar  avatar  avatar

pidusage's Issues

Useful to indicate when to scale?

Hi guys,

Someone using this in production?

For istance, how do you know based on the process usage when it's time to scale up an application?

Thanks.

Event error need to be "handled" on windows

Hello again,

Sorry for the error but this morning i was working on my laptop that has "wmic", getting back on my workstation, when i dont have it, its getting my process to crashed cause of the unhandled event, i dont find it usefull to make a PR to add this only line :

wmic.on('error', function (err) {})

Thanks again :)

Cannot read property 'memory' of null

I recently installed Express-status-monitor which seems to make use of pidusage and it is causing an error. The status page seems to function fine, but my nodejs app will randomly crash with the following error,

TypeError: Cannot read property 'memory' of null
at \node_modules\express-status-monitor\index.js line 43 col 25)
at ChildProcess. (\node_modules\pidusage\lib\stats.js line 151 col 16)
at emitTwo (events.js line 100 col 13)
at ChildProcess.emit (events.js line 185 col 7)
at maybeClose (internal/child_process.js line 827 col 16)
at Process.__dirname.ChildProcess._handle.onexit (internal/child_process.js line 211 col 5)

AIX is not supported

I was trying to run pm2 test on AIX platform but got the following message:

Error retrieving process list: Error: aix is not supported yet, please fire an isue (https://github.com/soyuka/pidusage).
Hopefully this will be supported soon on AIX.,
Thanks you

Its not telling accurate ram and CPU usage

I was trying out this on my ubuntu server, the
top command showed me cpu usage of 40%
while pidusage of same process showed 0% cpu usage, can you tell me where i am wrong, and is there a fix?
Also the RAM consumption was above 90MB and it showed 0.63MB

Code in repo is older than on npm?

FYI: The latest version in this repo is version 2.0.12, but according to https://www.npmjs.com/package/pidusage version 2.0.13 and 2.0.14 have also been released?

But at the same time new commits have been added to master after those two versions have been released, so I fear something is getting out of sync and just wanted you give you a heads up 😃

Latest npm version broken!

I can't make a PR here because of #72, but the latest release of pidusage on npm is broken because of the use of safe-buffer.

I think this should fix it:

-var Buffer = require('safe-buffer')
+var Buffer = require('safe-buffer').Buffer

Uncaught error

I get this exception sometimes:

/home/XXXXX2/node_modules/pidusage/lib/stats.js:27
                self.cpu.uptime = uptime.split(' ')[0]
                                         ^
TypeError: Cannot call method 'split' of undefined
    at /home/tknew/XXXXXXX2/node_modules/pidusage/lib/stats.js:27:30
    at fs.js:195:20
    at Object.oncomplete (fs.js:97:15)

Watch est good ;)

CPU usage sometimes is overstate

Sometimes the cpu usage is >100%*vCPU. E.g. a 12 core vCPU instance reports 3600% usage.

We use a 2 second poll interval to invoke pidusage (in part to avoid issues with small observation intervals). Every once in a while, repeatable across large number of instances, pidusage will report an CPU usage that is larger than possible given the number of vCPUs on the system.

OS: virtualized Debian
Platform: gcp

Command "wmic PROCESS 11756 get workingsetsize,usermodetime,kernelmodetime" failed with error Error: spawn wmic ENOENT

Got this error message when trying open python jupyter window from Vs Code python extension.
VS code 1.36.1, OS windows 10 1903

 console.ts:134 [Extension Host] [pidusage] Command "wmic PROCESS 11756 get workingsetsize,usermodetime,kernelmodetime" failed with error Error: spawn wmic ENOENT	at Process.ChildProcess._handle.onexit (internal/child_process.js:232:19)	at onErrorNT (internal/child_process.js:407:16)	at process._tickCallback (internal/process/next_tick.js:63:19)
t.log @ console.ts:134
console.ts:134 [Extension Host] Python Extension: (pidusage) Error: 
Wed Jul 17 2019 21:19:18 GMT-0400  Wmic errored, please open an issue on https://github.com/soyuka/pidusage with this message.
Command was "wmic PROCESS 11756 get workingsetsize,usermodetime,kernelmodetime" 
 System informations: 
 - release: 10.0.18362 
 - type Windows_NT 
Wmic reported no errors (stderr empty).
Wmic exited with code -4058.
Stdout was empty
	at ChildProcess.<anonymous> (c:\apps\VSCode\data\extensions\ms-python.python-2019.6.24221\out\client\extension.js:68:96853)
	at ChildProcess.emit (events.js:182:13)
	at maybeClose (internal/child_process.js:962:16)
	at Socket.ChildProcess.spawn.stream.socket.on (internal/child_process.js:381:11)
	at Socket.emit (events.js:182:13)
	at Pipe.Socket._destroy._handle.close (net.js:606:12)
t.log @ console.ts:134

Add support for Android

I currently have termux and pm2 installed on my Android.

Whenever I try to run an application using pm2, it returns the following:

$ pm2 logs
[TAILING] Tailing last 15 lines for [all] processes (change the value with --lines option)
/data/data/com.termux/files/home/.pm2/pm2.log last 15 lines:
PM2        | 2018-11-08T18:33:29: PM2 log: App [server:0] starting in -fork mode-
PM2        | 2018-11-08T18:33:29: PM2 log: App [server:0] online
PM2        | 2018-11-08T18:33:30: PM2 error: Error caught while calling pidusage
PM2        | 2018-11-08T18:33:30: PM2 error: Error: android is not supported yet, please open an issue (https://github.com/soyuka/pidusage)
PM2        | 2018-11-08T18:33:32: PM2 log: App [server:0] exited with code [1] via signal [SIGINT]
PM2        | 2018-11-08T18:33:33: PM2 log: App [server:0] starting in -fork mode-
PM2        | 2018-11-08T18:33:33: PM2 log: App [server:0] online
PM2        | 2018-11-08T18:33:33: PM2 error: Error caught while calling pidusage
PM2        | 2018-11-08T18:33:33: PM2 error: Error: android is not supported yet, please open an issue (https://github.com/soyuka/pidusage)
PM2        | 2018-11-08T18:33:35: PM2 log: App [server:0] exited with code [1] via signal [SIGINT]
PM2        | 2018-11-08T18:36:44: PM2 log: App [server:0] starting in -fork mode-
PM2        | 2018-11-08T18:36:44: PM2 log: App [server:0] online
PM2        | 2018-11-08T18:36:44: PM2 error: Error caught while calling pidusage
PM2        | 2018-11-08T18:36:44: PM2 error: Error: android is not supported yet, please open an issue (https://github.com/soyuka/pidusage)
PM2        | 2018-11-08T18:36:46: PM2 log: App [server:0] exited with code [1] via signal [SIGINT]

/data/data/com.termux/files/home/.pm2/logs/server-out-0.log last 15 lines:
/data/data/com.termux/files/home/.pm2/logs/server-error-0.log last 15 lines:
0|server| inspector.js:18
0|server|   throw new ERR_INSPECTOR_NOT_AVAILABLE();
0|server|   ^
0|server|
0|server| Error [ERR_INSPECTOR_NOT_AVAILABLE]: Inspector is not available
0|server|     at inspector.js:18:9
0|server|     at NativeModule.compile (internal/bootstrap/loaders.js:299:7)
0|server|     at Function.NativeModule.require (internal/bootstrap/loaders.js:168:18)
0|server|     at Function.Module._load (internal/modules/cjs/loader.js:523:25)
0|server|     at Module.require (internal/modules/cjs/loader.js:643:17)
0|server|     at require (internal/modules/cjs/helpers.js:22:18)
0|server|     at Object.<anonymous> (/data/data/com.termux/files/usr/lib/node_modules/pm2/node_modules/@pm2/io/build/main/src/services/inspector.js:3:19)
0|server|     at Module._compile (internal/modules/cjs/loader.js:707:30)
0|server|     at Object.Module._extensions..js (internal/modules/cjs/loader.js:718:10)
0|server|     at Module.load (internal/modules/cjs/loader.js:605:32)

wmic errored

This is the message I got in some module that I use. Thought I would bring it here so you may fix this.

Thanks,
Pari

Sun Jun 04 2017 19:46:00 GMT+0530 (India Standard Time) Wmic errored, please open an issue on https://github.com/soyuka/pidusage with this message.
Command was "wmic PROCESS 6080 get workingsetsize,usermodetime,kernelmodetime"
System informations:

  • release: 10.0.15063
  • type Windows_NT
    Wmic reported no errors (stderr empty).
    Wmic exited with code 0.
    Stdout was empty
    at ChildProcess. (D:\WebServer\job_Manager\jobManager\node_modules\pidusage\lib\stats.js:157:21)
    at emitTwo (events.js:125:13)
    at ChildProcess.emit (events.js:213:7)
    at maybeClose (internal/child_process.js:887:16)
    at Process.ChildProcess._handle.onexit (internal/child_process.js:208:5)

Failing in a docker container

Mar 07 22:19:11 coregrid2 sh[14604]: Error while getting CLK_TCK { Error: Command failed: getconf CLK_TCK
Mar 07 22:19:11 coregrid2 sh[14604]: /bin/sh: getconf: not found
Mar 07 22:19:11 coregrid2 sh[14604]:     at ChildProcess.exithandler (child_process.js:206:12)
Mar 07 22:19:11 coregrid2 sh[14604]:     at emitTwo (events.js:106:13)
Mar 07 22:19:11 coregrid2 sh[14604]:     at ChildProcess.emit (events.js:191:7)
Mar 07 22:19:11 coregrid2 sh[14604]:     at maybeClose (internal/child_process.js:877:16)
Mar 07 22:19:11 coregrid2 sh[14604]:     at Socket.<anonymous> (internal/child_process.js:334:11)
Mar 07 22:19:11 coregrid2 sh[14604]:     at emitOne (events.js:96:13)
Mar 07 22:19:11 coregrid2 sh[14604]:     at Socket.emit (events.js:188:7)
Mar 07 22:19:11 coregrid2 sh[14604]:     at Pipe._handle.close [as _onclose] (net.js:498:12) killed: false, code: 127, signal: null, cmd: 'getconf CLK_TCK' }
Mar 07 22:19:11 coregrid2 sh[14604]: Error while getting PAGESIZE { Error: Command failed: getconf PAGESIZE
Mar 07 22:19:11 coregrid2 sh[14604]: /bin/sh: getconf: not found
Mar 07 22:19:11 coregrid2 sh[14604]:     at ChildProcess.exithandler 

This is running in a docker container based on busybox. This just started happening today.

"pm2": "^2.3.0",

Incorrect elapsed time reported on Docker

Heya, I've noticed some odd elapsed time reported on Docker images. I'm not too sure if it's docker or linux or generally, but my machine is Windows and I see the issue when using Docker. I also see it happening on CircleCI, and they use docker images for their CI machines.

Here's repro: https://github.com/filipesilva/pidusage-docker. It's just a test script that print stats three times on npm test:

var pidusage = require('pidusage')

// Compute statistics every second:
const interval = setInterval(function () {
  pidusage(process.pid, { maxage: 1000 }, function (err, stats) {
    console.log(stats)
    // => {
    //   cpu: 10.0,            // percentage (from 0 to 100*vcore)
    //   memory: 357306368,    // bytes
    //   ppid: 312,            // PPID
    //   pid: 727,             // PID
    //   ctime: 867000,        // ms user + system time
    //   elapsed: 6650000,     // ms since the start of the process
    //   timestamp: 864000000  // ms since epoch
    // }
  })
}, 1000);

setTimeout(() => clearInterval(interval), 3500);

On my Windows machine I see something like this:

{ cpu: 0,
  memory: 23441408,
  ppid: 4512,
  pid: 14228,
  ctime: 265,
  elapsed: 1554,
  timestamp: 1535623344931 }
{ cpu: 3.2,
  memory: 23777280,
  ppid: 4512,
  pid: 14228,
  ctime: 297,
  elapsed: 2388,
  timestamp: 1535623345765 }
{ cpu: 0,
  memory: 23781376,
  ppid: 4512,
  pid: 14228,
  ctime: 297,
  elapsed: 3659,
  timestamp: 1535623347036 }

Using one of CircleCI's docker images, for instance circleci/node:8.11-browsers, I see the following

$ docker run -v d:/sandbox:/sandbox -it circleci/node:8.11-browsers
$ cd /sandbox/pidusage-docker
$ npm test

> [email protected] test /sandbox/pidusage-docker
> node test

{ cpu: 0,
  memory: 30306304,
  ctime: 0.08,
  elapsed: 1535540503719,
  timestamp: 83190970,
  pid: 24,
  ppid: 23 }
{ cpu: 0,
  memory: 30547968,
  ctime: 0.08,
  elapsed: 1535540504713,
  timestamp: 83190970,
  pid: 24,
  ppid: 23 }
{ cpu: 1,
  memory: 30547968,
  ctime: 0.09,
  elapsed: 1535540505714,
  timestamp: 83190970,
  pid: 24,
  ppid: 23 }

(NB: d:/sandbox:/sandbox is just mounting my local folder so I don't have to git clone the repro)

The difference between each elapsed seems correct, but they are reporting something like 48 years of elapsed time.

I guess it's related with the extremely low timestamp though, since elapsed is calculated from it:

https://github.com/soyuka/pidusage/blob/master/lib/procfile.js#L115-L116

I tried adding some logging to the relevant computations for the timestamp:

      console.log('parseFloat(infos[19])', parseFloat(infos[19]))
      console.log('cpuInfo.clockTick', cpuInfo.clockTick)
      console.log('stat.start', stat.start)
parseFloat(infos[19]) 8421548
cpuInfo.clockTick 100
stat.start 84215.48
{ cpu: 0,
  memory: 30195712,
  ctime: 0.07,
  elapsed: 1535540503698,
  timestamp: 84215480,
  pid: 52,
  ppid: 51 }

parseFloat(infos[19]) 8421548
cpuInfo.clockTick 100
stat.start 84215.48
{ cpu: 0,
  memory: 30461952,
  ctime: 0.07,
  elapsed: 1535540504692,
  timestamp: 84215480,
  pid: 52,
  ppid: 51 }

parseFloat(infos[19]) 8421548
cpuInfo.clockTick 100
stat.start 84215.48
{ cpu: 0,
  memory: 30461952,
  ctime: 0.07,
  elapsed: 1535540505694,
  timestamp: 84215480,
  pid: 52,
  ppid: 51 }

Looking at the calculated numbers it doesn't seem like anything is going wrong, just that starttime from the procfile looks really small.

Happy to try and fix this, do you have any ideas on how to proceed?

freebsd support

Error retrieving process list: Error: freebsd is not supported yet, please fire an issue.

WMIC.exe not cleaned up on Windows

When PM2 stopped working, I checked process explorer and see a long list of open WMIC.exe processes. PM2 can work with a few lingering WMIC.exe but as time goes it will stop responding altogether.

The OS I am using does not have the WMIC.exe so I copied from somewhere else and put the program in the working directory of the project. Before that PM2 is not working at all. I checked the error log and npm page of pidusage to find out that this module depends on WMIC.exe.

I wonder if the path has something do to with those lingering programs?

Many thanks in advance

why don't use 'top' in darwin os

darwin os
use command "ps -o pcup,rss -p [pid]"
result is different from use command "top -pid [pid]"

ps:
CPU usage is currently expressed as the percentage of time spent running during the entire lifetime of a process. This is not ideal, and it does not conform to the standards that ps otherwise conforms to. CPU usage is unlikely to add up to exactly 100%.

top:
The task's share of the elapsed CPU time since the last screen update, expressed as a percentage of total CPU
time. In a true SMP environment, if 'Irix mode' is Off, top will operate in number of CPUs. You toggle
'Irix/Solaris' modes with the 'I' interactive command.

so why don't use 'top'?

TypeError: Buffer.alloc is not a function

What's going wrong?

When starting my Docker container that is using pm2, I get this error:

pm2 launched in no-daemon mode (you can add DEBUG="*" env variable to get more messages)
[2018-07-24T20:34:53.113Z] PM2 log: Launching in no daemon mode
[2018-07-24T20:34:53.221Z] PM2 log: [PM2] Starting /src/server/server.js in cluster_mode (1 instance)
[2018-07-24T20:34:53.225Z] PM2 log: Starting execution sequence in -cluster mode- for app name:server id:0
[2018-07-24T20:34:53.286Z] PM2 log: App name:server id:0 online
[2018-07-24T20:34:53.289Z] PM2 log: [PM2] Done.
/usr/lib/node_modules/pm2/node_modules/pidusage/lib/procfile.js:27
    buf = Buffer.alloc(SIZE)
                 ^

TypeError: Buffer.alloc is not a function
    at readUntilEnd (/usr/lib/node_modules/pm2/node_modules/pidusage/lib/procfile.js:27:18)
    at /usr/lib/node_modules/pm2/node_modules/pidusage/lib/procfile.js:68:5
    at FSReqWrap.oncomplete (fs.js:145:20)
pm2 launched in no-daemon mode (you can add DEBUG="*" env variable to get more messages)
[2018-07-24T20:35:01.420Z] PM2 log: Launching in no daemon mode
[2018-07-24T20:35:01.476Z] PM2 log: [PM2] Starting /src/server/server.js in cluster_mode (1 instance)
[2018-07-24T20:35:01.479Z] PM2 log: Starting execution sequence in -cluster mode- for app name:server id:0
[2018-07-24T20:35:01.539Z] PM2 log: App name:server id:0 online
[2018-07-24T20:35:01.541Z] PM2 log: [PM2] Done.
/usr/lib/node_modules/pm2/node_modules/pidusage/lib/procfile.js:27
    buf = Buffer.alloc(SIZE)
                 ^

TypeError: Buffer.alloc is not a function
    at readUntilEnd (/usr/lib/node_modules/pm2/node_modules/pidusage/lib/procfile.js:27:18)
    at /usr/lib/node_modules/pm2/node_modules/pidusage/lib/procfile.js:68:5
    at FSReqWrap.oncomplete (fs.js:145:20)

How could we reproduce this issue?

Start a Docker container that uses pm2

Supporting information

I'm using the latest node version to date (10.7.0), same for pm2 (3.0.1)

Critical - PM2 warn: [pidusage] We couldn't find uptime from /proc/uptime, using os.uptime() value

Latest PM2 version (3.0) published today has the new pidusage that seems crashing some application start.

Unitech/pm2#3763

User report this system:

--- System info --------------------------------------------
arch : x64
platform : freebsd
type : FreeBSD
cpus : Intel(R) Xeon(R) CPU E3-1225 v3 @ 3.20GHz
cpus nb : 4
freemem : 306044928
totalmem : 16921944064
home : /root

PM2 logs:

[2018-07-04T11:31:11.747Z] PM2 log: BUS socket file : /root/.pm2/pub.sock
[2018-07-04T11:31:11.747Z] PM2 log: Application log path : /root/.pm2/logs
[2018-07-04T11:31:11.747Z] PM2 log: Process dump file : /root/.pm2/dump.pm2
[2018-07-04T11:31:11.747Z] PM2 log: Concurrent actions : 2
[2018-07-04T11:31:11.748Z] PM2 log: SIGTERM timeout : 1600
[2018-07-04T11:31:11.748Z] PM2 log: ===============================================================================
[2018-07-04T11:31:12.608Z] PM2 log: Starting execution sequence in -fork mode- for app name:node-red id:0
[2018-07-04T11:31:12.614Z] PM2 log: App name:node-red id:0 online
[2018-07-04T11:31:12.649Z] PM2 warn: [pidusage] We couldn't find uptime from /proc/uptime, using os.uptime() value
[2018-07-04T11:31:12.652Z] PM2 error: Error caught while calling pidusage
[2018-07-04T11:31:12.653Z] PM2 error: Error: No maching pid found
[2018-07-04T11:31:12.654Z] PM2 log: ===============================================================================
[2018-07-04T11:31:12.654Z] PM2 log: --- PM2 global error caught ---------------------------------------------------
[2018-07-04T11:31:12.654Z] PM2 log: Time : Wed Jul 04 2018 11:31:12 GMT-0900 (Pacific Standard Time)
[2018-07-04T11:31:12.659Z] PM2 error: Cannot read property '16804' of undefined
[2018-07-04T11:31:12.659Z] PM2 error: TypeError: Cannot read property '16804' of undefined
at /usr/local/lib/node_modules/pm2/lib/God/ActionMethods.js:79:30
at Array.map ()

What happened between version 2.0.15 and 2.0.16?

I was very surprised to figure out that between 2.0.15 and 2.0.16 the CPU computation had drastically changed:

With test-pidusage.js
// test-pidusage.js
var WHATEVER_PID = 45966;
var pidusage = require('pidusage')
setInterval(function () {
  pidusage(WHATEVER_PID, function (err, stats) {
    console.log(stats.cpu)
  })
}, 1000)
$ npm install [email protected]
$ node test-pidusage.js
8
3
7.000000000000001
33
44
19
2
12
18
10
11
4
11
36
25
15
9
2
8
28.999999999999996
27
6
22
11


$ npm install [email protected]
$ node test-pidusage.js
480
240
60
120
120
120
240
1440
1320
1019.9999999999999
-3200
1860.0000000000002
-3320.0000000000005
1019.9999999999999
420

There is no clue in your repository about what could have happened: no code, no changelog..

Can you please clarify?

Buffer incorrect usage

Your lib used in PM2.

buf = Buffer.alloc(SIZE)

[2018-07-25T15:26:37.579Z] PM2 log: ===============================================================================
[2018-07-25T15:26:37.581Z] PM2 log: --- New PM2 Daemon started ----------------------------------------------------
[2018-07-25T15:26:37.581Z] PM2 log: Time                 : Wed Jul 25 2018 15:26:37 GMT+0300 (EEST)
[2018-07-25T15:26:37.581Z] PM2 log: PM2 version          : 3.0.1
[2018-07-25T15:26:37.581Z] PM2 log: Node.js version      : 8.11.3
[2018-07-25T15:26:37.581Z] PM2 log: Current arch         : x64
[2018-07-25T15:26:37.582Z] PM2 log: PM2 home             : /home/encobrain/.pm2
[2018-07-25T15:26:37.582Z] PM2 log: PM2 PID file         : /home/encobrain/.pm2/pm2.pid
[2018-07-25T15:26:37.582Z] PM2 log: RPC socket file      : /home/encobrain/.pm2/rpc.sock
[2018-07-25T15:26:37.582Z] PM2 log: BUS socket file      : /home/encobrain/.pm2/pub.sock
[2018-07-25T15:26:37.582Z] PM2 log: Application log path : /home/encobrain/.pm2/logs
[2018-07-25T15:26:37.582Z] PM2 log: Process dump file    : /home/encobrain/.pm2/dump.pm2
[2018-07-25T15:26:37.582Z] PM2 log: Concurrent actions   : 2
[2018-07-25T15:26:37.582Z] PM2 log: SIGTERM timeout      : 1600
[2018-07-25T15:26:37.582Z] PM2 log: ===============================================================================
[2018-07-25T15:26:37.618Z] PM2 log: Starting execution sequence in -fork mode- for app name:test id:0
[2018-07-25T15:26:37.625Z] PM2 log: App name:test id:0 online
[2018-07-25T15:26:37.648Z] PM2 log: { Buffer: 
   { [Function: Buffer]
     poolSize: 8192,
     from: [Function],
     alloc: [Function],
     allocUnsafe: [Function],
     allocUnsafeSlow: [Function],
     isBuffer: [Function: isBuffer],
     compare: [Function: compare],
     isEncoding: [Function],
     concat: [Function],
     byteLength: [Function: byteLength],
     [Symbol(node.isEncoding)]: [Function] },
  SlowBuffer: [Function: SlowBuffer],
  INSPECT_MAX_BYTES: 50,
  kMaxLength: 2147483647,
  constants: { MAX_LENGTH: 2147483647, MAX_STRING_LENGTH: 1073741799 },
  kStringMaxLength: 1073741799,
  transcode: [Function: transcode] }
[2018-07-25T15:26:37.648Z] PM2 log: ===============================================================================
[2018-07-25T15:26:37.648Z] PM2 log: --- PM2 global error caught ---------------------------------------------------
[2018-07-25T15:26:37.649Z] PM2 log: Time                 : Wed Jul 25 2018 15:26:37 GMT+0300 (EEST)
[2018-07-25T15:26:37.649Z] PM2 error: Buffer.alloc is not a function
[2018-07-25T15:26:37.649Z] PM2 error: TypeError: Buffer.alloc is not a function
    at readUntilEnd (/home/encobrain/.nvm/versions/node/v8.11.3/lib/node_modules/pm2/node_modules/pidusage/lib/procfile.js:32:18)
    at /home/encobrain/.nvm/versions/node/v8.11.3/lib/node_modules/pm2/node_modules/pidusage/lib/procfile.js:73:5
    at FSReqWrap.oncomplete (fs.js:135:15)
[2018-07-25T15:26:37.649Z] PM2 log: ===============================================================================
[2018-07-25T15:26:37.650Z] PM2 error: [PM2] Resurrecting PM2
Be sure to have the latest version by doing `npm install pm2@latest -g` before doing this procedure.
[PM2] Saving current process list...
[2018-07-25T15:26:37.819Z] PM2 log: { Buffer: 
   { [Function: Buffer]
     poolSize: 8192,
     from: [Function],
     alloc: [Function],
     allocUnsafe: [Function],
     allocUnsafeSlow: [Function],
     isBuffer: [Function: isBuffer],
     compare: [Function: compare],
     isEncoding: [Function],
     concat: [Function],
     byteLength: [Function: byteLength],
     [Symbol(node.isEncoding)]: [Function] },
  SlowBuffer: [Function: SlowBuffer],
  INSPECT_MAX_BYTES: 50,
  kMaxLength: 2147483647,
  constants: { MAX_LENGTH: 2147483647, MAX_STRING_LENGTH: 1073741799 },
  kStringMaxLength: 1073741799,
  transcode: [Function: transcode] }
/home/encobrain/.nvm/versions/node/v8.11.3/lib/node_modules/pm2/node_modules/pidusage/lib/procfile.js:32
    buf = Buffer.alloc(SIZE)
                 ^

TypeError: Buffer.alloc is not a function
    at readUntilEnd (/home/encobrain/.nvm/versions/node/v8.11.3/lib/node_modules/pm2/node_modules/pidusage/lib/procfile.js:32:18)
    at /home/encobrain/.nvm/versions/node/v8.11.3/lib/node_modules/pm2/node_modules/pidusage/lib/procfile.js:73:5
    at FSReqWrap.oncomplete (fs.js:135:15)

error here:

Hint about memory usage in README

It would be great if there was a hint that constantly calling pusage.stat (or fs.readFile/createReadStream in general) is filling up memory pretty fast if you don't call gc manually every few seconds. This might save a lot of people a lot of time.

Buffer.alloc issue

nodejs version: 4.2.6
pm2 3.0.0
npm 6.1.0
/usr/local/lib/node_modules/pm2/node_modules/pidusage/lib/procfile.js:26
buf = Buffer.alloc(SIZE)
^
TypeError: Buffer.alloc is not a function
at readUntilEnd (/usr/local/lib/node_modules/pm2/node_modules/pidusage/lib/procfile.js:26:18)
at /usr/local/lib/node_modules/pm2/node_modules/pidusage/lib/procfile.js:67:5
at FSReqWrap.oncomplete (fs.js:82:15)

Unitech/pm2#3816

Cpu usage is sometimes negative

Hi, I'm using pidusage to measure the CPU usage of a non-node process. But I find the usage sometimes returns negative value. How is this possible?

Thank you

node version: 8.8.1
platform: macOS 10.12.6
library version: 2.0.11

Missing Util declaration in lib/stats.js

Missing "var util = require("util")" with the other declarations causes an exception.

var error = util.format('%s Wmic errored, please open an issue on https://github.com/soyuka/pidusage with this message.%s', new Date().toString(), os.EOL)

Add support for threads count

Example:

❯ ps M -p 2100        
USER        PID   TT   %CPU STAT PRI     STIME     UTIME COMMAND
simonepri  2100   ??    1.9 R    47T   0:01.72   0:18.31 /Applications/Utilities/Terminal.app/Contents/MacOS/Terminal
           2100         0.0 S    20T   0:00.00   0:00.00 
           2100         0.0 S    31T   0:00.00   0:00.00 
           2100         0.0 S    31T   0:00.54   0:00.33 
           2100         0.0 S    47T   0:00.92   0:00.56 
           2100         0.1 S    61T   0:00.00   0:00.03 
           2100         0.1 S    47T   0:00.00   0:00.02 
           2100         0.0 S    61T   0:00.00   0:00.01 
           2100         0.1 S    47T   0:00.00   0:00.01 

To count them:

❯ ps M -p 2100 | wc -l
      10

@soyuka any idea on how can we support this?

Feature Request - Support list of pids

Proposal

With the current implementation it's not possible to retrieve info for more than one pid at once.
I've looked the code and it does not seems to complicate to support a list of pids.
Would you consider a PR to add this?

Use Case

I need to monitor the whole tree and the readings would be a lot faster if I can retrieve info for a list of pids with a single ps command.

Currently my solution is to do multiple calls to pidusage:

const pify = require('pify');
const pidusage = require('pidusage').stat;
const pstree = require('ps-tree');

async function descendant(ppid) {
  const procl = (await pify(pstree)(ppid)).map(pst => ({
    ppid: pst.PPID,
    pid: pst.PID,
  }));
  return procl;
}
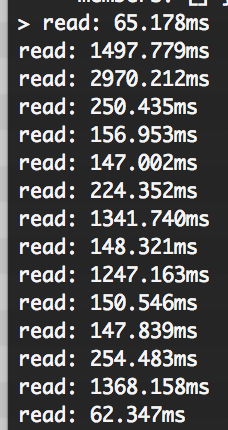
async function read() {
  let procl = [{ppid: 'somepid', pid: 'somepid'}];
  try {
    procl = procl.concat(await descendant('somepid'));
  } catch (err) {}

  // console.time('read');
  const promises = procl.map(proc => {
    return pify(pidusage)(proc.pid)
      .then(stat => {
        const snap = Object.assign(proc, stat));
        // => {"ppid": "XXXX", "pid": "YYYY", "cpu": Z, "memory": M}
      })
      .catch(() => {});
  });
  await Promise.all(promises);
  // console.timeEnd('read');
}

But with a lot of heavy loaded processes it can be really slow due to context switching.
image

Getting more done in GitHub with ZenHub

Hola! @Syfhehe has created a ZenHub account for the soyuka organization. ZenHub is the only project management tool integrated natively in GitHub – created specifically for fast-moving, software-driven teams.


How do I use ZenHub?

To get set up with ZenHub, all you have to do is download the browser extension and log in with your GitHub account. Once you do, you’ll get access to ZenHub’s complete feature-set immediately.

What can ZenHub do?

ZenHub adds a series of enhancements directly inside the GitHub UI:

  • Real-time, customizable task boards for GitHub issues;
  • Multi-Repository burndown charts, estimates, and velocity tracking based on GitHub Milestones;
  • Personal to-do lists and task prioritization;
  • Time-saving shortcuts – like a quick repo switcher, a “Move issue” button, and much more.

Add ZenHub to GitHub

Still curious? See more ZenHub features or read user reviews. This issue was written by your friendly ZenHub bot, posted by request from @Syfhehe.

ZenHub Board

Calculated CPU usage wrong

See here: Unitech/pm2#3299

If you need os dependent details, please let me know - at east I know we're using Debian on that server.
Any questions concerning the technical implementation -> please address them to Unitech.
They just asked me to open an issue here.

Wrong CPU usage

Hi Devs, I've guess the CPU usage shown in the bottom of the IOTA Windows Wallet is not correct.

It use this module to get data to display.

It is almost the double of the value reported by the System monitor. Memory usage will also display the RSS only.

As you can see in this screenshot the wallet says 70% and the real value is 37%

image

Even momory seems not correct

Recommend Projects

  • React photo React

    A declarative, efficient, and flexible JavaScript library for building user interfaces.

  • Vue.js photo Vue.js

    🖖 Vue.js is a progressive, incrementally-adoptable JavaScript framework for building UI on the web.

  • Typescript photo Typescript

    TypeScript is a superset of JavaScript that compiles to clean JavaScript output.

  • TensorFlow photo TensorFlow

    An Open Source Machine Learning Framework for Everyone

  • Django photo Django

    The Web framework for perfectionists with deadlines.

  • D3 photo D3

    Bring data to life with SVG, Canvas and HTML. 📊📈🎉

Recommend Topics

  • javascript

    JavaScript (JS) is a lightweight interpreted programming language with first-class functions.

  • web

    Some thing interesting about web. New door for the world.

  • server

    A server is a program made to process requests and deliver data to clients.

  • Machine learning

    Machine learning is a way of modeling and interpreting data that allows a piece of software to respond intelligently.

  • Game

    Some thing interesting about game, make everyone happy.

Recommend Org

  • Facebook photo Facebook

    We are working to build community through open source technology. NB: members must have two-factor auth.

  • Microsoft photo Microsoft

    Open source projects and samples from Microsoft.

  • Google photo Google

    Google ❤️ Open Source for everyone.

  • D3 photo D3

    Data-Driven Documents codes.