Gregory Way, Shantanu Singh, Anne Carpenter 2019
The following repository stores a complete analysis pipeline of using Cell Painting data to predict the results of several cell health assays.
Our collaborators previously collected a series of assays measuring different aspects of cell health. The assays include staining with specific dyes to measure specific phenotypes.
| Assay/Dye | Phenotype |
|---|---|
| Caspase 3/7 | Apoptosis |
| DRAQ7 | Cell Death |
| EdU | Cellular Profileration |
| Hoechst | DNA Content |
| Ph3 | Cell Division |
| gH2Ax | DNA Damage |
We hypothesized that we can use unbiased and high dimensional Cell Painting profiles to predict the readouts of each individual assay.
We collected Cell Painting measurements on a CRISPR experiment. The experiment targeted 59 genes, which included 119 unique guides (~2 per gene), across 3 cell lines. The cell lines included A549, ES2, and HCC44.
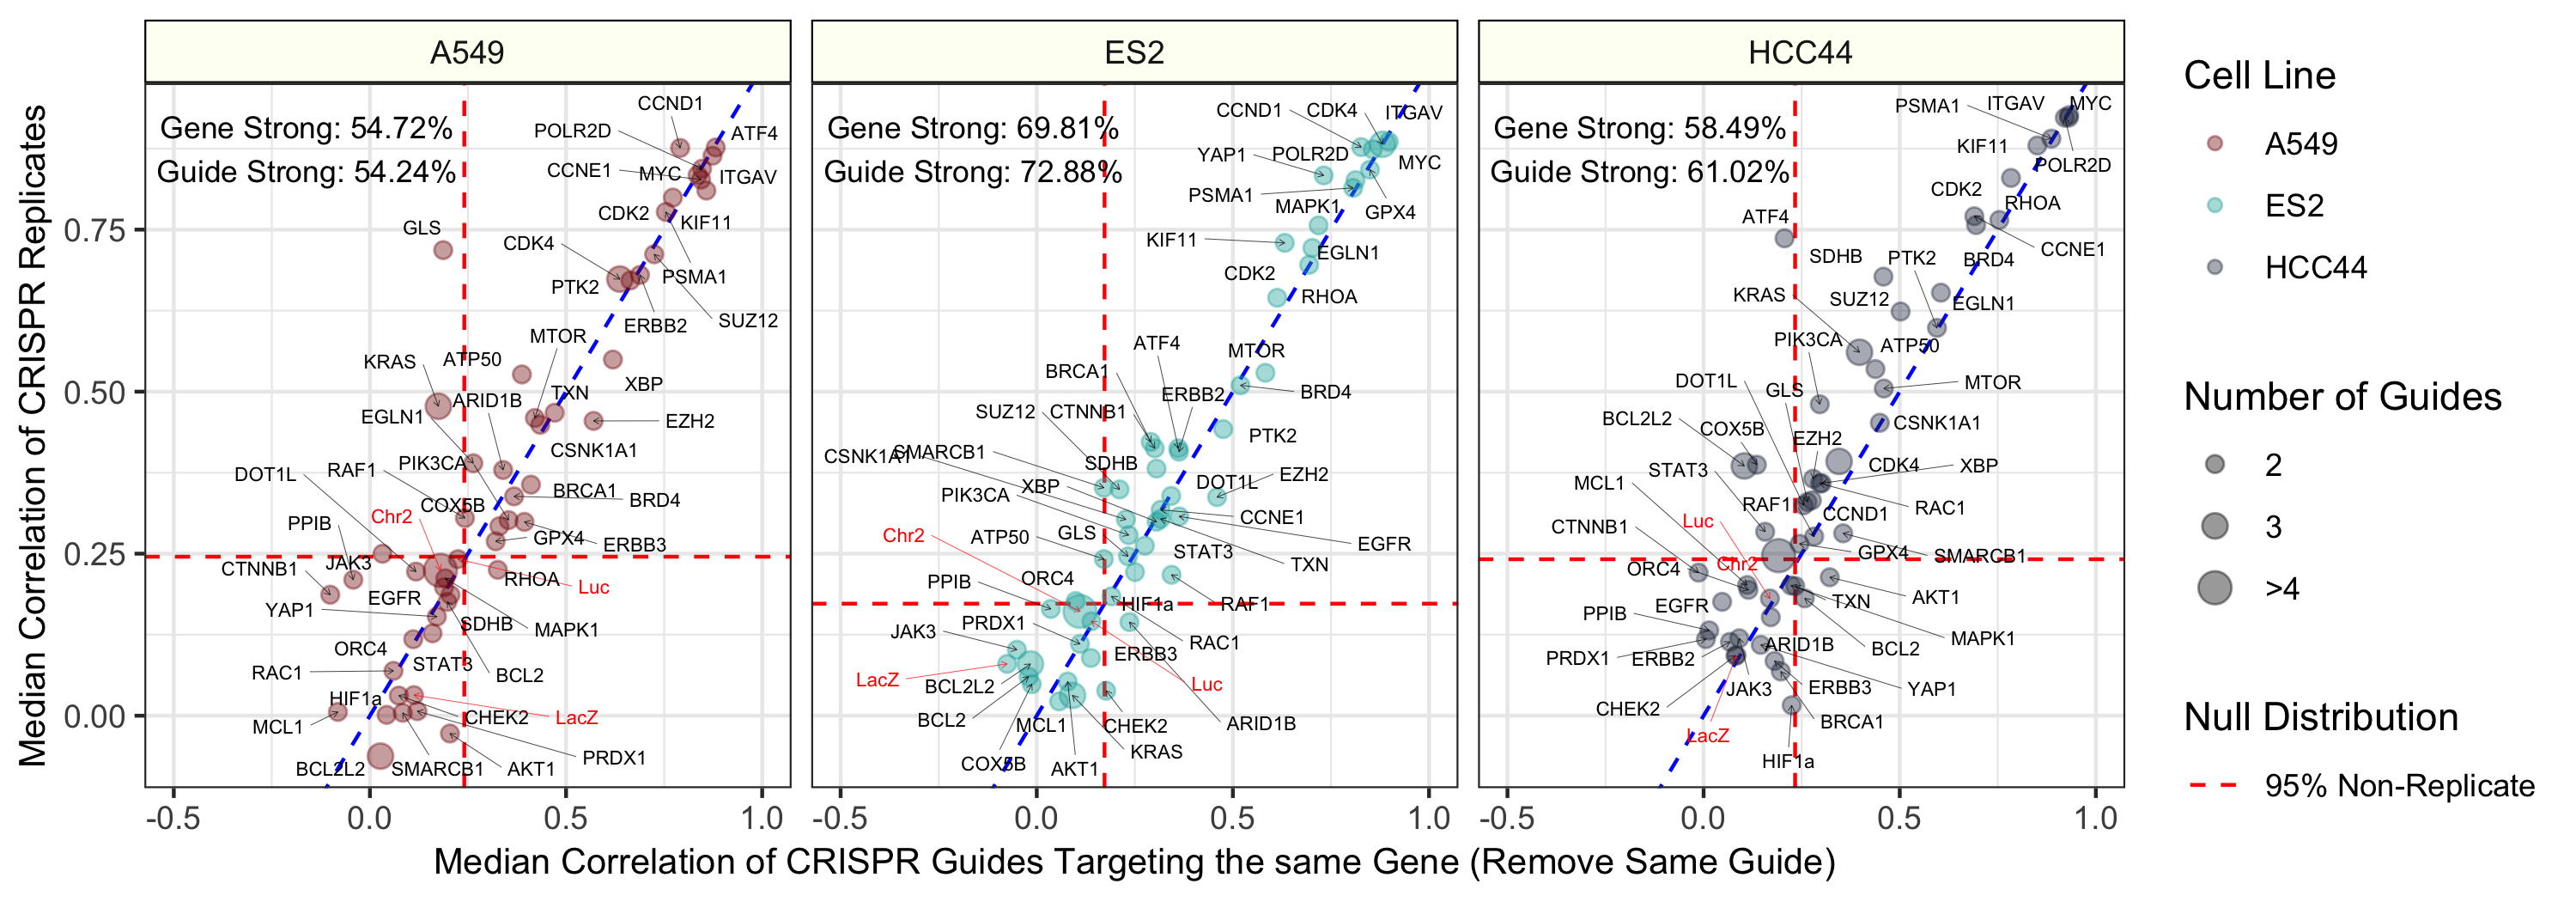
About 40% of all CRISPR guides were reproducible. This is ok since we are not actually interested in the CRISPR treatment specifically, but instead, just its corresponding readout in each cell health assay.
The full analysis pipeline consists of the following steps:
| Order | Module | Description |
|---|---|---|
| 0 | Download cell painting data | Retrieve single cell profiles archived on Figshare |
| 1 | Generate profiles | Generate and process cell painting and cell health assay readouts |
| 2 | Determine replicate reproducibility | Determine the extent to which the CRISPR perturbations result in reproducible signatures |
| 3 | Train machine learning models to predict cell health assays | Train regression and classification models using cell painting data to predict cell health assay readouts |
| 4 | Apply the models | Apply the trained models to the Drug Repurposing Hub data to predict drug perturbation effect |
Each analysis module should be run in order. View each module for specific instructions on how to reproduce results.
analysis-pipeline.sh stores information on how to reproduce all analysis modules.
We performed the following approach:
- Split data into 85% training and 15% test sets.
- Normalized data by plate (z-score).
- Selected optimal hyperparamters using 5-fold cross-validation
- Trained elastic net regression models to predict each of the 70 cell health assay readouts, independently.
- Trained using shuffled data as well.
- Report performance on training and test sets.
We also trained logistic regression classifiers using the same approach above.
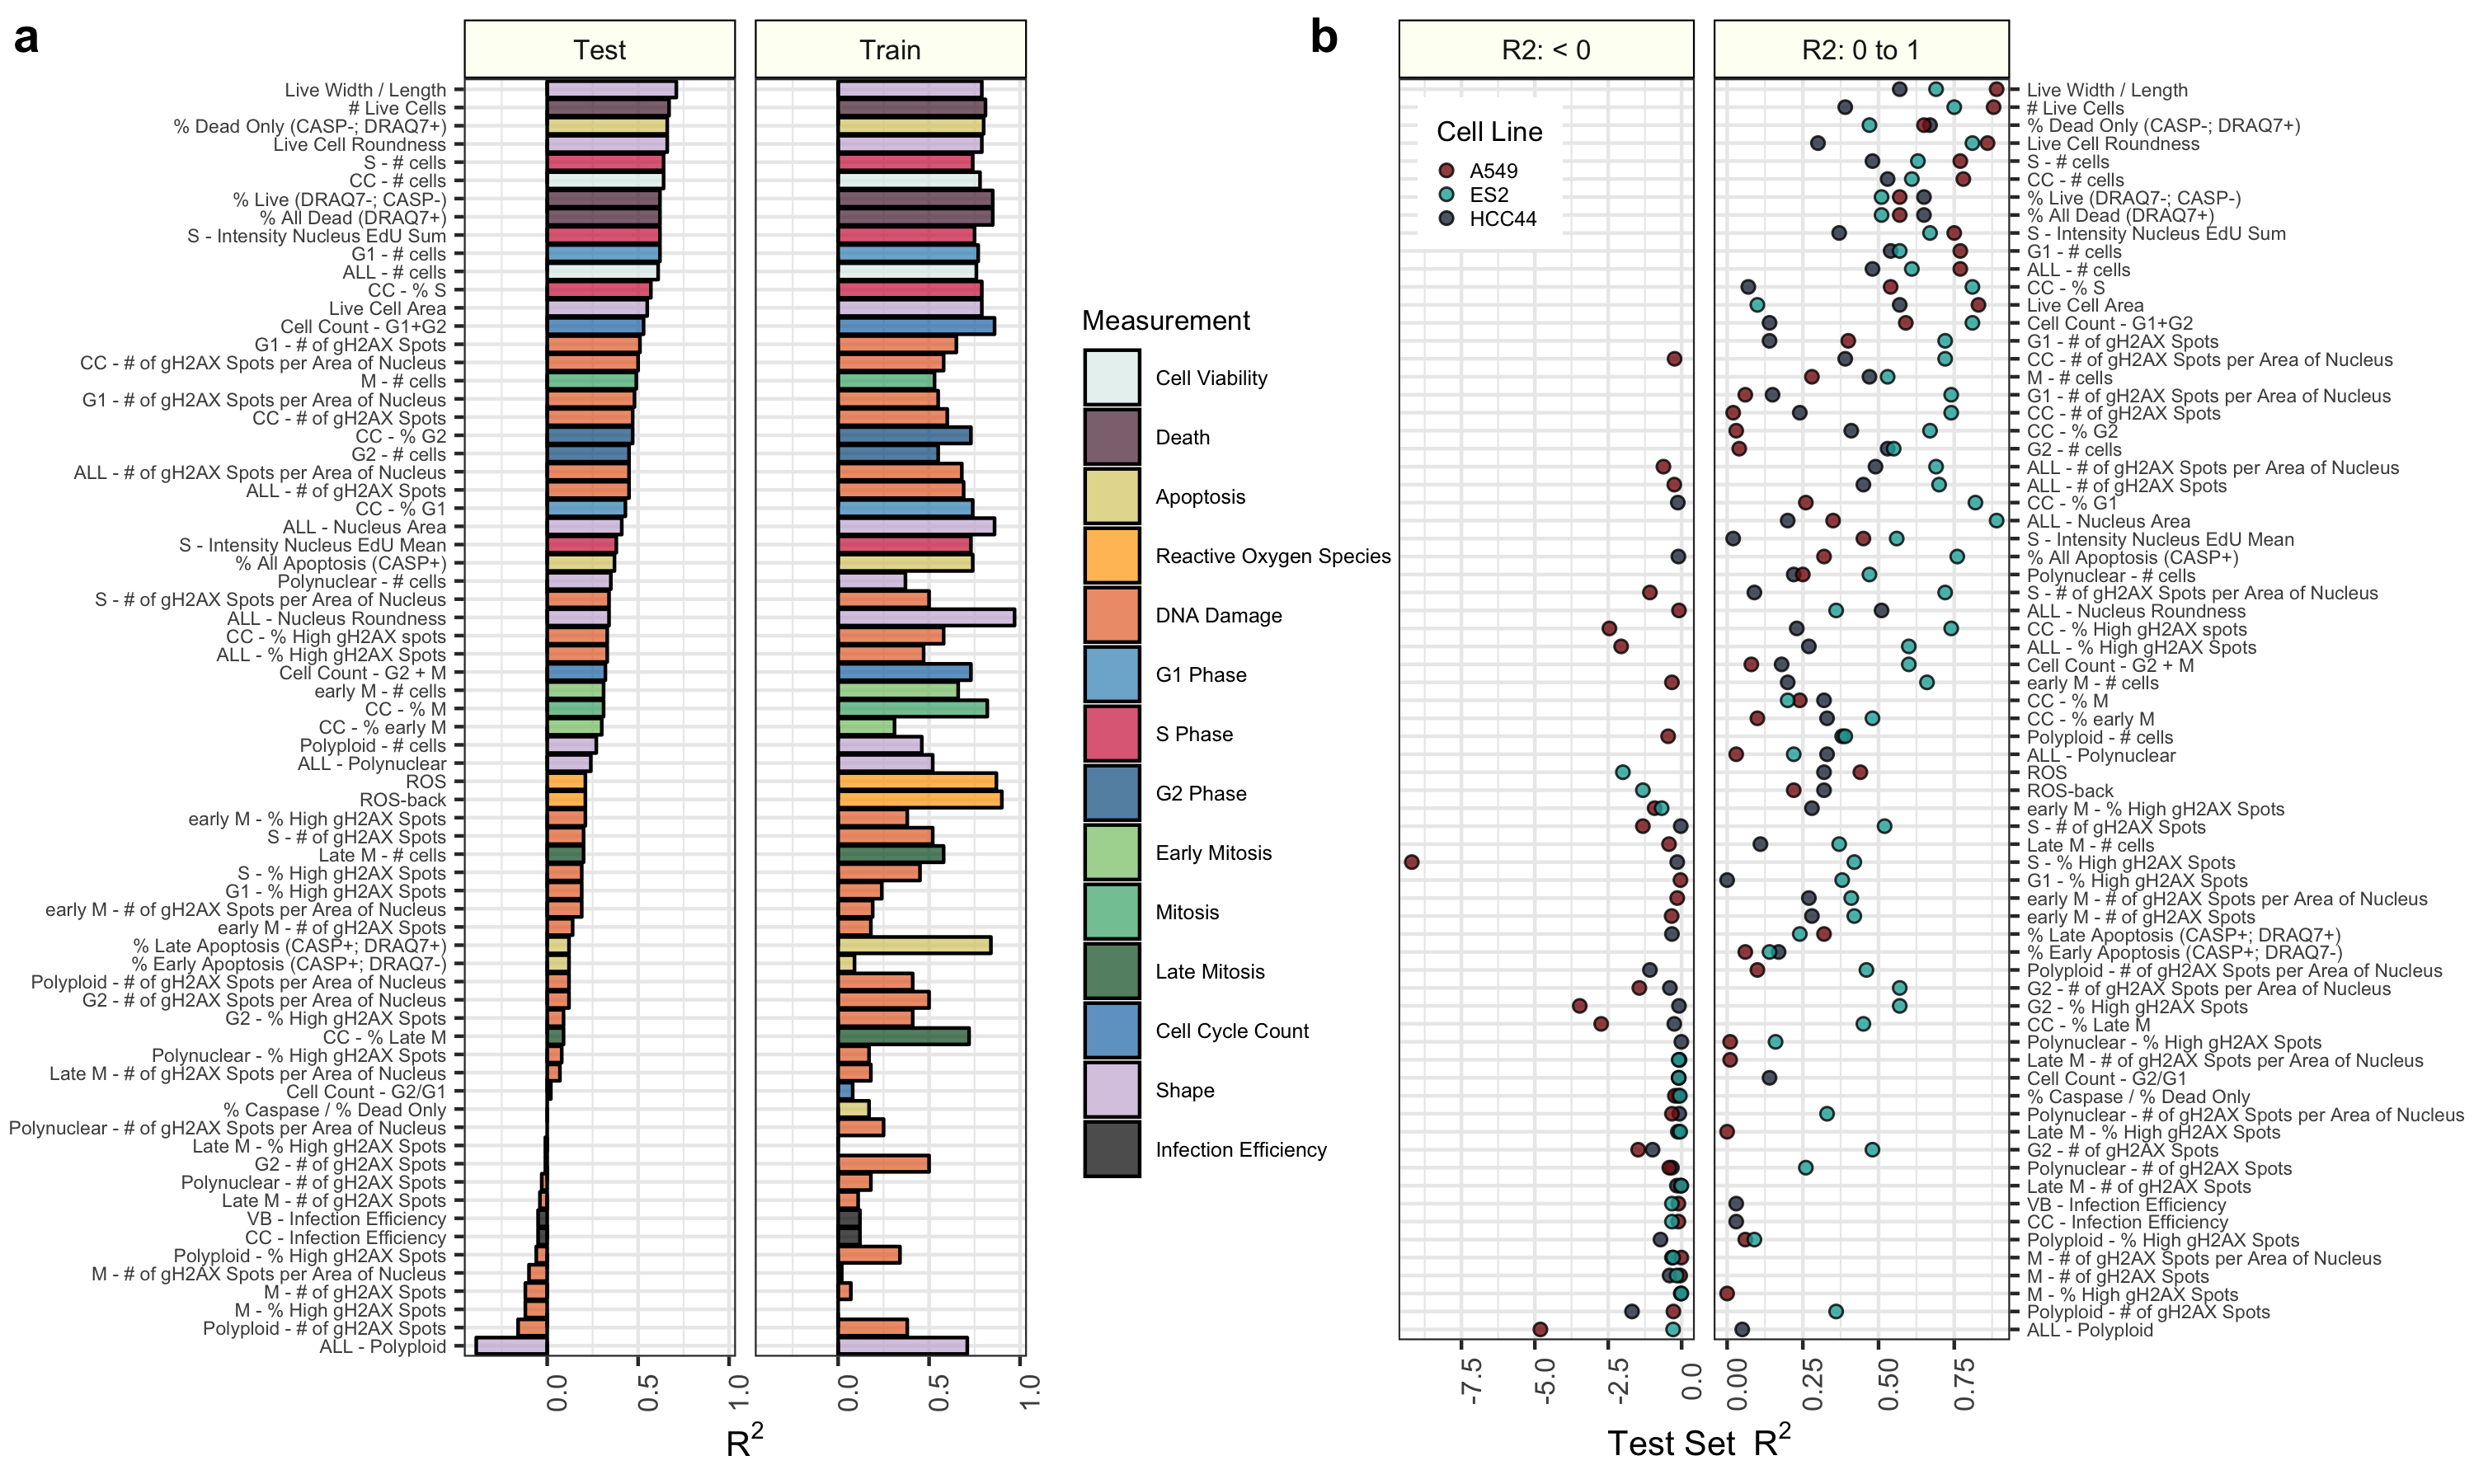
Initial results indicate that many of the cell health phenotypes can be predicted with our approach. However, there are many cell line specific differences.
We use conda as a package manager. To install conda see instructions.
We recommend installing conda by downloading and executing the .sh file and accepting defaults.
To create the computational environment, run the following:
# Make sure the repo is cloned
conda env create --force --file environment.yml
conda activate cell-health


