- Created a tool that estimates data science salaries (MAE ~ $ 26K) to help data scientists negotiate their income when they get a job.
- Scraped over 1100 job descriptions from glassdoor using python and selenium at 4th September,2020
- Engineered features from the text of each job description to quantify the value companies put on python, excel, aws, and spark.
- Optimized Linear, Lasso, and Random Forest Regressors using GridsearchCV to reach the best model.
- Built a client facing API using flask
Python Version: 3.7
Packages: pandas, numpy, sklearn, matplotlib, seaborn, selenium, flask, json, pickle
Scraper Github: https://github.com/arapfaik/scraping-glassdoor-selenium
Scraper Article: https://towardsdatascience.com/selenium-tutorial-scraping-glassdoor-com-in-10-minutes-3d0915c6d905
YouTube Project Walk-Through: https://www.youtube.com/playlist?list=PL2zq7klxX5ASFejJj80ob9ZAnBHdz5O1t
Flask Productionization: https://towardsdatascience.com/productionize-a-machine-learning-model-with-flask-and-heroku-8201260503d2
Project Idea: https://www.youtube.com/channel/UCiT9RITQ9PW6BhXK0y2jaeg
Tweaked the web scraper github repo (above) to scrape 1100 job postings from glassdoor.com. With each job, we got the following:
*Job title
*Salary Estimate
*Job Description
*Rating
*Company
*Company Size
*Company Founded Date
*Type of Ownership
*Industry
*Sector
*Revenue
After scraping the data, I needed to clean it up so that it was usable for our model. I made the following changes and created the following variables:
*Parsed numeric data out of salary
*Made columns for employer provided salary and hourly wages
*Removed rows without salary
*Parsed rating out of company text
*Made a new column for company state
*Added a column for if the job was at the company’s headquarters
*Transformed founded date into age of company
*Made columns for if different skills were listed in the job description:
- Python
- R
- Excel
- AWS
- Spark
*Column for simplified job title and Seniority
*Column for description length
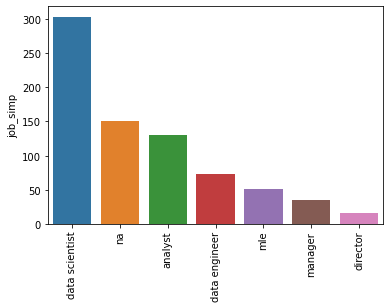
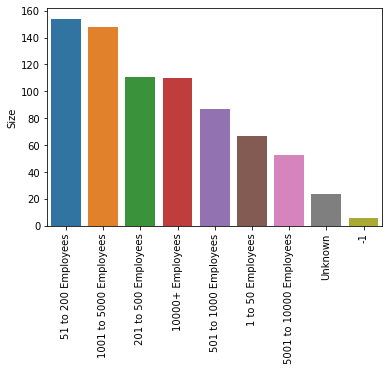
I looked at the distributions of the data and the value counts for the various categorical variables. Below are a few highlights from the pivot tables.
First, I transformed the categorical variables into dummy variables. I also split the data into train and tests sets with a test size of 30%.
I tried three different models and evaluated them using Mean Absolute Error. I chose MAE because it is relatively easy to interpret and outliers aren’t particularly bad in for this type of model.
I tried three different models:
*Multiple Linear Regression – Baseline for the model
*Lasso Regression – Because of the sparse data from the many categorical variables, I thought a normalized regression like lasso would be effective.
*Random Forest – Again, with the sparsity associated with the data, I thought that this would be a good fit.
The Random Forest model far outperformed the other approaches on the test and validation sets.
*Random Forest : MAE =-29.61
*Linear Regression: MAE = -26.172941
*Ridge Regression: MAE = 31.09
I'm planning to put this for production using Flask API and Heroku


