pysheds 


Documentation
Read the docs here.
Media
Hatari Labs - Elevation model conditioning and stream network delineation with python and pysheds
Hatari Labs - Watershed and stream network delineation with python and pysheds
Gidahatari - Delimitación de límite de cuenca y red hidrica con python y pysheds
Earth Science Information Partners - Pysheds: a fast, open-source digital elevation model processing library
Example usage
See examples/quickstart for more details.
Data available via the USGS HydroSHEDS project.
Read DEM data
# Read elevation and flow direction rasters
# ----------------------------
from pysheds.grid import Grid

grid = Grid.from_raster('n30w100_con', data_name='dem')
grid.read_raster('n30w100_dir', data_name='dir')
grid.view('dem')
Elevation to flow direction
# Determine D8 flow directions from DEM
# ----------------------
# Fill depressions in DEM
grid.fill_depressions('dem', out_name='flooded_dem')

# Resolve flats in DEM
grid.resolve_flats('flooded_dem', out_name='inflated_dem')

# Specify directional mapping
dirmap = (64, 128, 1, 2, 4, 8, 16, 32)

# Compute flow directions
# -------------------------------------
grid.flowdir(data='inflated_dem', out_name='dir', dirmap=dirmap)
grid.view('dir')
Delineate catchment from flow direction
# Delineate a catchment
# ---------------------
# Specify pour point
x, y = -97.294167, 32.73750

# Delineate the catchment
grid.catchment(data='dir', x=x, y=y, dirmap=dirmap, out_name='catch',
               recursionlimit=15000, xytype='label')

# Crop and plot the catchment
# ---------------------------
# Clip the bounding box to the catchment
grid.clip_to('catch')
grid.view('catch')
Compute accumulation from flow direction
# Calculate flow accumulation
# --------------------------
grid.accumulation(data='catch', dirmap=dirmap, out_name='acc')
grid.view('acc')
Compute flow distance from flow direction
# Calculate distance to outlet from each cell
# -------------------------------------------
grid.flow_distance(data='catch', x=x, y=y, dirmap=dirmap,
                   out_name='dist', xytype='label')
grid.view('dist')
Extract the river network
# Extract river network
# ---------------------
branches = grid.extract_river_network(fdir='catch', acc='acc',
                                      threshold=50, dirmap=dirmap)
Add land cover data
# Combine with land cover data
# ---------------------
grid.read_raster('nlcd_2011_impervious_2011_edition_2014_10_10.img',
                  data_name='terrain', window=grid.bbox, window_crs=grid.crs)
grid.view('terrain')
Add vector data
# Convert catchment raster to vector and combine with soils shapefile
# ---------------------
# Read soils shapefile
import geopandas as gpd
from shapely import geometry, ops
soils = gpd.read_file('nrcs-soils-tarrant_439.shp')
# Convert catchment raster to vector geometry and find intersection
shapes = grid.polygonize()
catchment_polygon = ops.unary_union([geometry.shape(shape)
                                     for shape, value in shapes])
soils = soils[soils.intersects(catchment_polygon)]
catchment_soils = soils.intersection(catchment_polygon)
Convert from vector to raster
# Convert soils polygons to raster
# ---------------------
soil_polygons = zip(catchment_soils.geometry.values,
                    catchment_soils['soil_type'].values)
soil_raster = grid.rasterize(soil_polygons, fill=np.nan)
Estimate inundation using the Rapid Flood Spilling Method
# Estimate inundation extent
# ---------------------
from pysheds.rfsm import RFSM
grid = Grid.from_raster('roi.tif', data_name='dem')
grid.clip_to('dem')
dem = grid.view('dem')
cell_area = np.abs(grid.affine.a * grid.affine.e)
# Create RFSM instance
rfsm = RFSM(dem)
# Apply uniform rainfall to DEM
input_vol = 0.1 * cell_area * np.ones(dem.shape)
waterlevel = rfsm.compute_waterlevel(input_vol)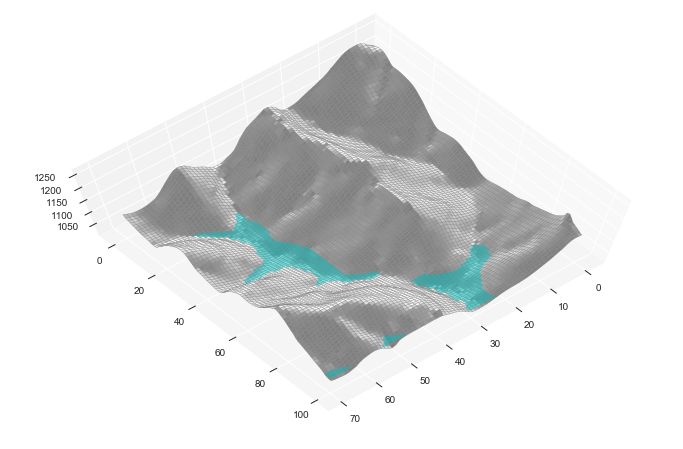
Features
- Hydrologic Functions:
flowdir: DEM to flow direction.catchment: Delineate catchment from flow direction.accumulation: Flow direction to flow accumulation.flow_distance: Compute flow distance to outlet.extract_river_network: Extract river network at a given accumulation threshold.cell_area: Compute (projected) area of cells.cell_distances: Compute (projected) channel length within cells.cell_dh: Compute the elevation change between cells.cell_slopes: Compute the slopes of cells.fill_pits: Fill simple pits in a DEM (single cells lower than their surrounding neighbors).fill_depressions: Fill depressions in a DEM (regions of cells lower than their surrounding neighbors).resolve_flats: Resolve drainable flats in a DEM using the modified method of Garbrecht and Martz (1997).compute_hand: Compute the height above nearest drainage (HAND) as described in Nobre et al. (2011).
- Utilities:
view: Returns a view of a dataset at a given bounding box and resolution.clip_to: Clip the current view to the extent of nonzero values in a given dataset.set_bbox: Set the current view to a rectangular bounding box.snap_to_mask: Snap a set of coordinates to the nearest masked cells (e.g. cells with high accumulation).resize: Resize a dataset to a new resolution.rasterize: Convert a vector dataset to a raster dataset.polygonize: Convert a raster dataset to a vector dataset.detect_pits: Return boolean array indicating locations of simple pits in a DEM.detect_flats: Return boolean array indicating locations of flats in a DEM.detect_depressions: Return boolean array indicating locations of depressions in a DEM.check_cycles: Check for cycles in a flow direction grid.set_nodata: Set nodata value for a dataset.
- I/O:
read_ascii: Reads ascii gridded data.read_raster: Reads raster gridded data.to_ascii: Write grids to delimited ascii files.to_raster: Write grids to raster files (e.g. geotiff).
pysheds supports both D8 and D-infinity routing schemes.
Installation
pysheds currently only supports Python 3.
Using pip
You can install pysheds using pip:
$ pip install pyshedsUsing anaconda
First, add conda forge to your channels, if you have not already done so:
$ conda config --add channels conda-forgeThen, install pysheds:
$ conda install pyshedsInstalling from source
For the bleeding-edge version, you can install pysheds from this github repository.
$ git clone https://github.com/mdbartos/pysheds.git
$ cd pysheds
$ python setup.py install
or
$ git clone https://github.com/mdbartos/pysheds.git
$ cd pysheds
$ pip install .
Performance
Performance benchmarks on a 2015 MacBook Pro:
- Flow Direction to Flow Accumulation: 36 million grid cells in 15 seconds.
- Flow Direction to Catchment: 9.8 million grid cells in 4.55 seconds.


