An example of supervised machine learning to formulate a linear regression that models the movement of a large set of continuous data over time and forecasts the trajectory of that data into the future.
Linear regression takes an input or explanatory variable, and tests for a relationship with an output variable. The input variables are usually arbitrary and assumptive.
For example, if we were using linear regression to model a lemonade stand's business and to make some predictions about its sucess: the input variables might be how hot it is outside, or how big the stand's sign was; the ouput variable might be the daily revenue or how much lemonade we sold. It could be useful in testing the assumption that the heat on any given day, and the size of the lemonade stand's sign, is what drives our lemonade sales.
In practice, however, linear regression corroborates some variable's impact--it speculatively models_causality_...more so than being a surefire means of mining hard data and generating a prediction on which you'd want to place a bet.
This solution relies on the Python Data Analysis library (pandas, etc.) to parse and analyze a very large dataframe of publicly available stock values for Google, and forecasts the future value of the stock's closing price for the next 33 days.
The data is culled from ten_years of daily stock prices for Google. The output for this program is an array of forecasted adjusted closing prices, and an accuracy rating of those prices, as well as a graphical plot of the prices--both past and predicted.
We call this "supervised" machine learning, because there's a bit of tinkering here... We "train" the algorithm to crunch the data, and do so until an accuracy rating starts to look acceptable to us.
As mentioned, the input variables leveraged by the linear regression algorithm are totally arbitrary. In this model, the differences between daily high and low values as well as trading volume are assumed to be impactful on the closing price...and we test the accuracy of that assumption.
The metric for quantifying the model’s "predictive accuracy" is known as R-Squared. R-Squared is more a measure of how each of the data points (daily prices) conforms to, or how tightly packed around they are to the averaged trajectory those values. It references, to some degree, the strength of the trajectory driving the forecast over a given duration of time.
R-Squared reveals the relationship of a value to time. The more closely prices move in a linear relationship with the passing of time, the stronger the trend. Put another way, R-squared simply measures the degree to which the movement of the stock's price can be explained by the underlying algorithm we've created to model that movement.
R-Squared values range from 0 to 1. A score of 1.00 would indicate a perfect correlation, whereas a score of 0.00 indicates no correlation between the price and the regression as calculated over the given period of time.
For example, if the R-Squared value over 30 days is at 0.8, this means
80% of the price's movement aligns or fits well with the our assumptions.
The other 20% indicates prices that do not fall into or fit well within
the model--as algorithmically defined.
R-Squared, more so than a measure of forecast accuracy, is useful as means to corroborating market trends, or other technical indicators (for instance, a Regression Slope indicator--which reveals if the market is going up or down).
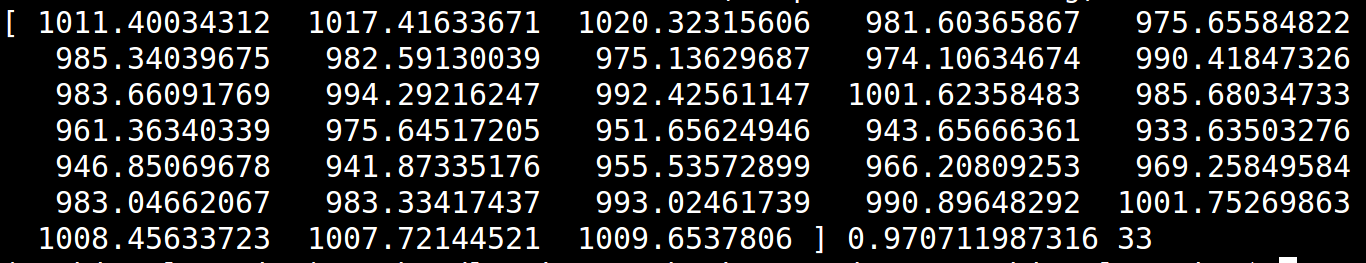
For our model here, you can see the Python interpreter's output: an array of daily adusted closing prices for Google going 33 days into the future. The R-Squared value for those prices can be seen at the bottom right of the array, after the closing bracket ("]") for the prices.
Moreover, this script graph's these forecastedvalues. An example of the resultant graph is below:
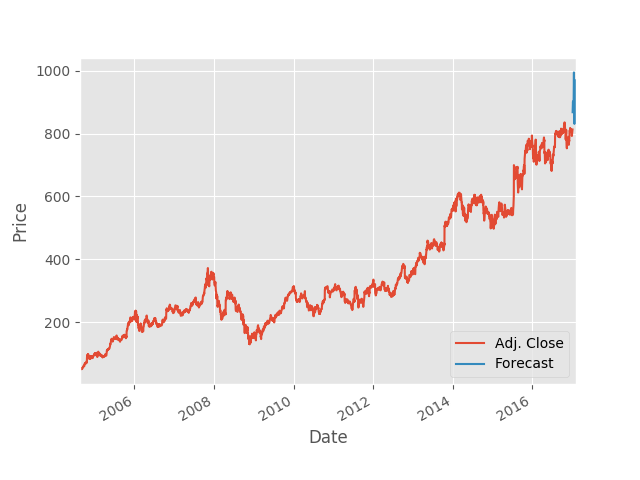
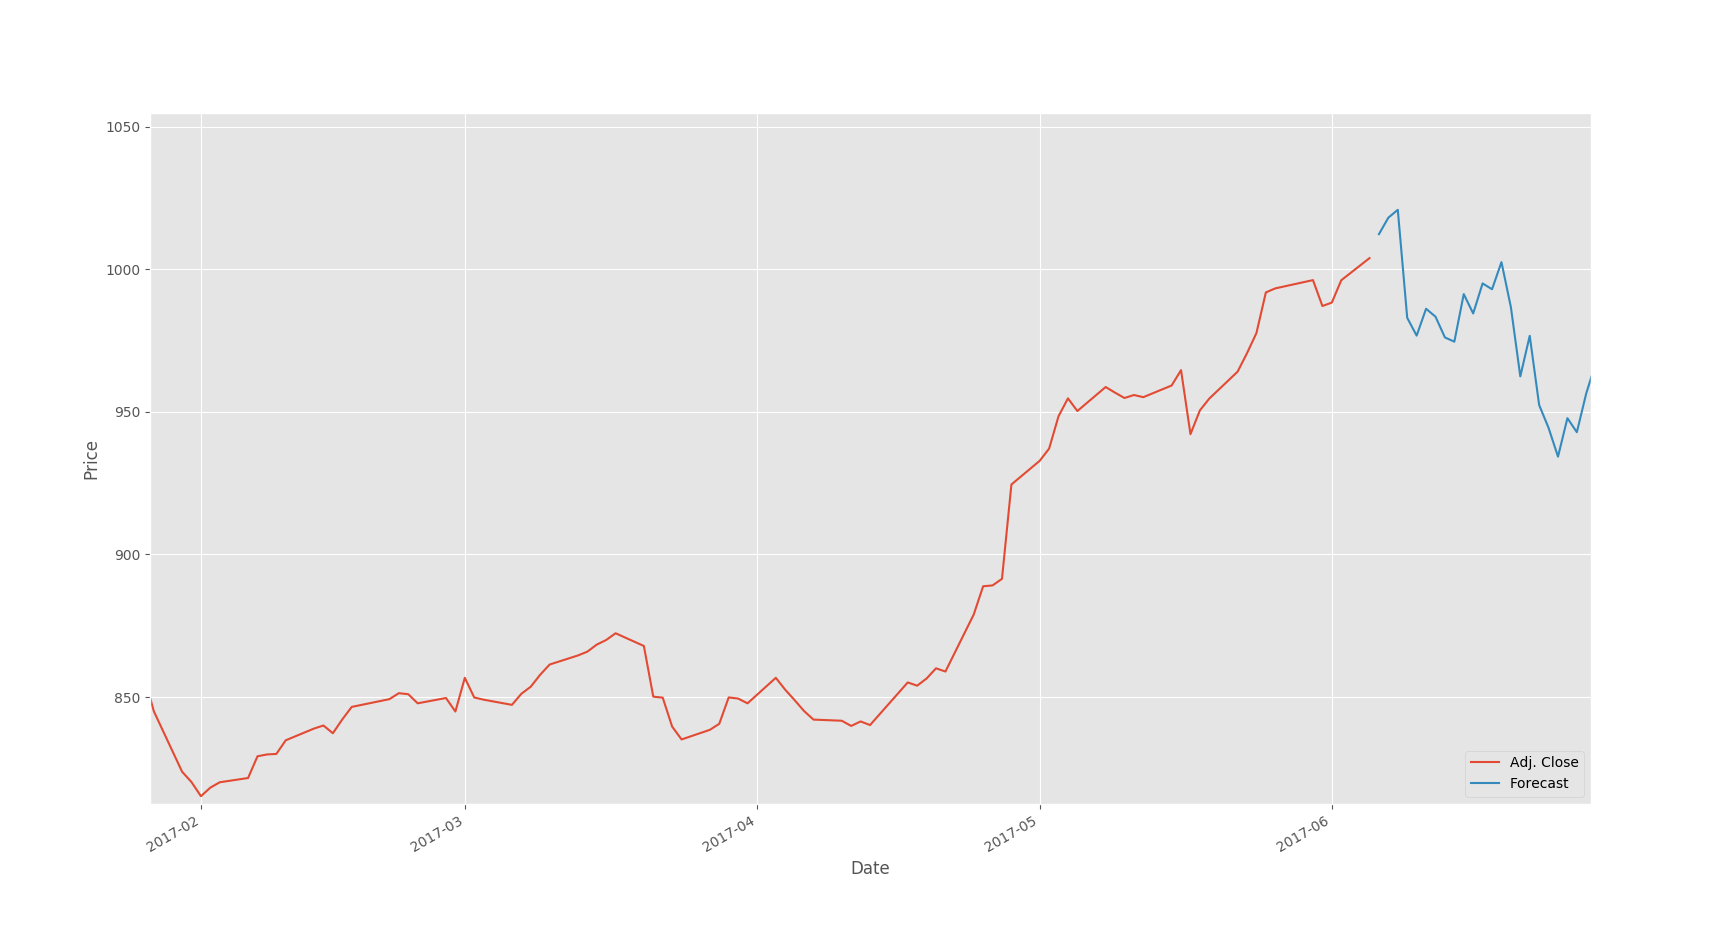
The graph, in full, not only shows the trajectory of Google's stock for a ten_year period, but also the forecasted values. The resultant values predicted 33 days into the future are contained in the blue blip at the right edge of the above chart. That segment is zoomed in here:
For additional comments regarding this methodology, and the technical indicators used as the underly input variables for this model, see the docstrings and inline commentary in the linear_regression.py script.
You'll need Python set up on your machine, of course, and you ought to set up a virtual environment, as per any proper Python project. Virtualenvwrapper is also recommended.
To install, clone this repo into your virtual env and execute the following command...
pip install -R requirements.txt
To run...
python linear_regression.py
For interactive graphing of the output in the Python interpreter without iPython:
In the matplotlibrc file...
-
Set the backend to TkAgg
-
Set interactive to True
If using a virtual env, you can find the matplotlibrc file in...
/home/<username>/.virtualenvs/machine_learning/lib/python3.4/site-packages/matplotlib/mpl-data/matplotlibrc
Also, you'll need to make sure tkinter is installed...
sudo apt-get install python3-tk
You may also need to install SIP (sip-4.19.1) and/or PyQt4 (PyQt4_gpl_x11-4.12).
Additional questions may be directed to Sean Bradley at:
sean at blogblimp dot com
The work herein is based closely on the work of Pythonista and data scientist, Harrison Kinsley and his excellent machine learning introduction.
THIS SOFTWARE IS PROVIDED BY THE COPYRIGHT HOLDER AND CONTRIBUTORS "AS IS" AND ANY EXPRESS OR IMPLIED WARRANTIES, INCLUDING, BUT NOT LIMITED TO, THE IMPLIED WARRANTIES OF MERCHANTABILITY AND FITNESS FOR A PARTICULAR PURPOSE ARE DISCLAIMED. IN NO EVENT SHALL THE COPYRIGHT HOLDER OR CONTRIBUTORS BE LIABLE FOR ANY DIRECT, INDIRECT, INCIDENTAL, SPECIAL, EXEMPLARY, OR CONSEQUENTIAL DAMAGES (INCLUDING, BUT NOT LIMITED TO, PROCUREMENT OF SUBSTITUTE GOODS OR SERVICES; LOSS OF USE, DATA, OR PROFITS; OR BUSINESS INTERRUPTION) HOWEVER CAUSED AND ON ANY THEORY OF LIABILITY, WHETHER IN CONTRACT, STRICT LIABILITY, OR TORT (INCLUDING NEGLIGENCE OR OTHERWISE) ARISING IN ANY WAY OUT OF THE USE OF THIS SOFTWARE, EVEN IF ADVISED OF THE POSSIBILITY OF SUCH DAMAGE.

