I love Desmos and use it all the time, but I was disappointed when I found out they didn't support slope and vector fields. So I decided to take on the challenge and code my own graphing calc with the desired functionality. After a lot of hard work and some intense mathematics 🙂, I'm proud to present the result, Grapher!
- Graph functions, slope fields, vector fields, polar, and parametric
- Zoom in and out (with animations 🥳)
- Beautiful rendering on Javascript canvas
- Powerful and intuitive syntax
- Set custom domain for polar and parametric graphs
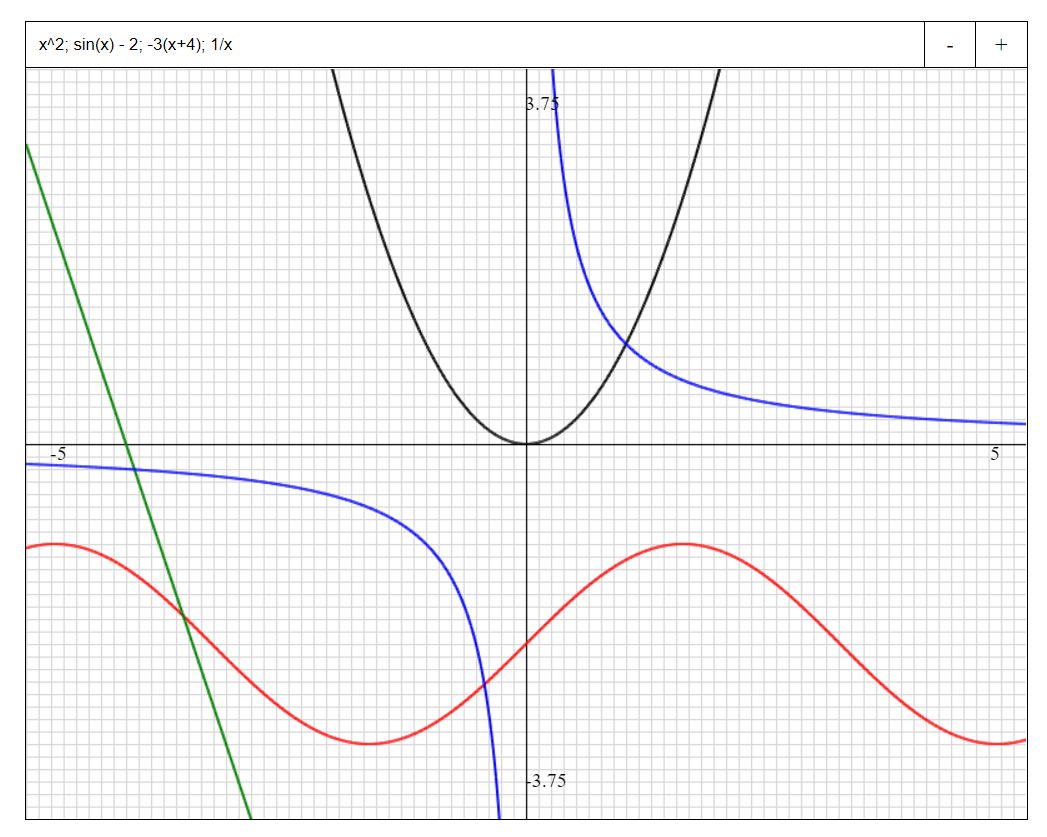
Functions: Enter a function f(x) by writing any expression with the x variable. Separate multiple graphs with semicolons.
For this demo, I've graphed the parabola x^2, the sine curve sin(x) - 2, the line -3(x + 4), and the function 1/x.
I'm using the wonderful math.js library for evaluating math expressions. Here are a few useful functions and constants you can use in Grapher.
- Trig functions:
sin(x),cos(x),tan(x),sec(x),asin(x)(inverse sine), ... - Square root:
sqrt(x) - Natural logarithm (base e):
log(x) - Constants:
pi,e
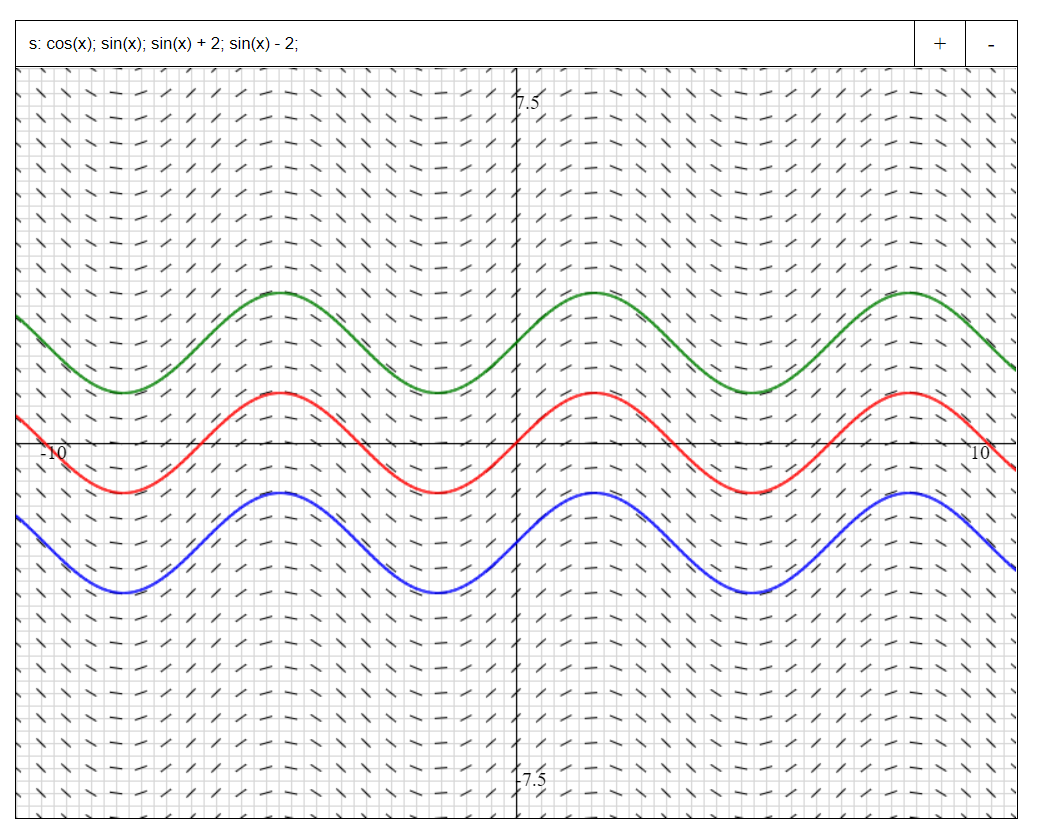
Slope Fields: Start off with the prefix s: and enter an expression in terms of x and y.
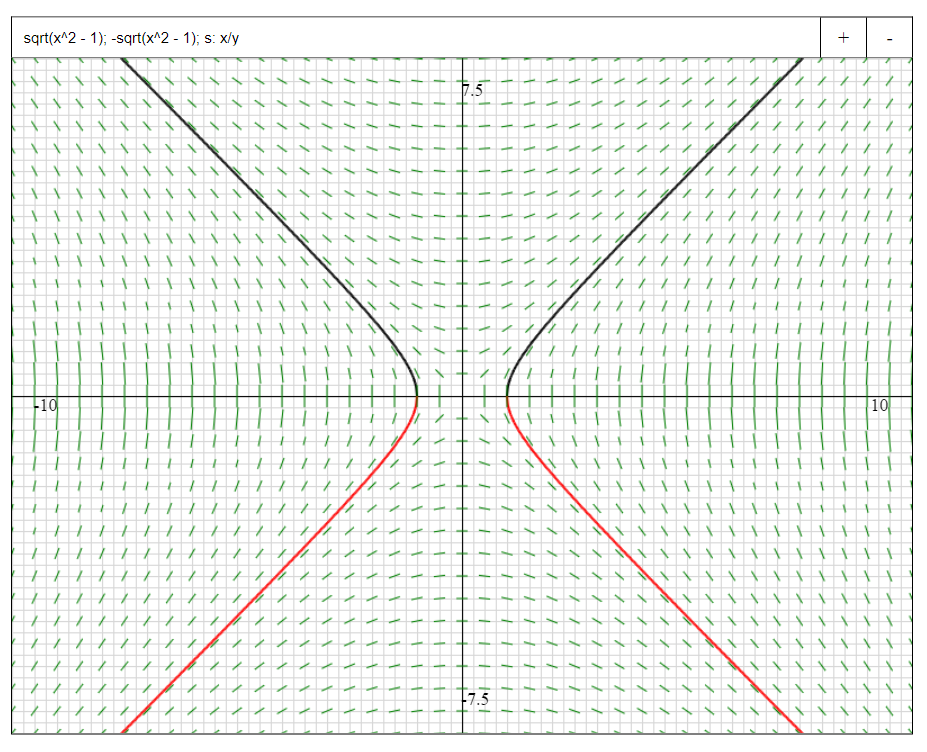
For this demo, I'm graphing the family of sine curves sin(x) + C and the slope field of cos(x). I've also included a hyperbola x^2 - y^2 = 1 and the slope field x/y.
| Sines | Hyperbola |
|---|---|
 |
 |
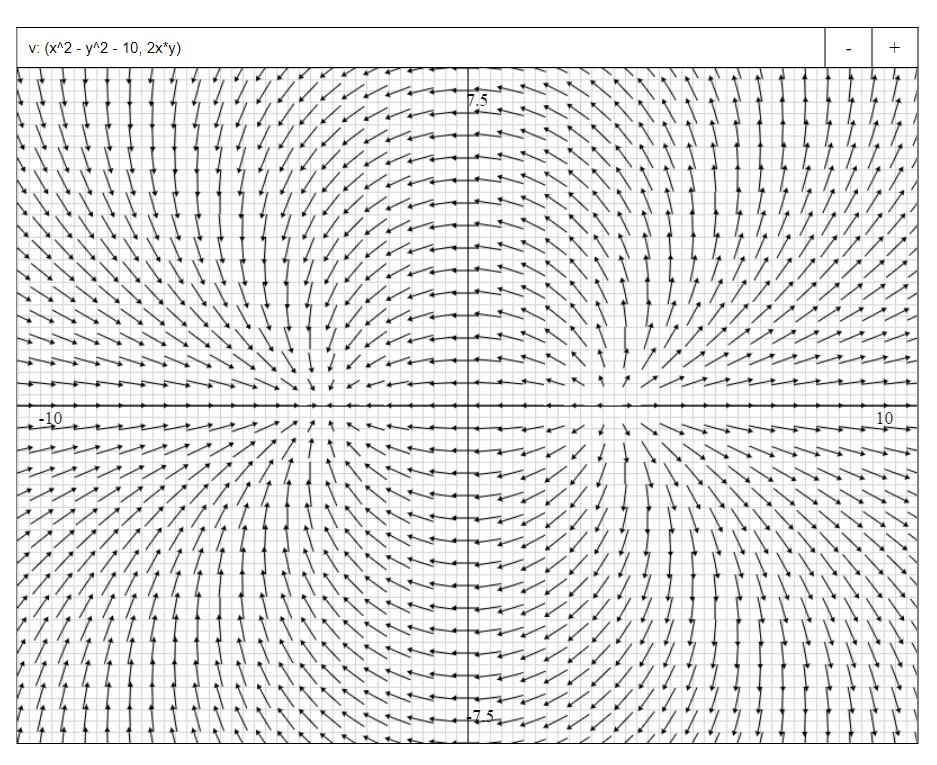
Vector Fields: Use the prefix v: and enter an expression in the form of v: (f(x, y), g(x, y)). The 2 functions of x and y inside the paranetheses are the x- and y-components of the vector.
For this demo, I've graphed a dipole vector field, which represents the electric field lines between a positive and negative charge in physics.
Polar: Use the prefix r = and enter an expression in the form of r = f(t).
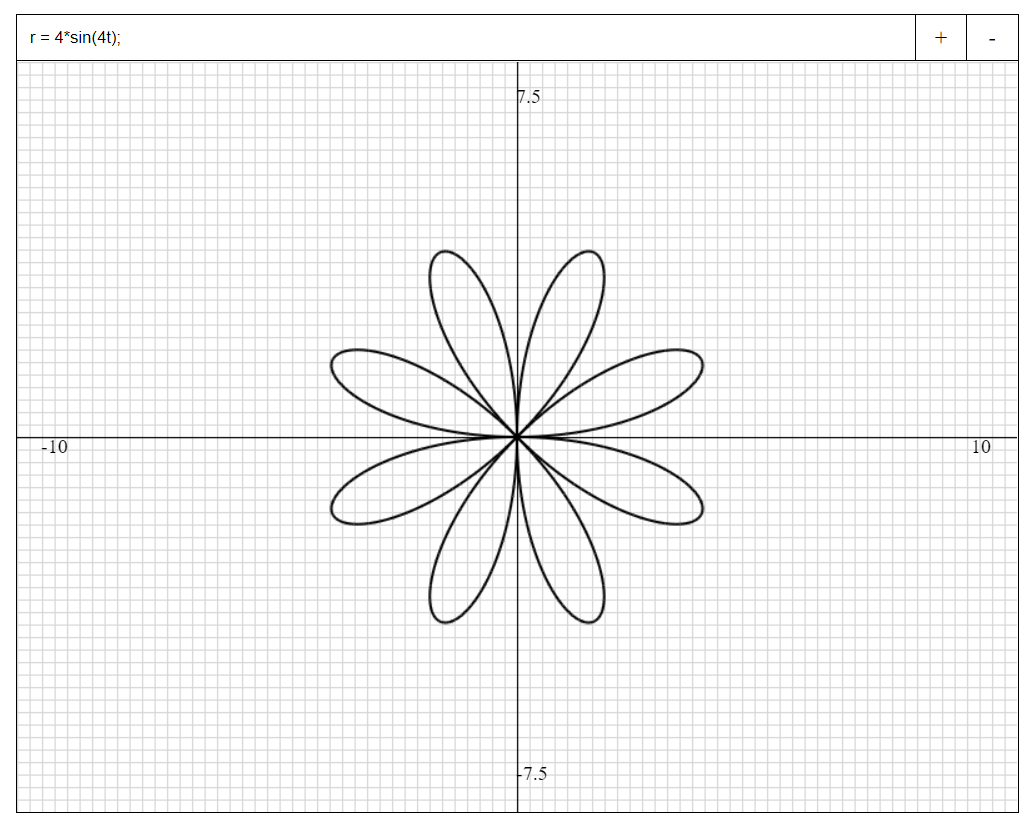
For this demo, I've graphed 4 polar curves:
- Rose curve:
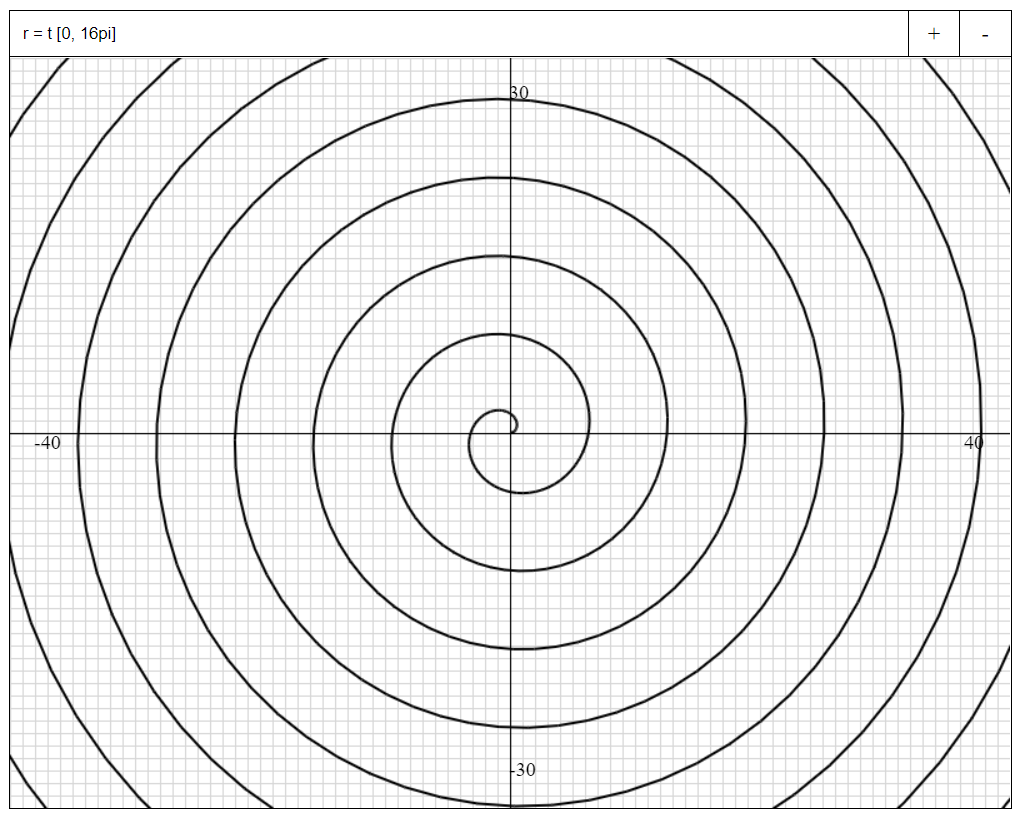
r = sin(4t)(8 petals) - Archimedes spiral:
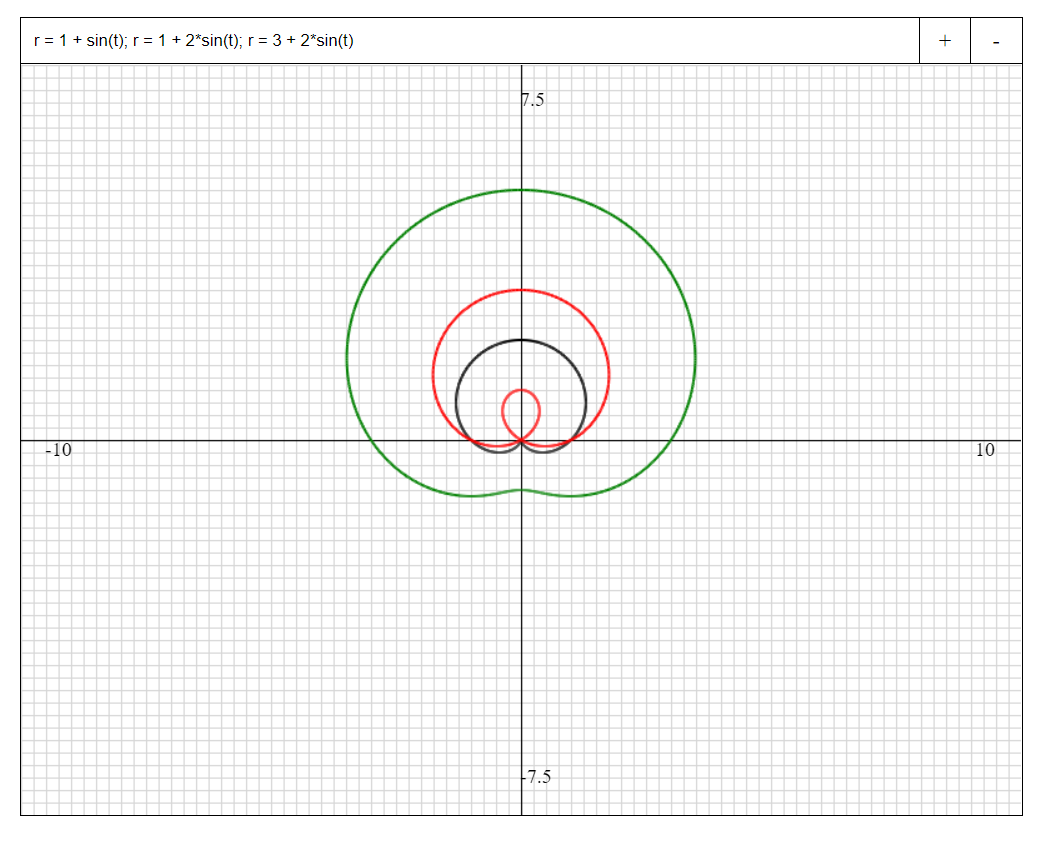
r = t [0, 16pi](setting custom t-domain, default is[0, 2pi]) - Limaçons:
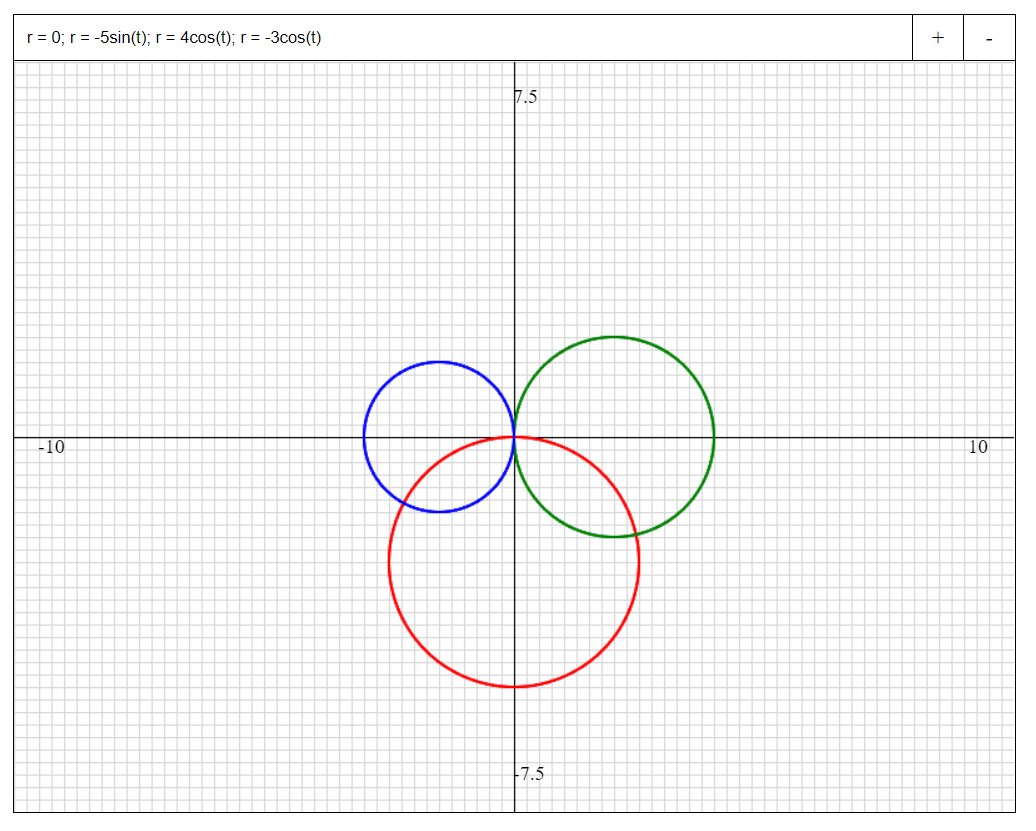
r = 1 + sin(t)(cardioid),r = 1 + 2sin(t)(inner loop), andr = 3 + 2sin(t)(dimpled) - Circles:
r = 0; r = -5sin(t); r = 4cos(t); r = -3cos(t)(using r = 0 as dummy graph to get nice colors 😎)
| Rose and Limacons | Spiral and Circles |
|---|---|
 |
 |
 |
 |
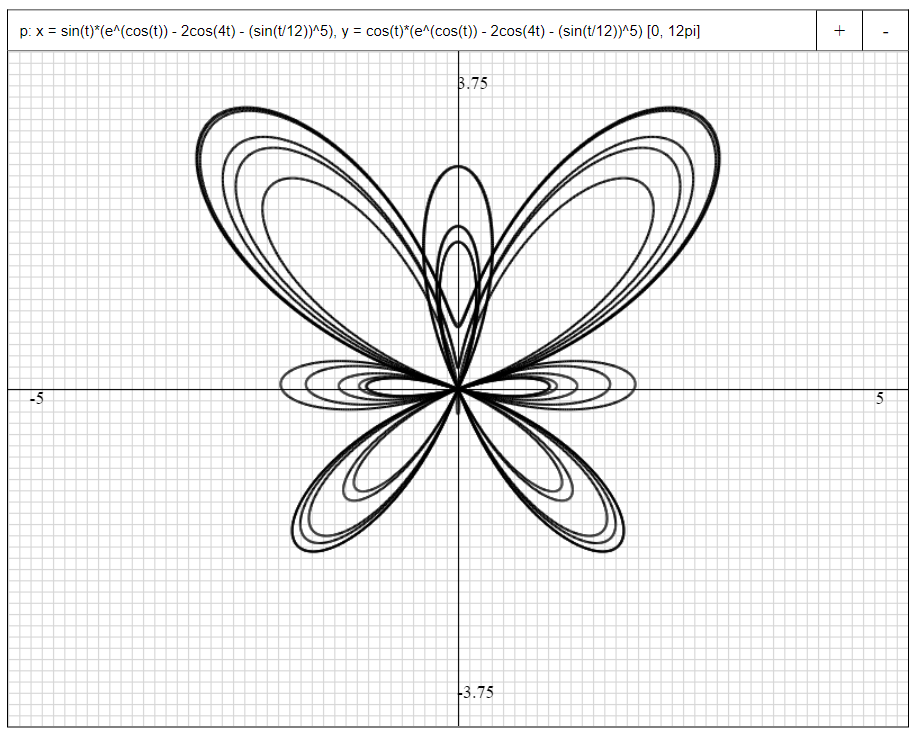
Parametric: Use prefix p: and enter in form of p: x = f(t), y = g(t).
For this demo, I've graphed the beautiful butterfly curve. Because this curve is so intricate, I upped the numbers of intervals from 1,000 (default) to 10,000.
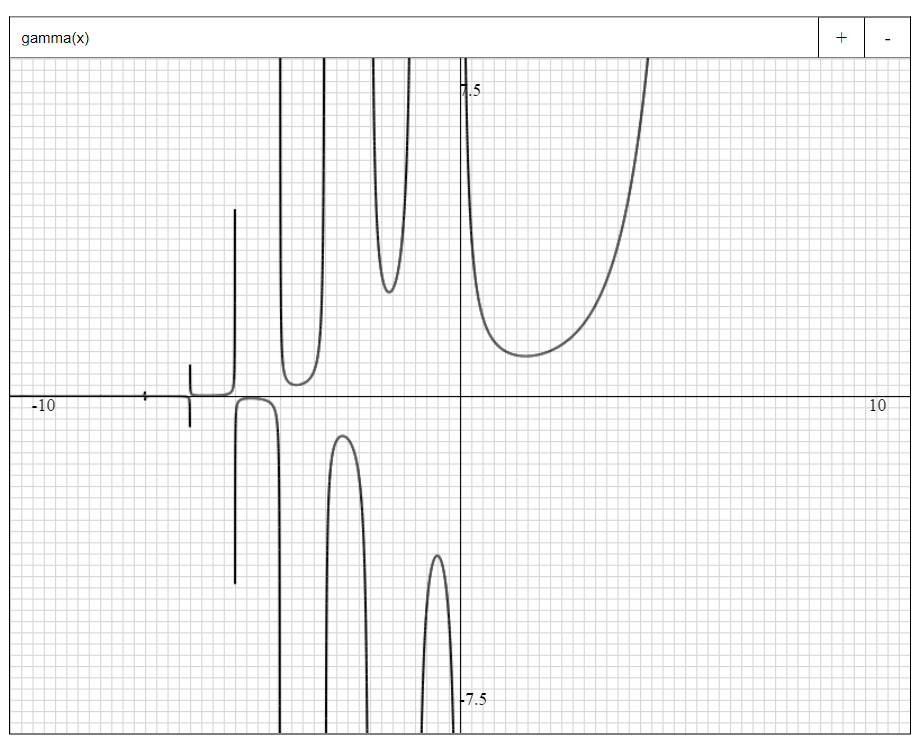
Bonus: Gamma function, the continuation of the factorial function to decimal and complex numbers (graphed with 10,000 intervals).
And that's it! Thanks for checking out my project and use Grapher to visualize whatever your heart desires!

