Code Monkey home page Code Monkey logo

confinementtool's Introduction

confinementtool's People

Contributors

jeansfr avatar joewheaton avatar kellymwhitehead avatar mattreimer avatar mhallerud avatar philipbaileynar avatar volkcj avatar wally-mac avatar

Stargazers

 avatar  avatar  avatar

Watchers

 avatar  avatar  avatar  avatar  avatar  avatar  avatar

confinementtool's Issues

Computing the valley expansion/contraction ratio

@dsear and @joewheaton,

I have been working on the tool that takes a river segment and it's upstream and downstream valley cross sections and computes the ratio. Segments are not always 500m long because a segment split could have been introduced by a bridge point. Because of this I divide the ratio by segment length.

So the basic equation is this:

ratio = (U/S width - D/S width) / Segment length.

So if a value is:

  • negative it means the reach is expanding
  • zero it means the U/S and D/S end cross sections are exactly the same width
  • positive it means the reach is contracting

So here is a screen shot of the segment colour coded by ratio, using 5 natural break classes.

Sample

Some preliminary stats

There are 69 segments along main stem of R. Derwent

Here is a histogram of the ratios.

Histogram

The two extreme values 1.2 and above are two segments which are coincidentally segments u/s of a bridge point but they have much shorter reach lengths and one intersects a hole in floodmap...

Here is the ratio changing with distance downstream

Scatter plot

Upstream starts at 10Km because this is the outflow segment of lake Bassenthwaite

Confining margins is failing now

So I have tried out the new update, everything is projected in UTM, disabled M and Z values. When running confining margins it gets all the way through and then fails at the end. Its still creating outputs within the path Outputs<Conefinement_001< ConfiningMargins. But this is the error I keep getting, Ive tried naming the realization something different but get the same error everytime.
capture So since the outputs were actually created I tried moving on to analysis anyways, but when I get to the spot to choose which realization to input It doesnt recognize any from within the project.
So it seems the confining margins tool is failing to attribute the outputs with any associated realization.

Assigning Flood Defence structure to Confinement Margin

I have created a model that creates a non-spatial table assigning structure length to a margin ID.

image

It has a user friendly interface to it.

image

The logic is as:

  1. Buffer Confinement Margins
  2. Intersect Buffers with EA flood defence lines
  3. Summarise lengths by margin ID
  4. Export to user specified table.

This table can be joined back to the confinement margins layer by the marginsID field.

By virtue that the marginID is recorded in this output table is must be near a structure. If the ID does not exist in the output table then the confinement margin buffer never intersected any flood defence line.

Potential issues

  • The buffer is a classic full buffer (a flat end one was creating wacky polygons) and thus buffers out left and right. So a confinement line will intersect structures in front and behind it.

  • The current model does not attempt to record type of structure, just that it exists. But as the input flood dataset would be the output of the Select and Export a sub-set of assets from UK flood defence dataset tool it will contain only the relevant structures (e.g. walls/embankments)

  • If you make the buffer too big then it will select structures on the opposite bank.

valley bottom width

integrated width of valley bottom polygon. area of valley bottom/segment length.

ConfinementTool>Analysis Tools errors

Purpose: to illustrate what errors I am running into for the confinement tool
Staring out my inputs all has the same projection and all work through the Confinement Toolbox and Confining Margins Tool and produces a good output as far as I can see.
The problems start arising when I start to run the Confinement Tools>Confinement on Segmented Network and the Moving Window Confinement scripts
The first problem that I ran into was once you open the Confinement on Segmented Network you can choose in the dropdown option of the Realization to use this error occurs and you are unable to select the segment id, isconfined, or isconstricted fields because the input stream network doesn’t exist

(However, if you do not choose the realization name and put the “RawConfiningState.shp” that was produced from the Confining Margins Tool. I was then able to choose the segment id, confined, and constricted fields)
I then ran the tool with the following inputs…

and got the following error…
ERROR 000218: Invalid case field name
I looked at the “RawConfiningState.shp” id field and noticed that there were duplicates and so what I did was create a new unique id field with long integer type. I then ran the tool again and got the following error which Josh Gilbert and I looked at and we came to a conclusion that it was a possible issue with the code which we will need your help/guidance.
Error in parsing arguments for Exists

I have also sent you an email to discuss these errors in screenshots

Documenting my tools and processes

@joewheaton,

Just before Christmas I put the brakes on my development primarily as I was starting to be in the situation of I can't see the wood for the trees. I discussed this with @dsear and have forged onward with documenting my tools as a help file. Every tool/bit of software should have help, in your case you provide it via a website, I have created a CHM file. I'm about 3/4 of the way through creating it and have uploaded the initial version of it to my fork. You can find it here.

  • Download the CHM file to your C:\ drive (must be on C:).
  • Right click on it > Properties > General tab > then click on Unblock (you only need to do this once).
  • Now double click to open it and explore what I have done.

I will be updating this over the next week, I need to add my workflow part. Once this is done, budget allowing, I can continue with development.

Identifying Constrictions @ Bridges and Crossings (i.e. confinement on both side)

@Hornbydd wrote:

David/Joe,
I have worked up the model logic for identifying confinements caused by bridges. As this has required some logic that I think works I would like to run it passed you for a sanity check, as such I have documented it in the attached document.

Duncan

And came up with:

Identifying confinements created by bridges

The document shows how a bridge confinement polyline is generated.
The logic follows as:

  1. From OS Topo Area select polygon where DescriptiveGroup = 'Road Or Track,Structure'
  2. Subset from this selection only the polygons that intersect channel centreline
  3. Buffer selection – currently I’m using 15m the same as buffering out from the channel for Joe’s confinement tool
  4. Convert valley bottom to a polyline and intersect with buffer
    The four figures below show four scenarios on the Derwent (6 where identified). Black lines are the bridge confinements.
    fig1
    Figure 1 Confinement generated on both sides.

fig2
Figure 2 No confinement generated.

fig3
Figure 3 Confinement identified on one bank.

fig4
Figure 4 Inconsistent attribution in OS Top Area means this bridge is not identified. But in this case it is adjacent to a confinement line. Outflow of Lake Bassenthwaite.

Generic Inputs to Confinement

Take all parameters and make them generic inputs, with drop-downs that can be used to establish the type of confinement as specified by the user.

This needs to be reflected in the Project.xml as well, probably add a few meta tags to do this.

Computing stream power Index

@dsear - A metric that requires computing is stream power. In the email you had defined stream power as:

stream power = (Catchment area * Slope) / 1:1000yr flood poly width

So firstly I have 3 questions that need clarification:

  1. Is the catchment area for the u/s end point of the segment or d/s end point? I am assuming it is for the d/s end.
  2. The slope is the valley centre-line slope for the segment?
  3. The flood poly width is the width measured across the floodplain from a single location, taken from the centre point of the segment snapped to the valley centre-line.

So using the example below you would expect stream power to be:

Example

(Catchment area in m2 * Slope in m/m) / width in m - not sure what the output units would be.

(370497500 * ((63.2 - 62.8) / 451) / 141) = 2,330.5

Please confirm I have understood how stream power should be computed?

Additional Tools/Functionality

  • Publish Project (i.e. set promoted realization/analysis)

  • Remove inputs, realizations, and analyses.

  • Add Date Created and UserName to Realizations, Analyses.

How to create a valley centre line?

@dsear and @joewheaton ,

What seem critical to computing some of the key metrics is generating that fabled dataset, the valley centre line! @dsear asked me to look into the VBET tool, to see if it could generate it. Below are some screen shots of it's output compared to the EA Floodzone map.

  1. Just getting the tool working. The default "High" Drainage area of 250 sq Km crashed the tool so had to drop it to 200 sq km. The tool failed to capture floodplain correctly, just ended up "buffering".

Screen shot of VBET output vs. EA Floodzone map

  1. Reading the help again and looking at the source code I then understood that the buffering out is strongly affected by what I set as "High" Drainage area, so I dropped it again to 100 sq km. This produce what initially looks like a better valley bottom, but I can see over estimation and not buffering out enough.

Screen shot of VBET output vs. EA Floodzone map

  1. My third attempt was to increase the buffer size of medium area from my initial 50m to 200m. This allowed the tool to capture the valley floor of medium sized but overestimates for smaller streams

Screen shot of VBET output vs. EA Floodzone map

Limitations

  • I don't think this tool could be used to roll out national scale processing as each run of it needs to be fine tuned for the catchment size.

  • It does not actually create the valley centre line. Unless Joe has got some killer move up his sleeve I need to think on how to extract a valley centre line...

Add Inputs to Project Tool Updates

  • Add multiple, or additional inputs at any stage in project life. Note, you will not be able to generate the first realization unless one of each of the three types of inputs exists within the project.

  • Include some basic geometry/overlay checks to ensure project integrity.

  • Determine if this can be accomplished in Confinement Margins tool instead.

Interpreting Confinement and Geomorphic change

So I've made a start at visually (no real confinment stats here) interpreting the sequence of events during the Cumbrian floods and Desmond flooding for a couple of reaches. What seems to be key are:

  1. a sequence of constricted flood flow followed by rapid expansion - these occur because of human confinment/constrictions or natural ones, and/or when a valley suddenly changes direction.(Examples 1-4)
  2. A large erodible confining margin - hi violumes of sediment supply upstream of a flow expansion results in floodplain deposition and avulsion/channel widening (Example 1,2,4).
  3. Changes in channel direction between confining margins where the receiving margin (downstream) is erodible (Example 1)
    example1

It is the sequence that is as important as the magnitude of change - ie Constriction into expansion + erodible margin = alot of change.
Erodible margin into constriction probably = limited change (transfer of sediment) until expansion then = deposition..
Legacy Infrastructure is important for constriction of flow (Example 4)

I think we're trapping confining margins, erodible and non-erodible margins,anthropogenic confining margins. Are we getting constrictions? What to do about expansion/constriction. How to allocate these attributes in terms of proportionof a 500m segment of channel centreline?

example2
example4

UK LCM2015 - Land cover lookup values

@dsear - please find attached an excel document, it has the LCM 2015 classes and I need you to assign your land intensity values to them.

Once you have edit it please upload it to this discussion.

LCMClassLookup.xlsx

Once you provide them I can re-code the CEH LCM 2015 25m raster into an intensity map.

Creating valley cross sections

@dsear - A key processing step to computing any floodplain metric (#41) is generating a sensible floodplain cross section from the river centre line segment. For that to work we need a sensible valley centre line, which I have been able to compute #39.

I have been able to work up the logic in a model that generates valley cross sections and it is working well.

Model

The output of the model generates the valley cross sections as shown in black below:

Valley Cross sections

Be aware that cross sections terminate at the edge of the flood map polygon, so internal holes will create shorter cross sections, an example is shown below:

A short Valley Cross section

The tool logic is:

  • Get centroid of river segment
  • Find nearest point on valley centrelines
  • Construct a line between these two point locations
  • Do some data preparation (to deal with performance/data volume)
  • Use the extend line tool to extend the initial line out to the edge of the flood map polygon
  • Clean up datasets

Hard wired Model properties (which can be easily changed) are:

  • Output coordinate system is British National Grid
  • The tool searches up to 1Km when trying to identify a flood map polygon edge.

Limitations

  • User requires an Advance license because of tools it uses.
  • The Extend Line tool works a treat but is slow, something you have to accept.

Finalize Documentation for 2.2

  • Home Page
  • New Project
  • Load Inputs
  • Calculate Margins
    • Project
    • Non Project
    • Methods
    • Outputs
  • Confinement Segments
    • Project
    • Non Project
    • Method (link to Confinement Calculation Method)
    • Outputs
  • Moving Window
    • Project
    • Non Project
    • Method (link to Confinement Calculation Method)
    • Outputs
  • Integrated Width
    • Method
  • Confinement Calculation Method
  • About project mode
  • Standard Inputs

"Raw_Confining_State.shp": multiple segments have the same segment number

The issues below pertain to the "Raw_Confining_State.shp"
https://mail.google.com/mail/u/0/?ui=2&ik=aa2e7025bc&view=att&th=15c22aff0ddbb2a2&attid=0.1&disp=safe&z
org_fid_manipulated
orig_fid_unchanged
uniqueid_field_created

w, the input stream network for the tool (automated).

The "confinement on Segmented Network" tool requires a unique value for each segment in the network. The "FID" field will not work; the field type is an "Object_ID" field and the tool seems to need a long, short float or double field.
The tool will run successfully (provide real number constriction and confinement values in the ConfinementSegments.shp) off the Orig_FID field, however multiple segments have the same segment number so values in this field are not unique. The "Orig_FID" field is a long integer field.

Transferring DOD to Segments

@dsear and @joewheaton,

I have developed up the tool that uses the floodplain partition to transfer DoD data to the segmented centre line. This was a raster developed in previous work which has a 2m resolution and the cell values represent m3 change.

image
Here is the DoD from 2011, reds are erosion, blues are deposition and the grey is zero change.

The tool will carry out zonal stats at the floodplain partition level, correct for NULL values and transfer over to the segment the SUM of erosion values (< 0), SUM of deposition (> 0) and compute gross change (Sum of Erosion * -1) + (Sum of Deposition)

image
Centre line showing gross change.

calculating bfw using precip and drainage area versus discharge

Hi @joewheaton

I want to calculate the estimated bankfull width for each of my thesis sites.

This confinement tool uses the Beechie(2013) method and the regression:
bf_width(m) = 0.177(DrainageArea^0.397)(Precip^0.453))

The tool then uses a "buffer width" % or value that it seems functions to scale it to the watershed of interest.

What I am wondering is if that "buffer width" value is analogous to the constant A in the hydraulic geometry relationship of width = A*Q^.5 and if there is a way to automate a bankfull width calculation while avoiding using PRISM data as an input. I would use the BRAT Q2 output as a discharge value. I'll dive in deeper to the Beechie paper and the code for this tool, but would appreciate any advice if you have done this before. Thanks!

Extracting Confinement Margin Erodability

I have extracted out from the UK BGS 1:50K geology datasets covering the Derwent study region the descriptive texts. David then identified which geologies were erodible or non-erodible. His logic was

(1) All bedrock is non-erodible, (2) All superficial with sand and gravel are erodible and (3) All superficial without sand and gravel in the description is non-erodible.

The Erodibility values are simply Y for yes, N for No and X for unknown/water in the superficial layer.

These values are store in the Excel spreadsheet (UC1476_Geology_LookUp.xlsx).

The idea is to build a model that will intersect the confinement margins with the geology and code into erodible values. A confinement margin line can intersect multiple geologies along its length as shown below.

image

In this example the proposed output would be a non-spatial table with one row recording summed lengths.

MarginID   Bed_Erod_N   Sup_Erod_Y   Sup_Erod_N   Sup_Erod_X
66              114            90              0           24

Recording it in this manner will allow you to identify when there is no superficial geology and the river is passing through bedrock as superficial will have zero lengths.

This approach requires me to create a margin ID field whilst running the confinement tool, easy to do.

Some questions from David...

Questions from @dsear

Q1: Are you OK with my Table of drivers of geomorphic change? I'd add to those a spatial element which would be some measure of presence/absence of upstream risk of sediment supply.

Q2: How to generate a risk of erosion/deposition in a 500m reach from these data? Options are:
a) Multicriteria weighting - driven by published expert opinion and "tuned" using Derwent data.
b) Fuzzy/Bayesian approach that you mentioned...
c) Machine Learning ....outside this project...but sounds doable.

Q3: Are you happy to get Duncan to build a tool that pulls together all his different parts to generate the data for Q1 and analysis in Q2 (though the analysis would be a seperate peice of code I guess)?

Generating the scale of erodibility

@joewheaton and @dsear I have worked up a tool that will generating the scale of erodibility. This is computed as length of confinement margin * elevation where elevation is the difference in mean elevation of margin minus mean elevation of river centreline segment. The assumption is that the river centreline is always lower than the confinement margin.

Tool logic is:

  1. The tool takes the centroid of the margin and uses that to locate nearest segment of river (what is the raw confining state dataset).
  2. Explode the margins and centreline segments into their constituent vertices and extract elevation from a DTM. The DTM used is the OS 5m Terrain DTM.
  3. Compute the mean elevation of margin (e1) and river centreline segment (e2).
  4. Transfer over the margin length (L) and then compute the scale as L * (e1-e2).
  5. Export to a table with margin ID so that it can all be joined to the original confinement margin layer.

As an image here is a zoomed in example:

Example
Note: all vertices have an elevation its simply label placement priority that is causing some not to display.

MarginID MarginMean CentrelineMean Length Erodability Area
5 63.45 59.47 519.42 2063.60

The model is below and has been given a nice user friendly interface.

Model

Tool interface:

Tool interface

Confinement on Segmented Network does not recognize my RawConfiningState Input Stream Network

When I input the project xml from my latest project (see Lemhi_Confinement_20mbuffer) the auto-filled input stream network fills with the correct RawConfiningState.shp file from the Confinement Margins Project, but it says the file does not exist or is not supported. Because of this, I cannot get the fields for "SegmentID", "IsConfined", nor "IsConstrict" to fill out either.

Also, will this process fail if either the project or realization titles have spaces in them?

Screenshots:
screenshot 2017-07-31 12 12 20
screenshot 2017-07-31 12 13 17
Data:
https://www.dropbox.com/home/Merlin_Transfer/Arielle

Measuring area of erosion between 2009 and 2015 bank lines

@dsear and @joewheaton ,

We have bank lines for 2009 and 2015, the area between them could represent erosion or deposition an example is shown below.

image

The challenge is to:

  1. Identify the area between these intersecting boundaries
  2. Identify if it is eroding or depositing
  3. Identify if it is genuine change or simply down to vagaries in digitising.

Step 1

  • Intersect the bank lines and feed the intersection points back into a split by points tool to segment the boundaries.

image
Intersection split points

Step 2

  • Extract centroids of bank segments and measure their distance from the river centreline
    image
    Green points are centroids of the segments created by the splitting with the intersection red points

Step 3

  • The segment centroids are paired, logic is pair a centroid with closest centroid, this allows us to assign a pairing ID to both points which can be passed back to the bank segments.

Step 4

  • A temporary "label layer" is created which is the mean centre of the paired centroids, this is used to pass attribution to the polygon created by enclosing the paired segments

image
Lines enclosed and attributed with a label layer

Step 5

  • The minimum of the two segment lengths is passed back to the polygon, the area of an imaginary 2m buffer is computed and this value is compared with the polygon area. If the polygon area is less than the buffer area then it is flagged as dubious.

image
Red indicates the polygon area is less than the proposed 2m buffer area and is therefore considered a possible digitising error rather than any real change.

Limitations with this tool

  • Banks leading up to the ends of the source banklines are dropped from this analysis as they have no intersection point allowing polygon enclosure.
  • This tool cannot deal with islands, it is for bank change only. Hope to fix this with a separate tool that requires another line of logic to deal with.

Segmenting the network - best approach

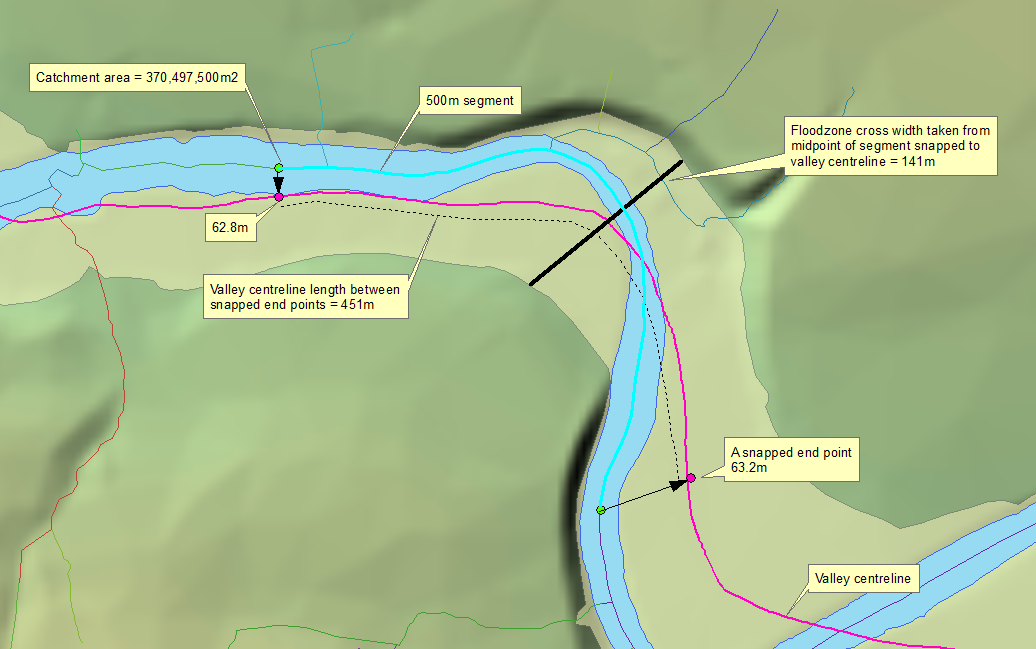
@joewheaton and @dsear I have been working up the logic to segment a river network. I am unlikely to use the existing segmentation tools because of their reliance to pre-populated USA attribution and that David has specified that the segmenting of the network should include points that are:

  • Derived from 500m measure
  • Tributary junctions
  • Bridge intersection

So all 3 sets of points will be used to cut up the network. I've had a quick chat with David to make him aware of the implications of this and would like your opinion. We think dropping tributary junctions as split points is the way forward for the following reasons...

Below is a screen shot of all 3 split point types (tributaries, regular distance (500m) and bridges)

image

If you use ALL 3 point types then in the sample data I am using you go from 1,189 branches to 3,239 segments, their distribution of lengths are:

image

Variable N N* Mean SE Mean StDev Minimum Q1 Median Q3 Maximum
Shape_Length 3239 0 206.88 2.83 160.88 0.07 69.82 165.10 317.56 500.00

Segmenting with all types of points creates segments ranging in length from 7cm up to 500m with 12% of segments attaining 500m.

Compare this with splitting only with bridge points and 500m distances. You go from 1,189 branches to 2,154 segments.

image

Variable N N* Mean SE Mean StDev Minimum Q1 Median Q3 Maximum
Shape_Length 2154 0 311.09 4.13 191.66 0.07 119.86 353.05 500.00 500.00

One still gets small segments (to be expected) but you have at least 43% of the data achieving a 500m length.

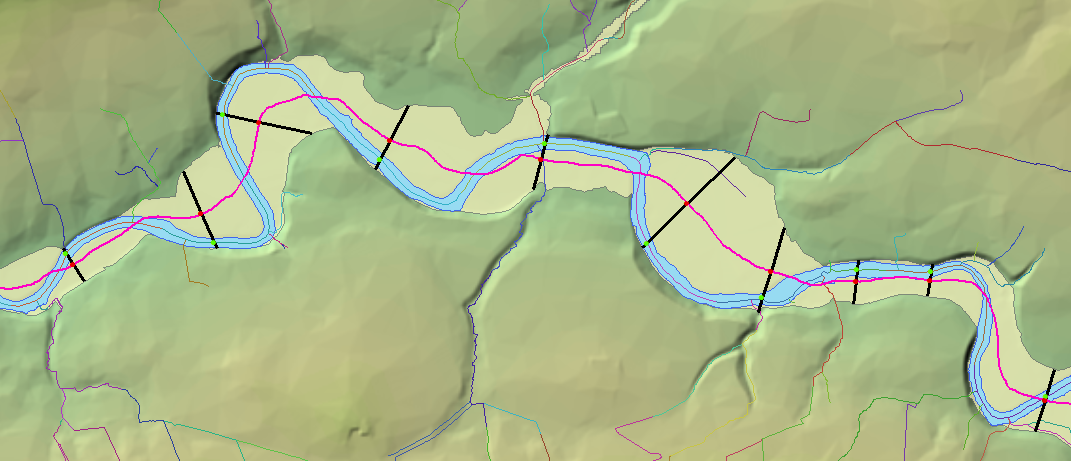
If I zoom into some random part of the Derwent, this is all split points:

image

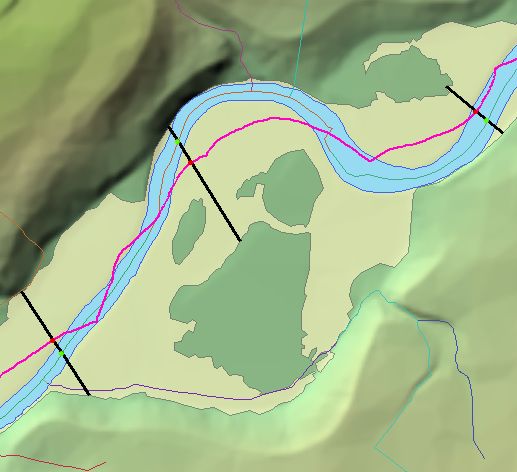
This is the same area with tributary points turned off:

image

So the question is do we segment with just bridges and regular 500m spaced points or do we segment using bridges, regularly spaced points AND tributary junctions?

Documentation for 2.3

  • Home Page

    • [ ]New Version and Release Notes
  • New Project

  • Load Inputs

  • Calculate Margins

  • Confinement Segments

  • Moving Window

  • Integrated Width

  • Method

  • Confinement Calculation Method

  • About project mode

  • Standard Inputs

Flaw in Confinement tool logic identifies stretch as constricted when it is not

The confinement tool is incorrectly identifying stretches of river as CONSTRICTED when it is not, see image below:

image

The flawed code is in the function transfer_line() in the ConfiningMargins.py module.

The problem is that the centroid from the confining margin is selecting the end of the split river centreline as shown by black lines because the centroid is inline with the end node of the confinement margin.

image

Subsequently the SelectLayerByLocation ends up selecting the u/s and d/s split lines attributing one of them with an incorrectly identified Confined value. This ends up cascading down the code and the stretch is given the wrong IsConfined and IsConstrict values.

Create Bridge Intersection Points

@joewheaton and @dsear,

As part of the processing steps to segment a network I need to create a tool that generates the intersection of bridges with the river centre line as a point.

This entry into GitHub is to record that I have constructed the tool. It's a relatively small model:

image

I have created a user friendly interface:

image

  • The logic of the tool is to select OS Topographic Area by DescriptiveGroup = 'Road Or Track,Structure'
  • Intersect selection with river centreline creating a small segment of line
  • Extract mid point of intersection line
  • Add Point ID and Point Type fields
  • Save to new FeatureClass dropping nonessential fields

Limitations:

Requires the user to have an Advanced ArcGIS license because of one of the tools it is using.

Calculating sinuosity

@dsear - OK just wanted to clarify the actual working out of the sinuosity of a segment when compared to the valley centre line. Turns out when I go back to our scribblings, what was clear as day then is now just a jumble of blue lines! :)

Mad minds!

Below are two scenarios that I will have to deal with, the segment in question is highlighted in blue, valley centre line is purple.

Example 1- Segment intersects valley centre line

Example 1

Example 2- Segment never intersects valley centre line

Example 2

Are these examples how you expect sinuosity to computed? I should be able to prototype a tool fairly quickly as a serendipitous outcome of generating routes from a network dataset is that the output is a calibrated Polyline M which means I can hook into the M values embedded in the line for quick and simple calculations.

No Constriction (or confinement!)

Moving window tool should gracefully handle situations where there is no constriction or confinement. This causes the Pivot table to not get generated as expected.

Ideally this should be brought to the attention of the user as this is likely a data issue (there should be at least some constriction/confinement in the watershed.

Segmenting floodplain (to allow other metrics to be computed)

@dsear - So another key processing step is to partition up the floodplain into polygons which can be used to aid in computing other metrics (e.g. the land cover).

Below is a screenshot of the available datasets to work with.

Datasets

We discussed creating cross sections across the floodplain that could be used to create polygons that can then be used to "cookie cut" other datasets (e.g. LCM data).

Creating cross sections only makes sense if it is done from the valley centreline (#44). Below are spoofed up examples (black are cross sections built from the valley centreline, red are built from the river centreline).

My initial logic to construct these cross sections is to find the nearest point on the floodzone boundary, hence kinks can be introduced. I have subsequently opted for a slightly different approach as discussed in #44.

Spoofed examples

So questions are:

  • If the valley centreline is used to partition up the floodzone polygons what stepping distance along the centreline should be used? Be aware that this stepping distance WILL NOT align with the segmenting distance of the river centreline.

  • Be aware one or more river segments could/would exist within a floodplain partition polygon, especially if the stepping distance along the valley centreline is larger than the segmenting distance of the river centreline (currently set at 500m + bridge points - see #37 ).

But a bigger problem is how to stop clipping out floodplain tributaries! Below lets say floodplain stepping distance is set to 1Km, you create the cross sections and enclose using the floodzone boundary. The 2 black areas make sense but the third red partition captures a tributary junction with it's own floodplain. How do we stop it going u/s to the very source and include everything u/s?

Problem

One approach is to create boxes as shown below, but this would under estimate for the same scenario.

Box it!

Broken links and expired domain names

Hi,

As there appears to be no contacts page for the confinement tool I have ended up here to report some significant bugs with the website http://confinement.riverscapes.xyz/

I hope someone reads this and can pass it on to the appropriate people who manage this website. I'm working with Joe on a project but he is away at the moment so unable to contact him directly.

First of all the download link for version 2.2.03 (the latest tool) does not work! Takes you to a 404 page. so if you have been wondering why no one is downloading your tool it is probably that!

All the menu links in the top right of the page (riverscapes, rc tool, rc science...etc) are all broken taking you to a domain name page, so I can't navigate your site.

A suggestion would be to add a contacts page but as I am unable to navigate the website may be there is one?

Finally I do not know if the download from the failed link is some sort of prepackaged version of the source code on this site (github)?

Hope this gets to someone fast as I would like to use this tool.

Duncan

channel width

integrated width of channel polygon. channel area/segment length.

Recommend Projects

  • React photo React

    A declarative, efficient, and flexible JavaScript library for building user interfaces.

  • Vue.js photo Vue.js

    🖖 Vue.js is a progressive, incrementally-adoptable JavaScript framework for building UI on the web.

  • Typescript photo Typescript

    TypeScript is a superset of JavaScript that compiles to clean JavaScript output.

  • TensorFlow photo TensorFlow

    An Open Source Machine Learning Framework for Everyone

  • Django photo Django

    The Web framework for perfectionists with deadlines.

  • D3 photo D3

    Bring data to life with SVG, Canvas and HTML. 📊📈🎉

Recommend Topics

  • javascript

    JavaScript (JS) is a lightweight interpreted programming language with first-class functions.

  • web

    Some thing interesting about web. New door for the world.

  • server

    A server is a program made to process requests and deliver data to clients.

  • Machine learning

    Machine learning is a way of modeling and interpreting data that allows a piece of software to respond intelligently.

  • Game

    Some thing interesting about game, make everyone happy.

Recommend Org

  • Facebook photo Facebook

    We are working to build community through open source technology. NB: members must have two-factor auth.

  • Microsoft photo Microsoft

    Open source projects and samples from Microsoft.

  • Google photo Google

    Google ❤️ Open Source for everyone.

  • D3 photo D3

    Data-Driven Documents codes.