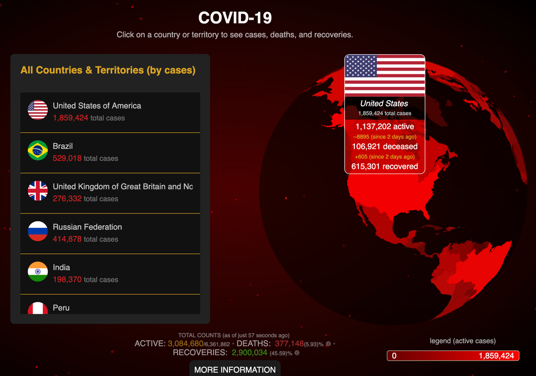
An interactive COVID-19 (coronavirus) visualizer that highlights countries around the world based on the most recent cases.
Visit theworldcovid19.info see if you like it!
These instructions will get you a copy of the project up and running on your local machine for development and testing purposes. See deployment for notes on how to deploy the project on a live system.
Create your own AWS account, install and configure AWS CLI on your system.
Clone this repository to your local file system then run command as below.
npm install
Run command as below to launch a server for Serverless API at port 3000 and a website at port 4000.
npm run start
This project's tests covered by cypress.
npm run test
For releasing static assets:
npm run build_frontend
Deploy Serverless application and static assets:
npm run build_and_deploy
Visualize size of webpack output files with an interactive zoomable treemap.
npm run analysis_bundle
- Serverless - The Serverless framework used to manage AWS
- cypress - End to End test framework
- AMCHARTS - Used to render chart UI
- TypeScript - a typed superset of JavaScript that compiles to plain JavaScript
- Webpack - Used to bundle assets
- Ricky Jiang - Initial work - LinkedIn
I referred the UI from covidvisualizer. The goal of this project is practicing a complex chart UI with Serverless technology
![dependabot[bot] avatar](https://avatars.githubusercontent.com/in/29110?v=4 "dependabot[bot]")
