The purpose of this project is to address several questions from the DataScience-TakeHomeAssignment-FunctionEstimation that I received as part of the data science recruitment process.
For detailed code and functionality pleas see main.py and utils.py
There is an unknown continuous function, denoted by
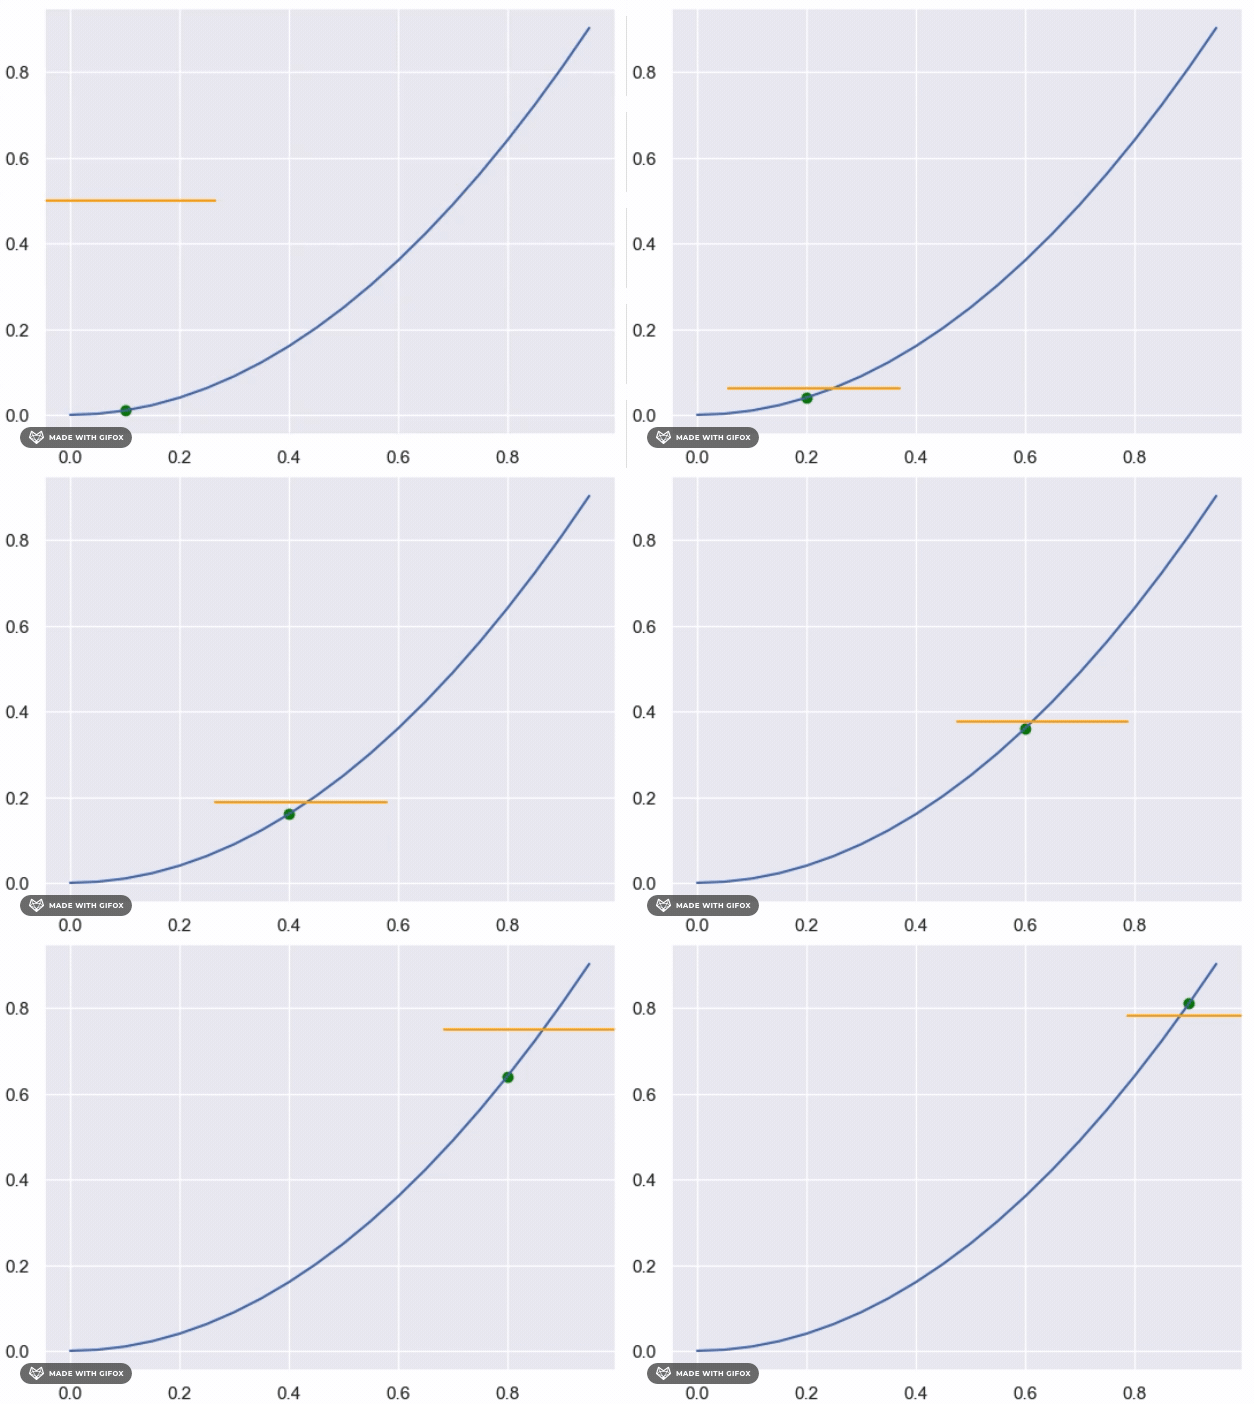
There is also a function called check_if_below, which for each combination of x and y, returns False if the point is above the function and True if it's below the function.
Your task is to estimate the area under this function.
For example, if the function is
Note: The following functions are of the form
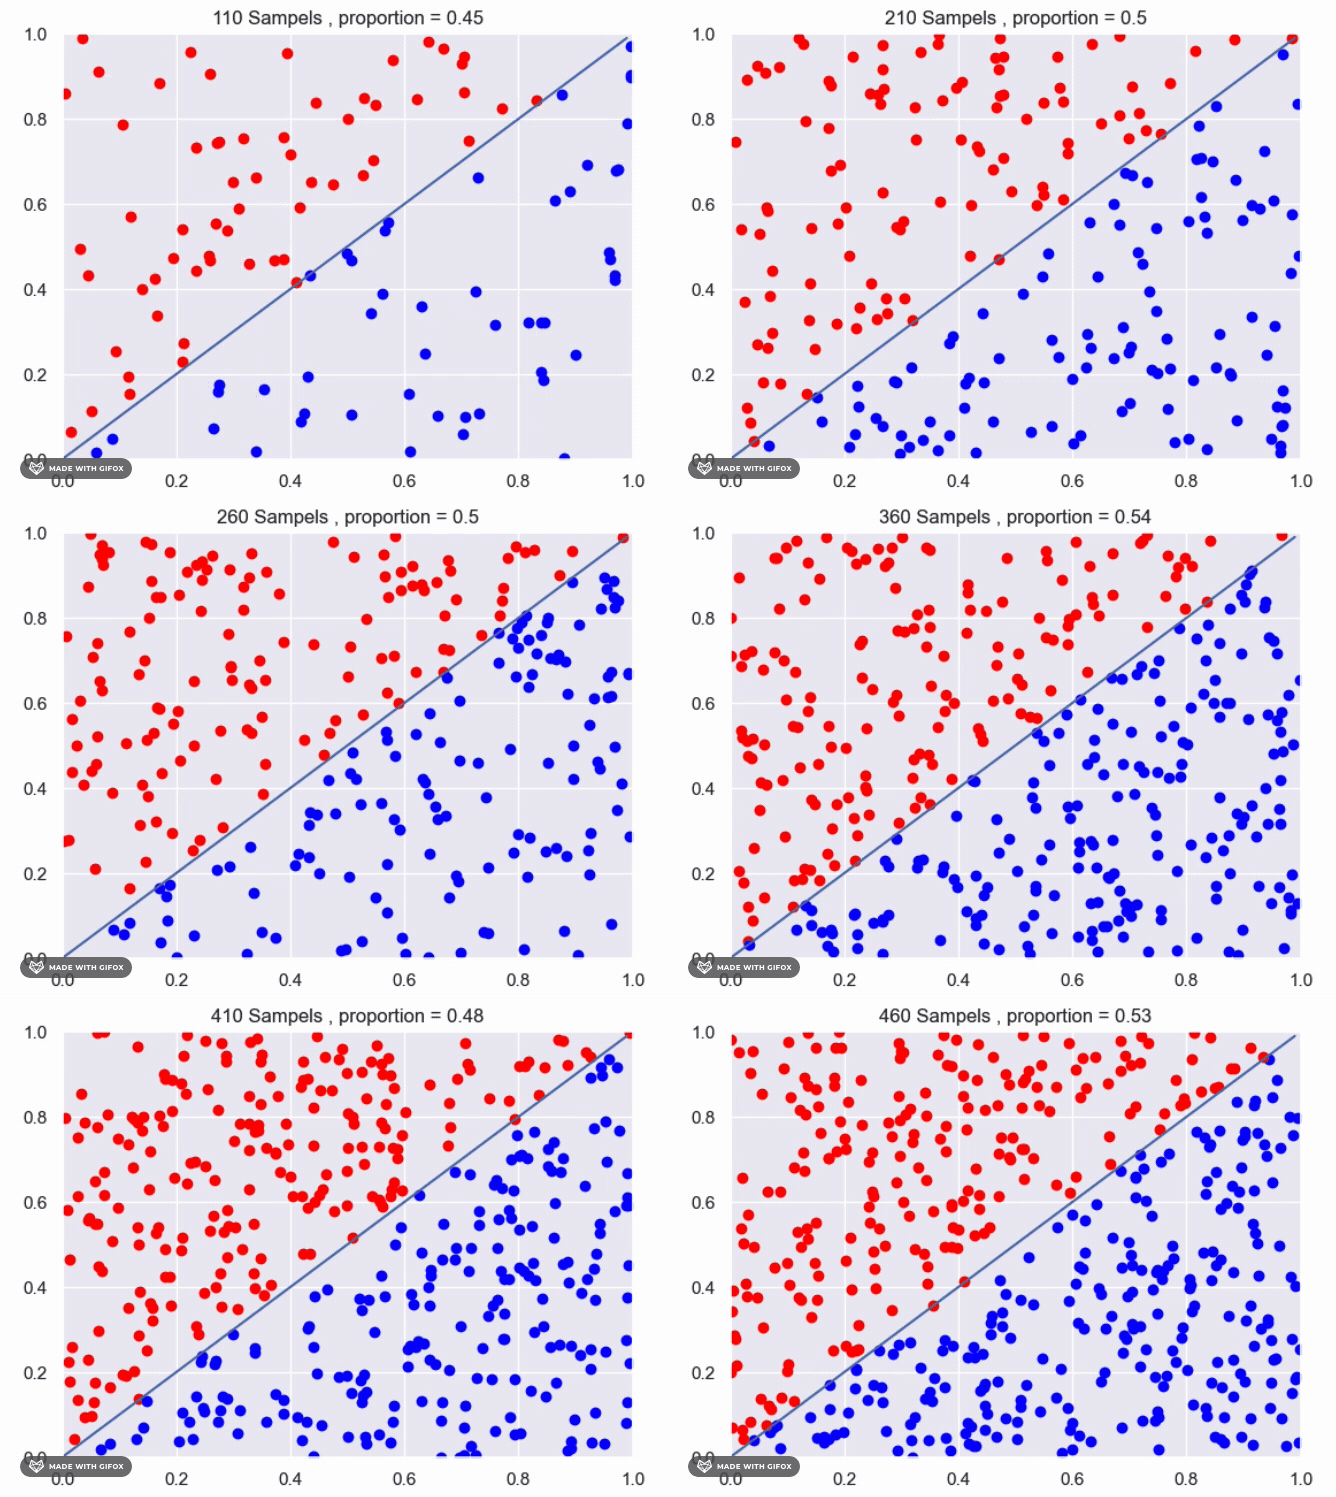
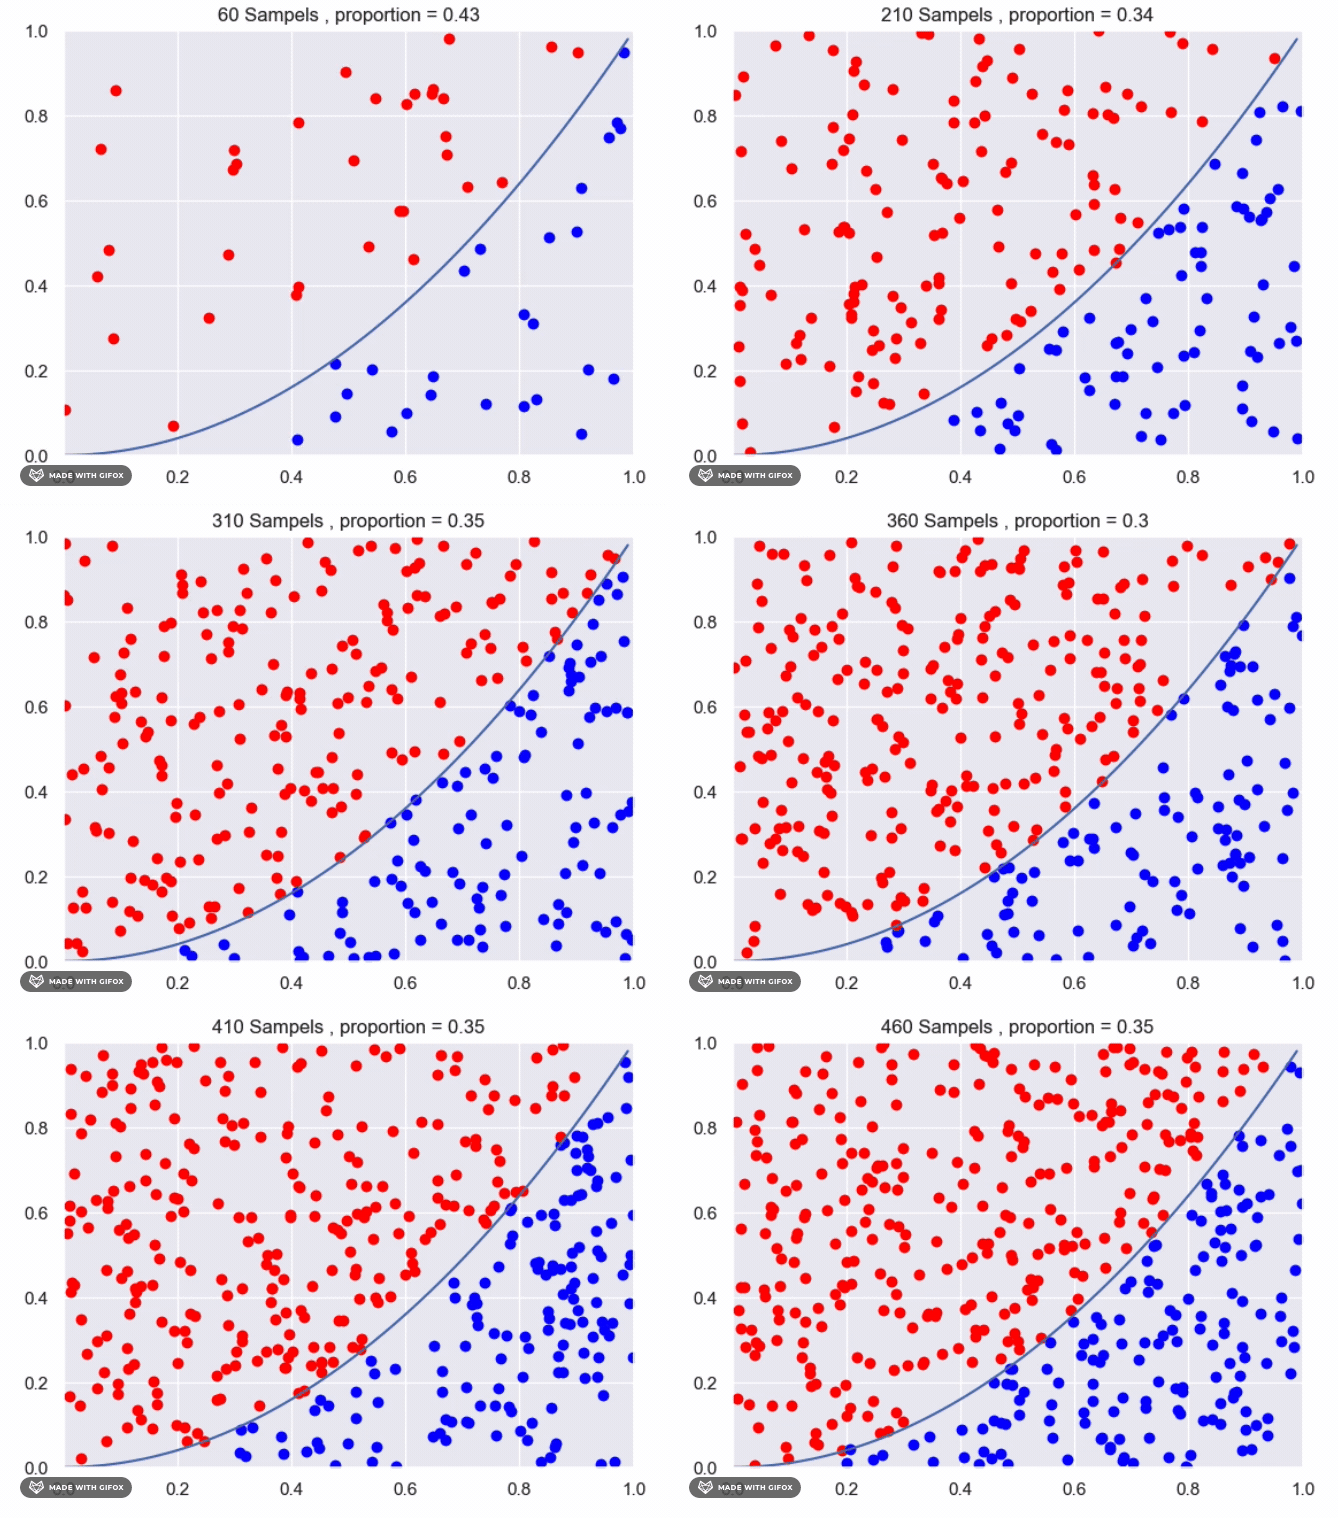
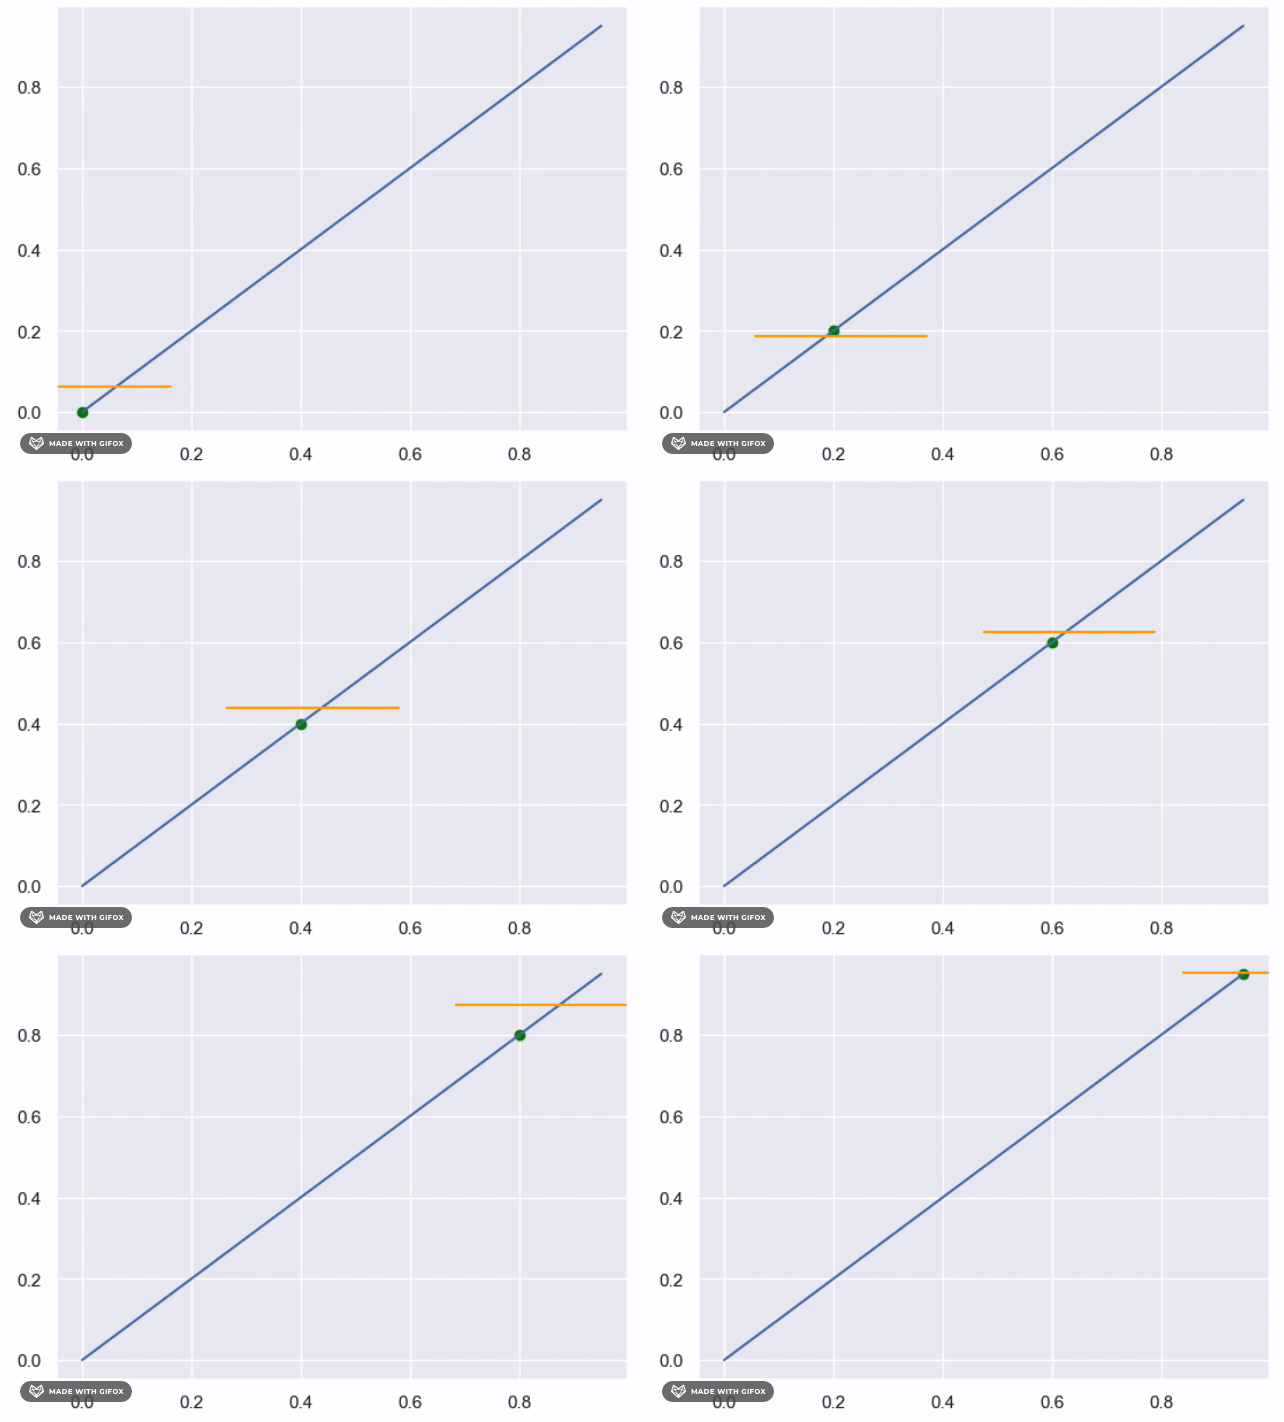
The maximum area under the unknown function is one, which allows us to use sampling to estimate the proportion of points that evaluate to True. The following steps can be taken: Generate n points from a uniform distribution (0,1) For each point, determine whether it falls above or below the unknown function Calculate the proportion of points that fall under the function
for f(x)=x:
for f(x)=x^2:
It appears that we are getting close to the real value using the current method. However, we can improve the accuracy by increasing the number of sampled points or by averaging the results of multiple experiments with the same number of samples. Increasing the number of samples will provide a more accurate estimate of the proportion of points that fall under the function. The more samples we take, the closer the estimate will be to the true value. Averaging the results of multiple experiments can also improve the accuracy of the estimate. By conducting multiple experiments with the same number of samples and averaging the results, we can reduce the impact of any individual experiment that may have deviated from the expected value. This can provide a more reliable estimate of the proportion of points that fall under the function.
After presenting the Monte Carlo simulation, a follow-up question was asked: "Can we make any statements about the estimated area and the real value"
Yes, after presenting the Monte Carlo simulation, we can make statements about the estimated area and the real value.
We can use statistical methods to build a confidence interval for the proportion of points that fall under the function,
with respect to a chosen error probability
For example, if we use a 95% confidence interval, we can say that we are 95% confident that the true proportion of points that fall under the function falls within the interval. This provides a measure of the uncertainty in our estimate, and allows us to make statements about the likely range of values for the true area.
It's important to note that the width of the confidence interval will depend on the number of samples used in the simulation, as well as the complexity of the function being estimated. In general, a larger number of samples will result in a narrower confidence interval and a more accurate estimate of the true area.
Solution (2) - Binary search
With stochastic methods, such as the Monte Carlo simulation mentioned above,
the estimated area changes for different iterations with the same predefined parameters.
This is because the process involves generating random samples to estimate the area.
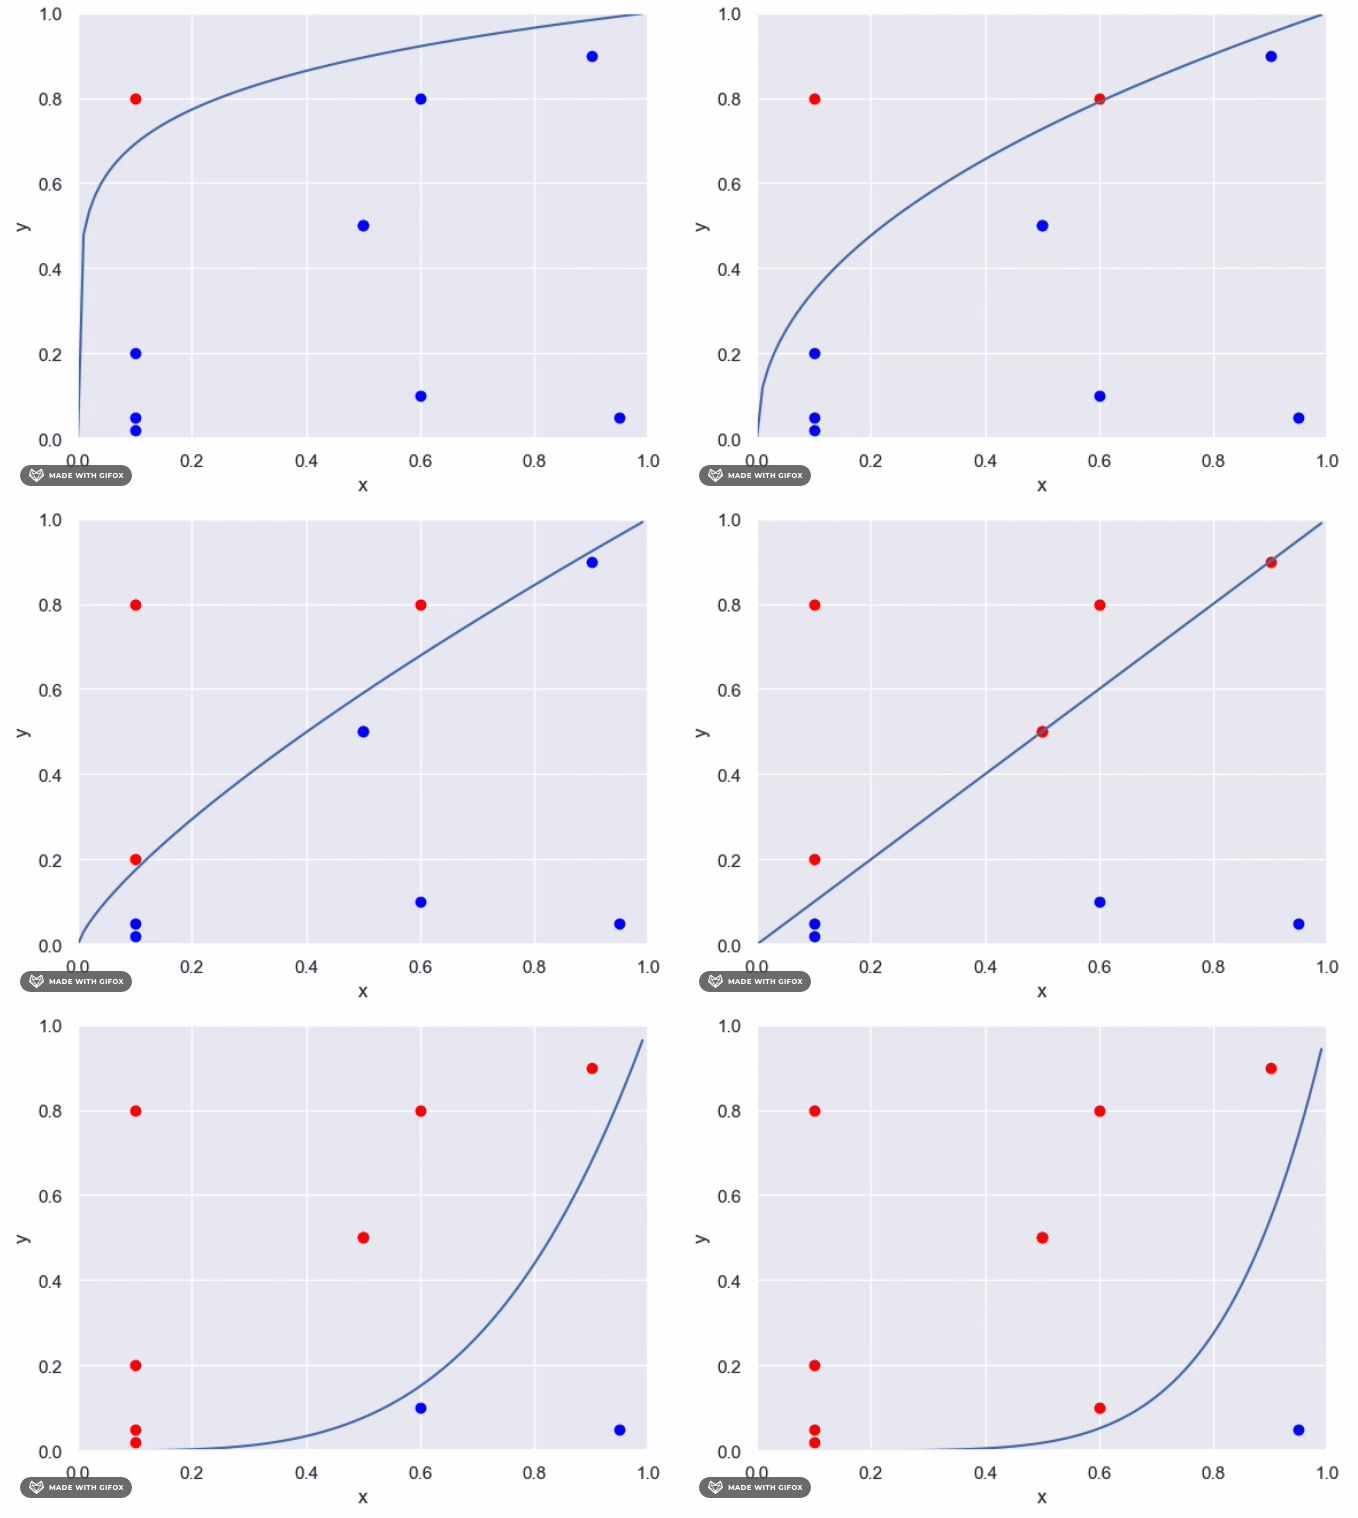
However, if we want to use determenistic method as binary search to find the y values for each x that are close
enough to the real value, we can do so by defining a function that takes a value of x as input and returns the
corresponding y value that satisfies the condition (i.e., falls below the unknown function).
We can start by setting the initial lower and upper bounds of the search interval to 0 and 1, respectively, and iteratively narrow down the interval until we reach the desired level of precision.
Here we will define some distance
def find_y_value(x,func,epsilon,lower_bound = 0, upper_bound =1):
    while True:
        mid_point = (lower_bound + upper_bound) / 2
        if check_if_below(x, mid_point,func = func):
            if upper_bound - mid_point < epsilon:
                return mid_point
            lower_bound = mid_point
        else:
            if mid_point - lower_bound < epsilon:
                return mid_point
            upper_bound = mid_point
In this function, we start by setting the initial interval bounds to 0 and 1, and then we enter a while loop that iteratively narrows down the interval until we reach the desired level of precision (in this case, 0.0001). At each iteration, we calculate the midpoint of the current interval and check if the corresponding point (x, midpoint) falls below the unknown function. If it does, we update the lower bound of the interval to the midpoint; otherwise, we update the upper bound. We continue this process until the interval is narrow enough to satisfy the desired level of precision, at which point we return the midpoint as the estimated y value for the given x value. Note that this approach assumes that the function is continuous and that the area under the curve exists. If these conditions do not hold, the binary search approach may not be appropriate or may not converge to a satisfactory solution.
What is the complexity of the above ?
- Each iteration the search rang reduced by 0.5 (first (0,1) then (0.5,1) or (0,0.5) etc, so after n iteration, the the search range is
$0.5^n$ - Then stop rule is continue search till the search range is smaller then
$\epsilon$ - So
$0.5^n >= \epsilon \rightarrow n = log_{0.5}(\epsilon)$
Summary In this section, we have discussed two techniques for classic function estimation: deterministic and stochastic. Deterministic methods involve mathematical equations that directly relate input variables to output variables, allowing for precise and exact estimates of a function's behavior. However, deterministic methods may not work well for complex functions or data sets with a high degree of variability. On the other hand, stochastic methods rely on generating random samples of input variables and using them to estimate the function's behavior. One popular example of stochastic methods is the Monte Carlo simulation. While stochastic methods may not provide exact estimates, they can be useful for complex functions or data sets with high variability, as they account for uncertainties in the data. Function estimation is a crucial part of the data science world, as it is used in a wide range of applications such as churn analysis, animal picture recognition, signal behavior, and more. Understanding the main concepts of function estimation is essential before diving into advanced techniques. It is also important to note that choosing the right method depends on the problem at hand, and one method may not work well for all situations. A data scientist should have a good understanding of both deterministic and stochastic methods and when to apply each one to achieve the best results.
Code Structure Please note that the code for this project is not written in classes as is typically done. Instead, the code is organized in a procedural manner for simplicity and ease of understanding.

