 IATK: Immersive Analytics Toolkit is a Unity project to help you build high quality, interactive and scalable data visualisations in Immersive Environments (Virtual/Augmented Reality). Use the Visualisation script to create data visualisations interactively in the editor, press play and view and interact with your data in VR/AR. Write simple code to use the IATK core graphics components to make your own interactive visualisations programitcally.
IATK is an ongoing and open project! We setup a roadmap with features that we would like to see in IATK in a near future.
IATK was published at IEEE VR 2019 - Please reference using the reference file or the reference below:
@inproceedings{cordeil2019iatk,
title={IATK: An Immersive Analytics Toolkit},
author={Cordeil, Maxime and Cunningham, Andrew and Bach, Benjamin and Hurter, Christophe and Thomas, Bruce H and Marriott, Kim and Dwyer, Tim},
booktitle={2019 IEEE Conference on Virtual Reality and 3D User Interfaces (VR)},
pages={200--209},
year={2019},
organization={IEEE} }
- This repository
- Unity 2021.3.4f1
- MapBox Unity Plugin v2.1.1
- A MapBox account and access token are not required unless working directly with map visualisations
- Only the main package is required

A video tutorial of IATK can be found here The actual tutorial starts at 01:12
IATK works on Windows machines - Mac users please install bootcamp
Setup a VR scene with the Oculus Rift in Unity: https://www.youtube.com/watch?v=psPVNddjgGw
Setup a VR scene with the HTC Vive in Unity: https://www.youtube.com/watch?v=tyFV9oBReqg
Our repository contains sample datasets. Come with your CSV data to the tutorial if you want to give it a go!
A written tutorial explaining how to setup Unity and get an example scene working with a VR interactable visualisaiton can be found here: VR_TUTORIAL.md
First, create a Data Source object (right click in the hierarchy, IATK/DataSouce). Drag and drop a CSV/TSV in the Data field. Your data is now imported into the Unity scene!
IATK has a number of predefined, controlable data visualisation templates that are accessible directly in the editor. The Visualisation object allows you to access those templates.
Create a Visualisation object (right click in the hierarchy, IATK/Visualisation). Drag and drop a Data Source object in the Data Source field of the Visualisation object. You are now ready to design a data visualisation with the following templates:

To create a pre-configured VR Visualisation object: right click in the hierarchy, IATK/VR Visualisation. Drag and drop a Data Source object in the Data Source field of the VR Visualisation object. VR Visulisations use VRTK v4 Tilia packages and support any OpenXR compatible headset, including Oculus Quest, Oculus Quest 2, Microsoft HoloLens, and Valve Index.
Please note that VR Visualisations are currently only configured to work with scatterplot visulisations, other visulisation types will need to be manually configured.

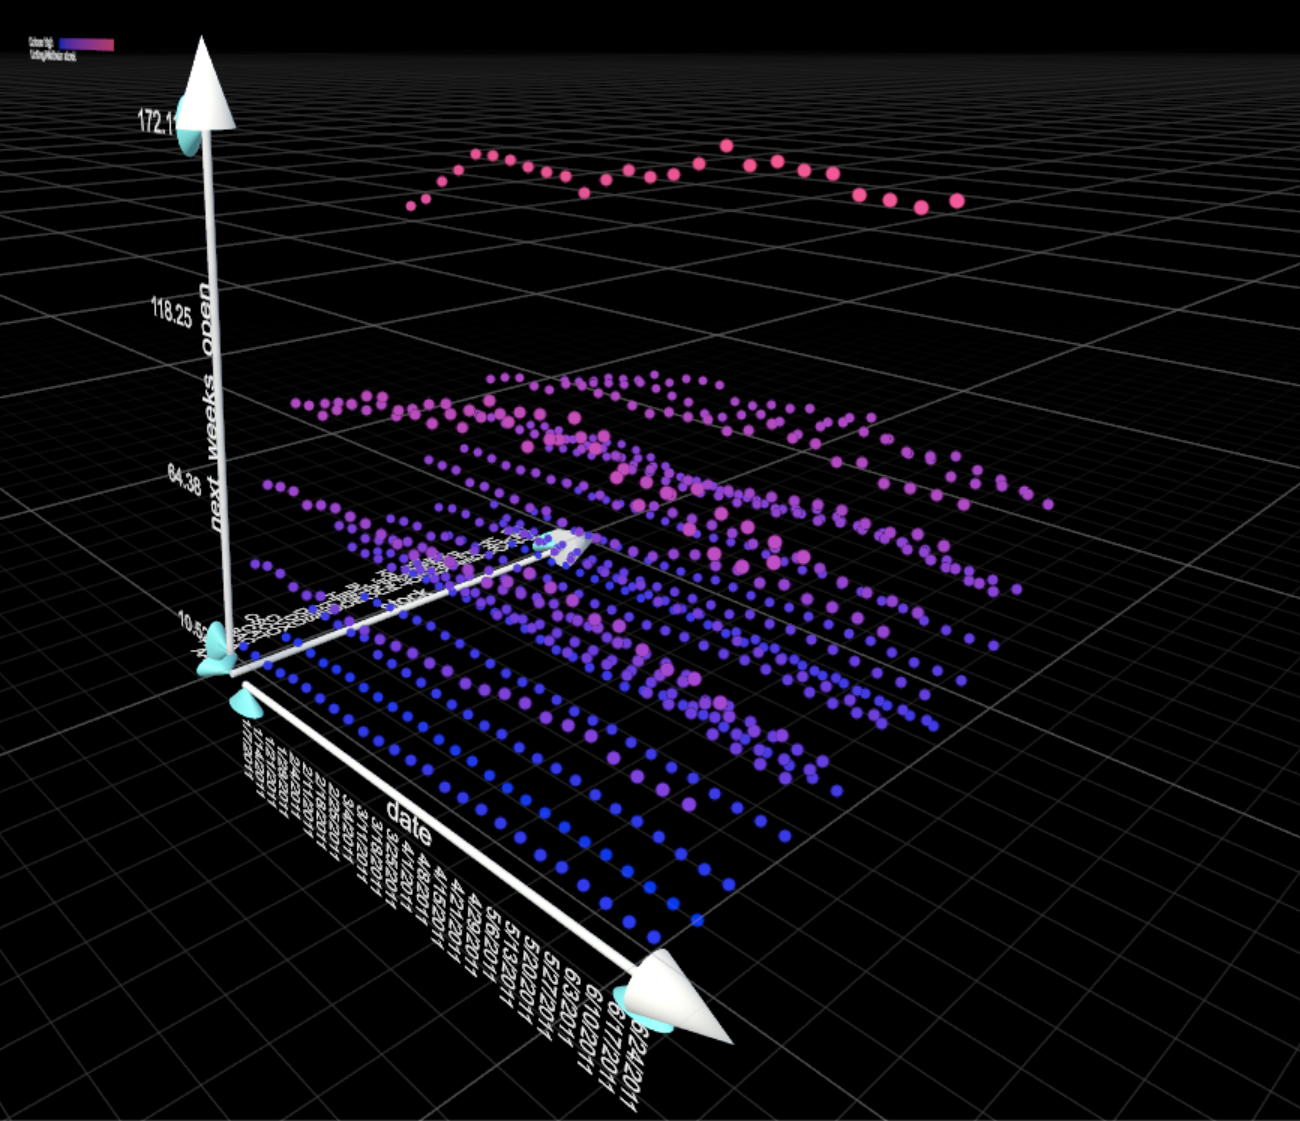


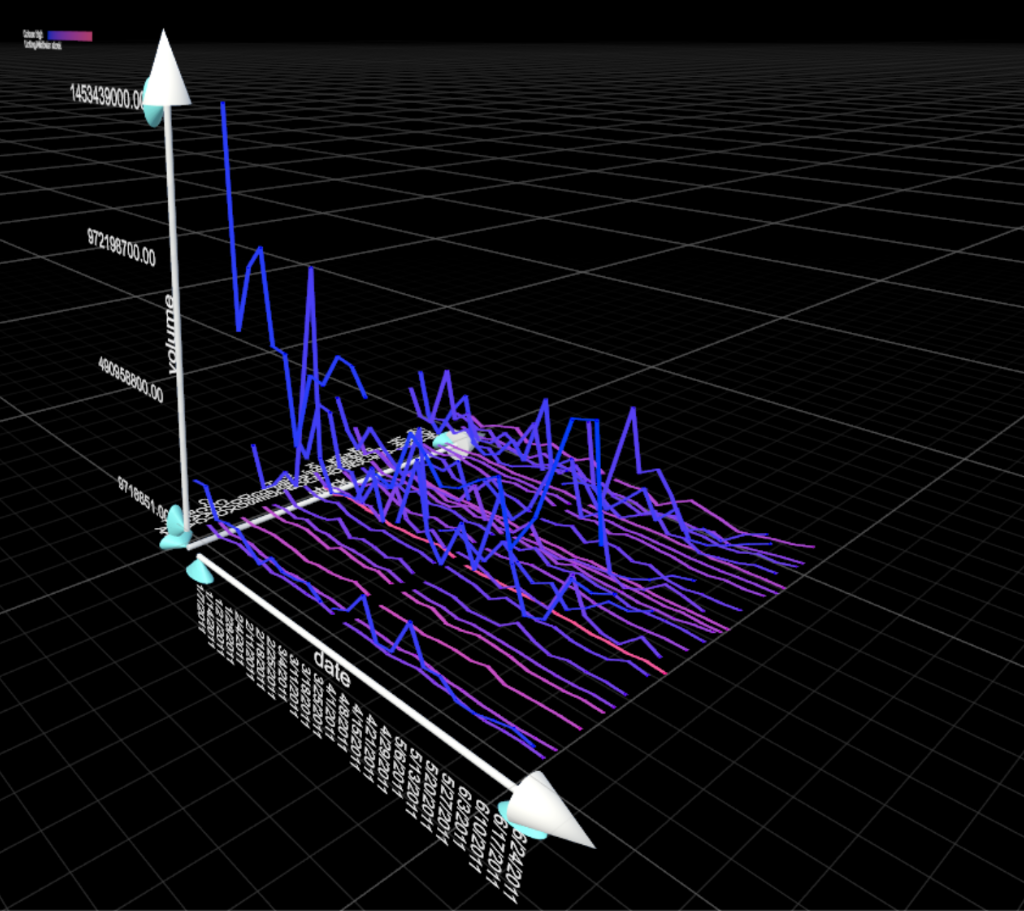


 The visualisation component allows the design of the visualisation inside the Unity Editor. Visual variables can be attached to data dimension attributes.
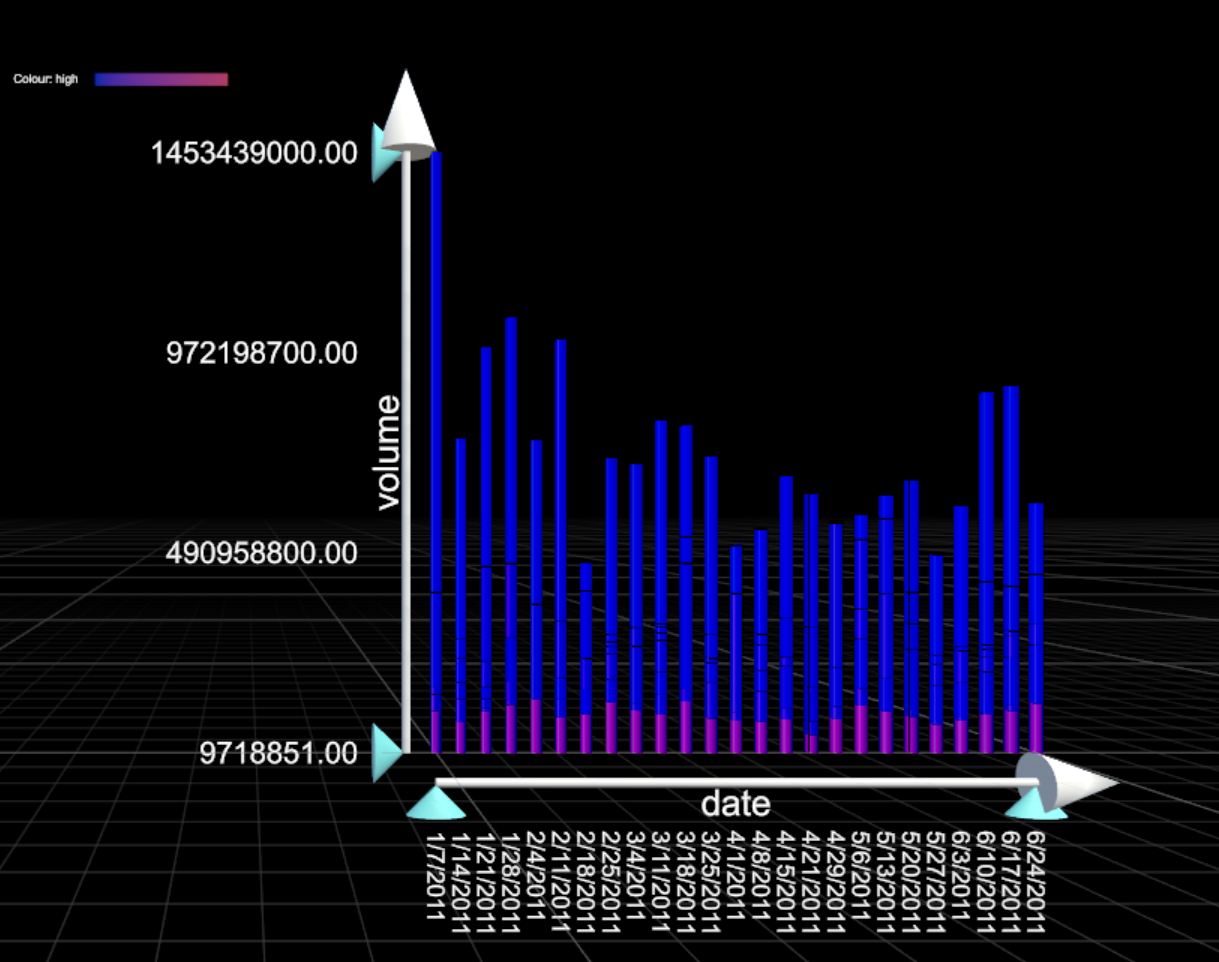
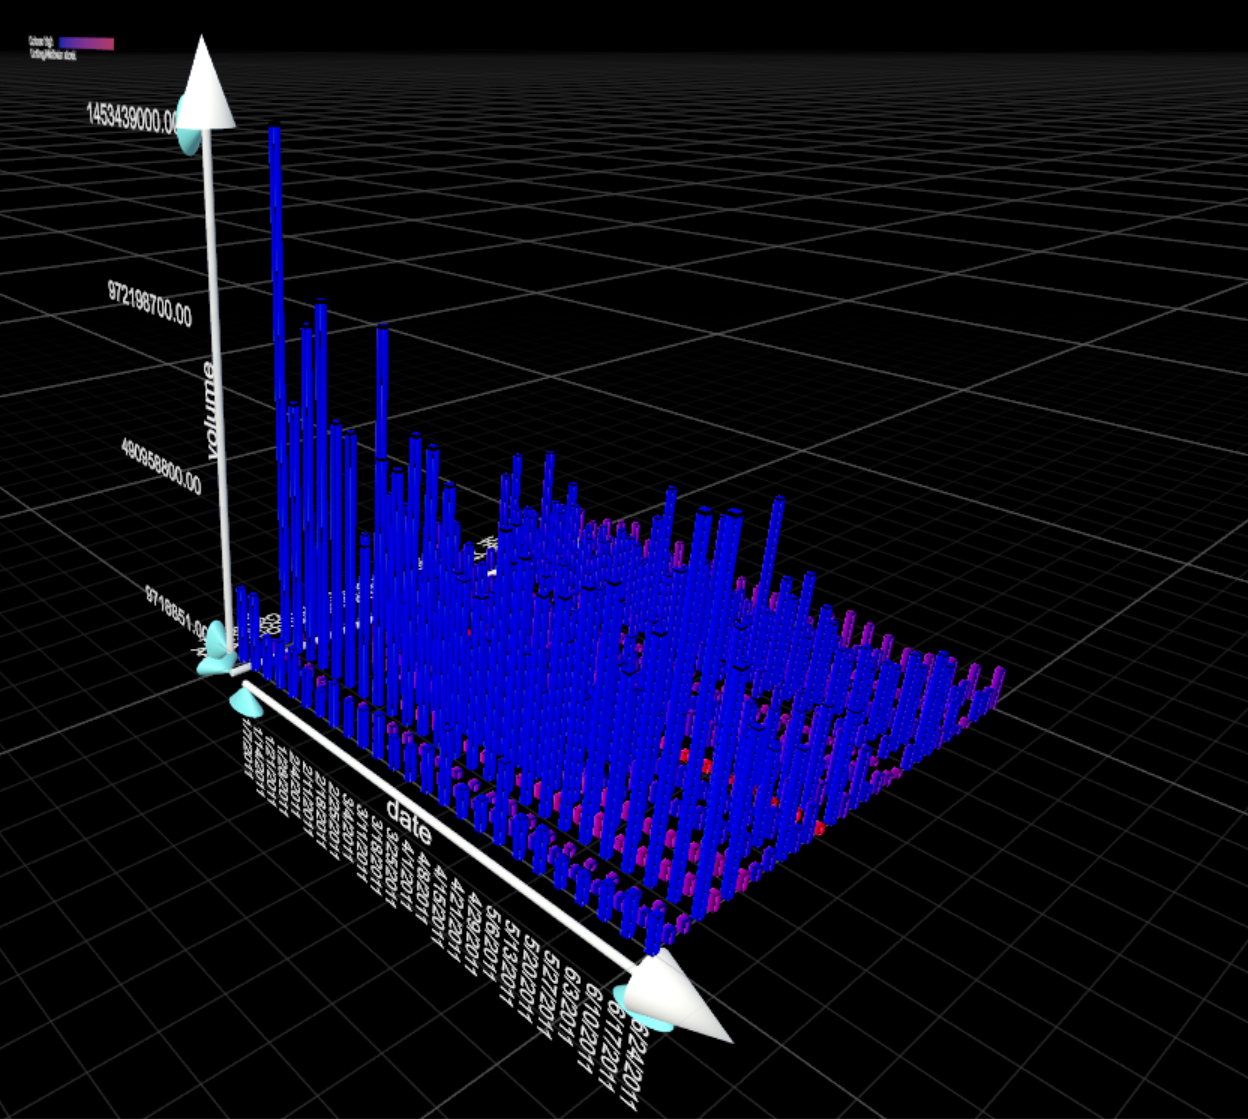
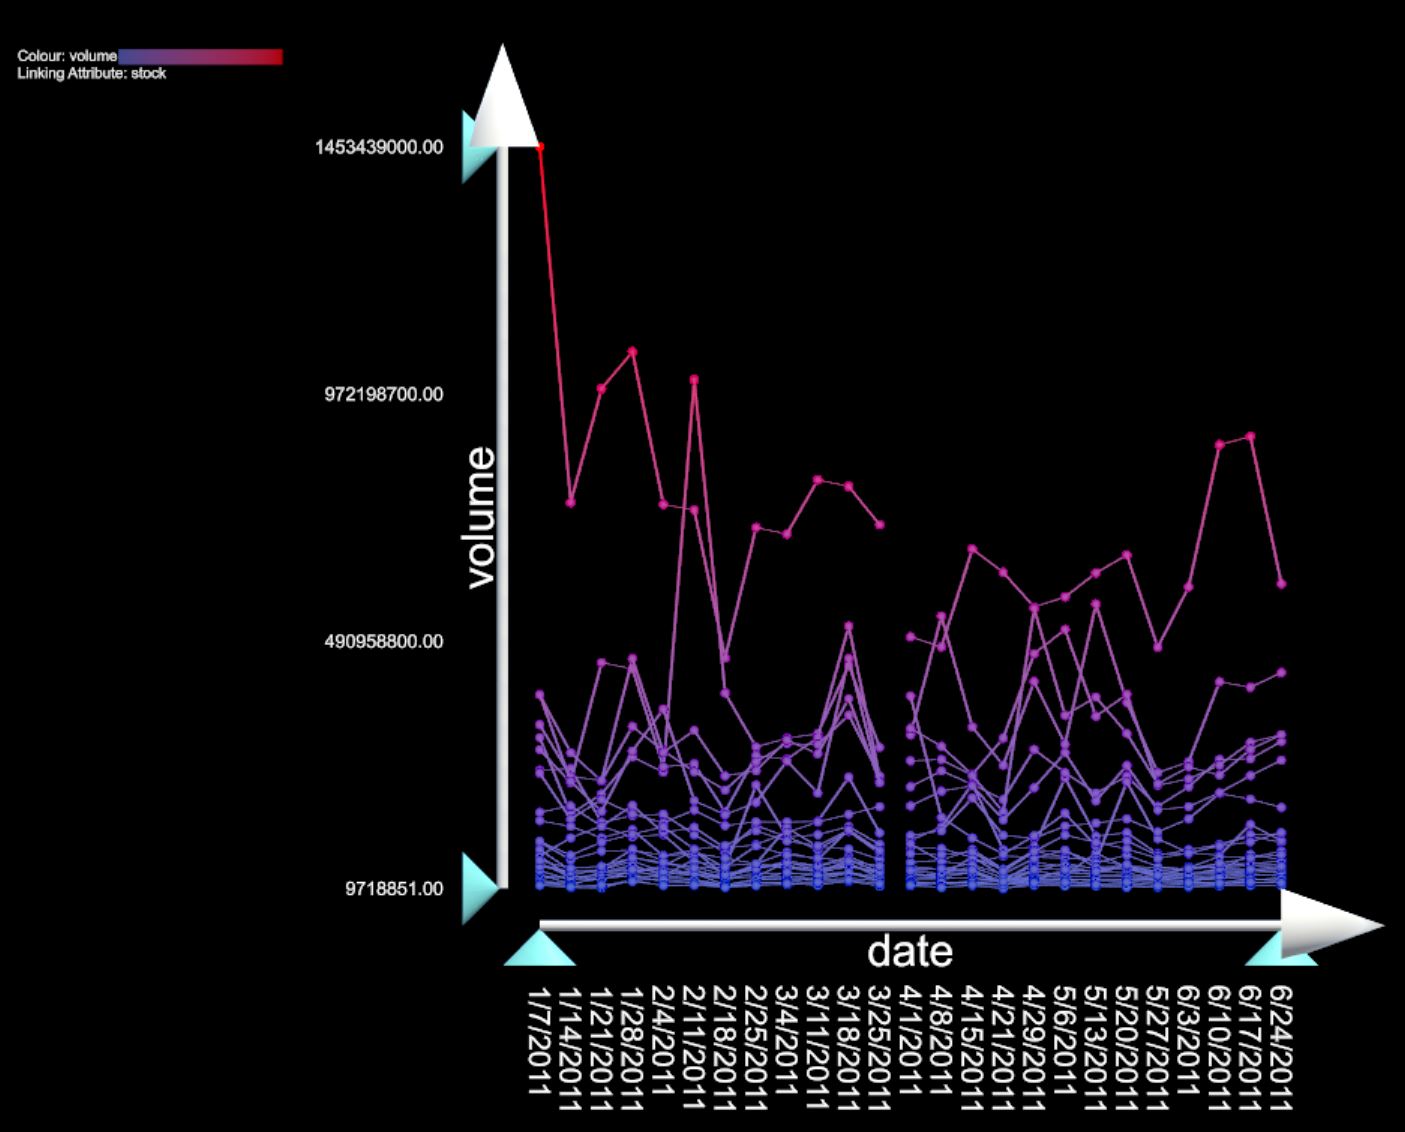
- Geometry: defines the geometry of the visualisation. Points, Quads, Bars and Cubes are a single point topology. Lines and Connected Lines and Dots are a line topology and they require you to specify a Linking dimension (see below)
- Colour dimension: use the dropdown to bind a data attribute to a continuous colour gradient. Click the Colour gradient to edit it.
- Bind Colour palette: use the dropdown to bind a discrete data attribute to a discrete colour palette. Click the corresponding colour values to edit the palette.
- Blending Mode Source, Destination: lets you specify the blending mode. By default it's set to SrcAlpha,OneMinusSrcAlpha that allows for traditional blending with transparency. Use One,One to do visual accumation effects.
- Colour: if Colour dimension and Bind Coolour palette are Undefined, sets the same colour to all the glyphs.
- Size dimension: use the dropdown to bind an attribute to the size of the glyphs. The Size slider sets the global size, the Min/Max Size slider sets the scale.
- Linking dimension: use the dropdown to link datapoints by id. /!\ It requires that your data is ordered in sequence in the CSV source
- Attribute Filters: type in an attribute name and use filters to filter ranges of values. This is an additional visual query facility.

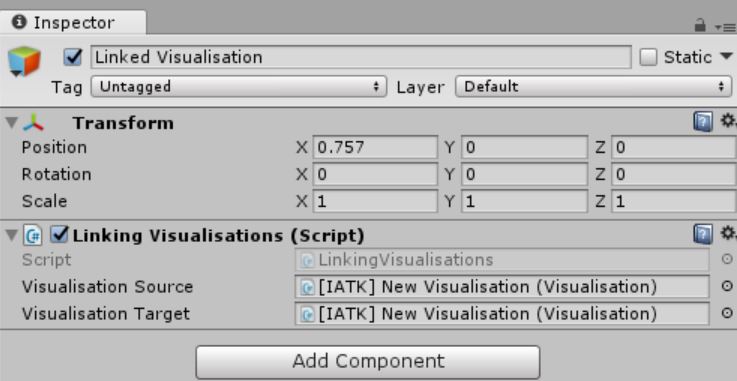
Create visual links between two visualisations (right click IATK>LinkedVisualisation). Drag and drop two visualisations objects (source,target) into the Linked Visualisation component. Set the ShowLinks (true/false) variable to show/hide the links between the 2 visualisations.
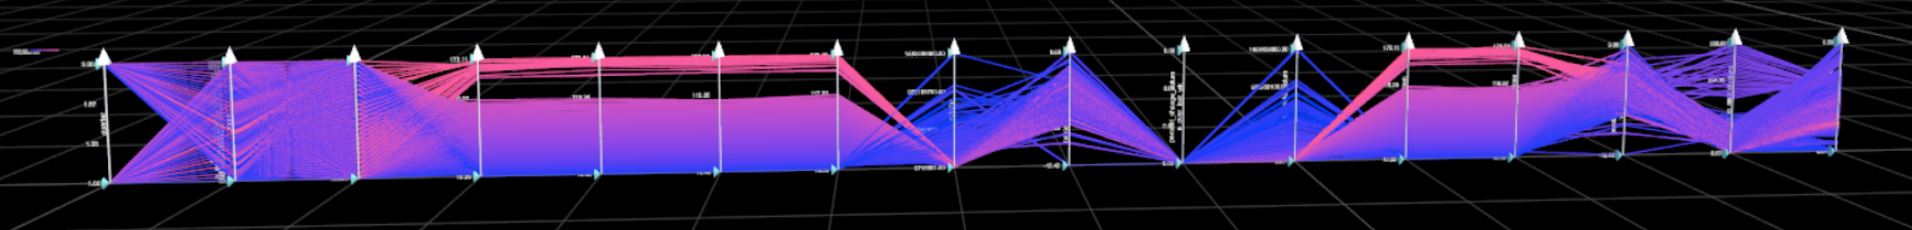
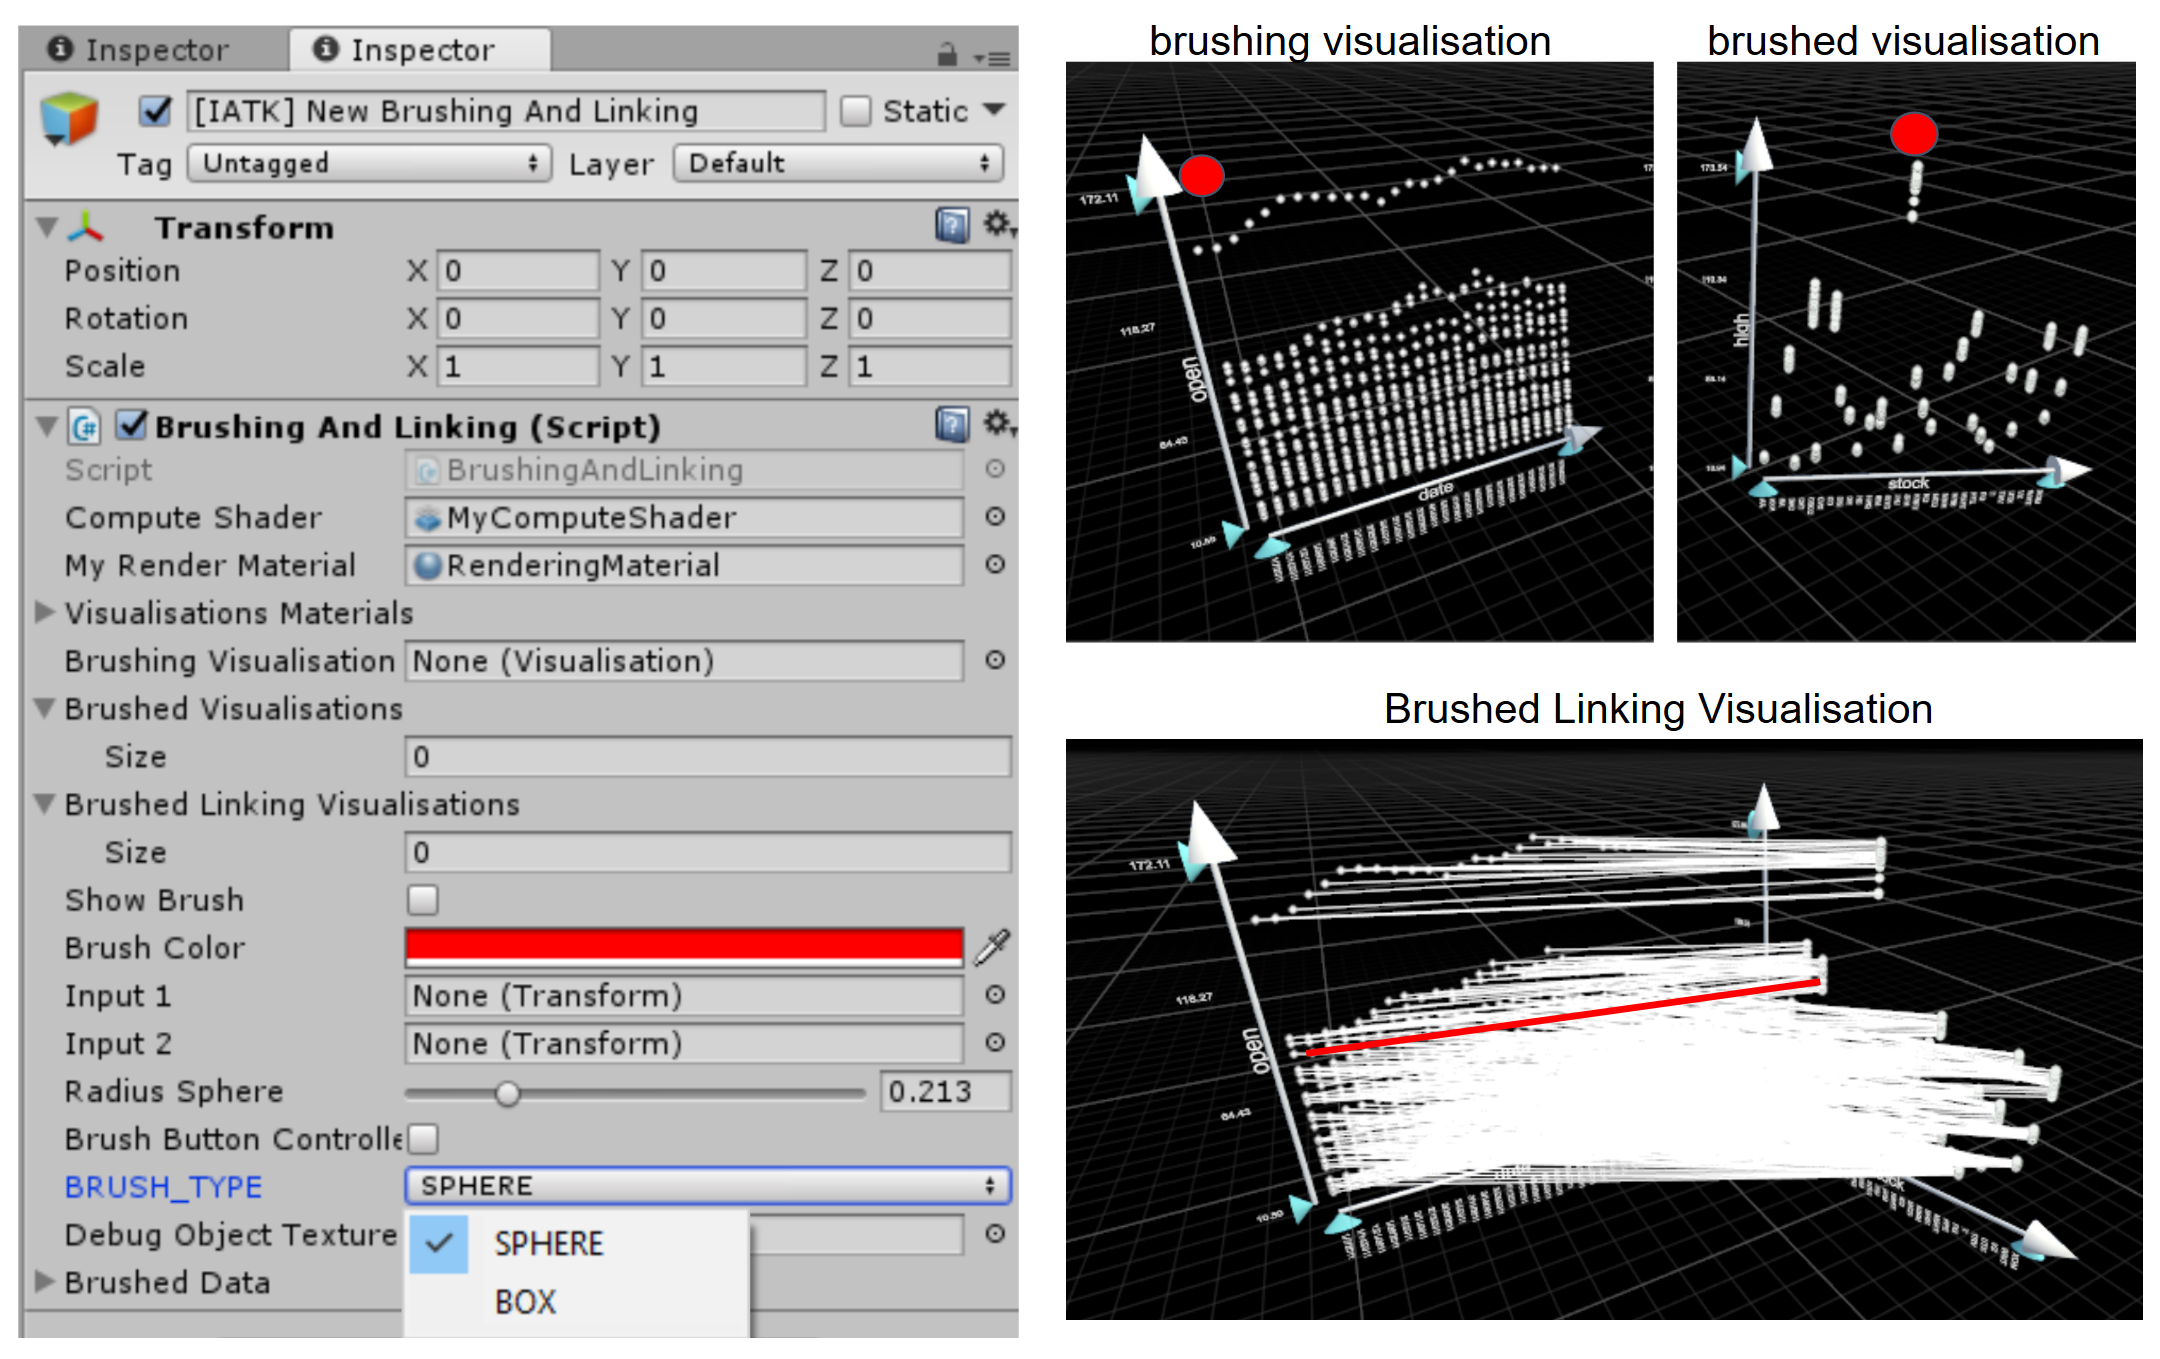 It is easy to setup brushing and linking visualisations with IATK. First create a BrushingAndLinking object (right click in hierarchy, IATK>Brushing And Linking).
You now have to drag and drop a Visualisation object that will act as the brush controller: the Brushing Visualisation. Then drag and drop how many visualisations you wish to link to this brushing visualisation in the Brushed Visualisations list. You can also attach a Linked Visualisation object to show highlights of the brushed data. The visual elements brushed (by attaching Transforms into Input1 and Input2) in the Brushing Visualisation will be highlighted in the Brushed Visualisations and the Brushed Linked Visualisations.
It is easy to setup brushing and linking visualisations with IATK. First create a BrushingAndLinking object (right click in hierarchy, IATK>Brushing And Linking).
You now have to drag and drop a Visualisation object that will act as the brush controller: the Brushing Visualisation. Then drag and drop how many visualisations you wish to link to this brushing visualisation in the Brushed Visualisations list. You can also attach a Linked Visualisation object to show highlights of the brushed data. The visual elements brushed (by attaching Transforms into Input1 and Input2) in the Brushing Visualisation will be highlighted in the Brushed Visualisations and the Brushed Linked Visualisations.
The DataSource object is the starting point of your immersive data visualisation project. It allows you to import your text data into Unity and has a set of methods to access the data by attribute, id etc. Further details (methods, properties) are available in the documention [to come].
Usage:
// Use Unity Text assets to import text data (e.g. csv, tsv etc.)
TextAsset myDataSource;
CSVDataSource myCSVDataSource;
myCSVDataSource = createCSVDataSource(myDataSource.text);

// A reusable method to create an IATK CSVDataSource object.
CSVDataSource createCSVDataSource(string data) {
CSVDataSource dataSource;
dataSource = gameObject.AddComponent<CSVDataSource>();
dataSource.load(data, null);
return dataSource;
}IATK uses a fluent design pattern that lets you chain commands to design a visualisation in a single instruction. Example in the Scripting section
Once you have built a View object with the Viewbuilder, you can change the view attributes (colours, positions, sizes, filters ...) . See documentation [to come].
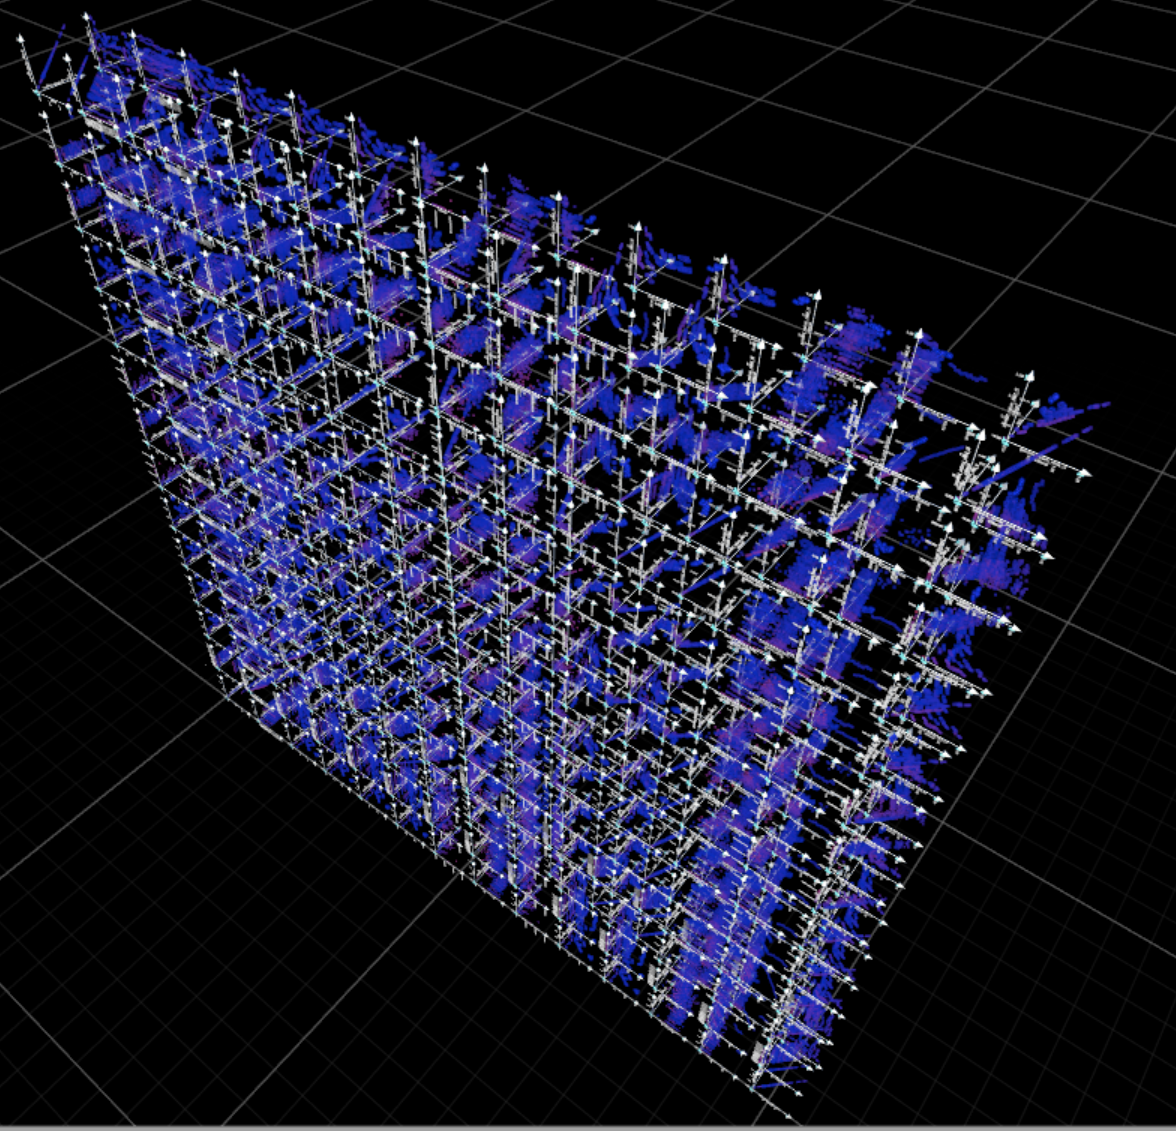
The toolkit contains facilities to create high quality graphics dsigned for data visualisation in Virtual and Augmented Reality. The IATK core graphics tools include:
- A BigMesh script that allows the creation of visualisations
- Several shaders to render a lot of data rapidly and efficiently, and custom graphics for data visualisations (thick lines, dots/spheres, cubes/bars)
- A selection tool (brushing) that enables the selection of data accross several data visualizations.
Example of building a visualisation from code. The ViewBuilder class allows the design of the visualisation. When applying (i.e. using the .apply(GameObject go, Material) method) the ViewBuilder returns a View. The View object can then be later updated (e.g. set positions, colors, etc...).
// Create a view builder with the point topology
ViewBuilder vb = new ViewBuilder (MeshTopology.Points, "Uber pick up point visualisation").
                     initialiseDataView(csvds.DataCount).
                     setDataDimension(csvds["Lat"].Data, ViewBuilder.VIEW_DIMENSION.X).
                     setDataDimension(csvds["Base"].Data, ViewBuilder.VIEW_DIMENSION.Y).
                     setDataDimension(csvds["Lon"].Data, ViewBuilder.VIEW_DIMENSION.Z).
                     setSize(csvds["Base"].Data).
                     setColors(csvds["Time"].Data.Select(x => g.Evaluate(x)).ToArray());

// Use the "IATKUtil" class to get the corresponding Material mt
Material mt = IATKUtil.GetMaterialFromTopology(AbstractVisualisation.GeometryType.Points);
mt.SetFloat("_MinSize", 0.01f);
mt.SetFloat("_MaxSize", 0.05f);

// Create a view builder with the point topology
View view = vb.updateView().apply(gameObject, mt);IATK is a prototype for research and there are known issues that we will fix in the near future.
- Unrecognised symbols in data source can break the scripts
- Scatterplot matrices can be slow due to the amount of points to display (if you have a very large dataset and a lot of dimension, scatetrplot matrices will be slow)
In a near feature we will support:
- Fix number of labels for discrete values (delegate method)
- Details on demand
- 2D/3D graph visualisation (node-link diagrams) directly in the Visualisation editor
- More type of data sources (including real time data)
- More geometry (e.g. surfaces / volumes)
The toolkit is developed by:
- Maxime Cordeil (project leader, University of Queensland)
- Andrew Cunningham (University of South Australia)
- Benjamin Lee (Monash University)
- Daniel Harris (University of South Wales)
Past developpers:
- Kingsley Stephens (Monash University)


