Code Monkey home page Code Monkey logo

statsdaemon's Introduction

Circle CI Go Report Card GoDoc

statsdaemon

Metrics aggregation daemon like statsd, in Go and with a bunch of extra features. (Based on code from Bitly's statsdaemon)

Features you expect:

For a given input, this implementation yields the exact same metrics as etsy's statsd (with deleteIdleStats enabled), (though this is discouraged. See "metric namespacing" below) so it can act as a drop-in replacement. In terms of types:

  • Timing (with optional percentiles, sampling supported)
  • Counters (sampling supported)
  • Gauges
  • No histograms or sets yet, but should be easy to add if you want them

Metrics 2.0

metrics 2.0 is a format for structured, self-describing, standardized metrics.

metrics 2.0 diagram

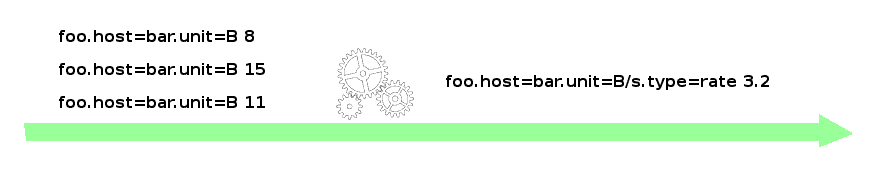
Metrics that flow through statsdaemon and are detected to be in the metrics 2.0 format undergo the same operations and aggregations, but how this is reflected in the resulting metric identifier is different:

  • traditional/legacy metrics get prefixes and suffixes like the original statsd
  • metrics in 2.0 format will have the appropriate adjustments to their tags. Statsdaemon assures that tags such as unit, target_type, stat, etc reflect the performed operation, according to the specification. This allows users and advanced tools such as Graph-Explorer to truly understand metrics and leverage them.

Adaptive sampling

TBA.

You'll love Go

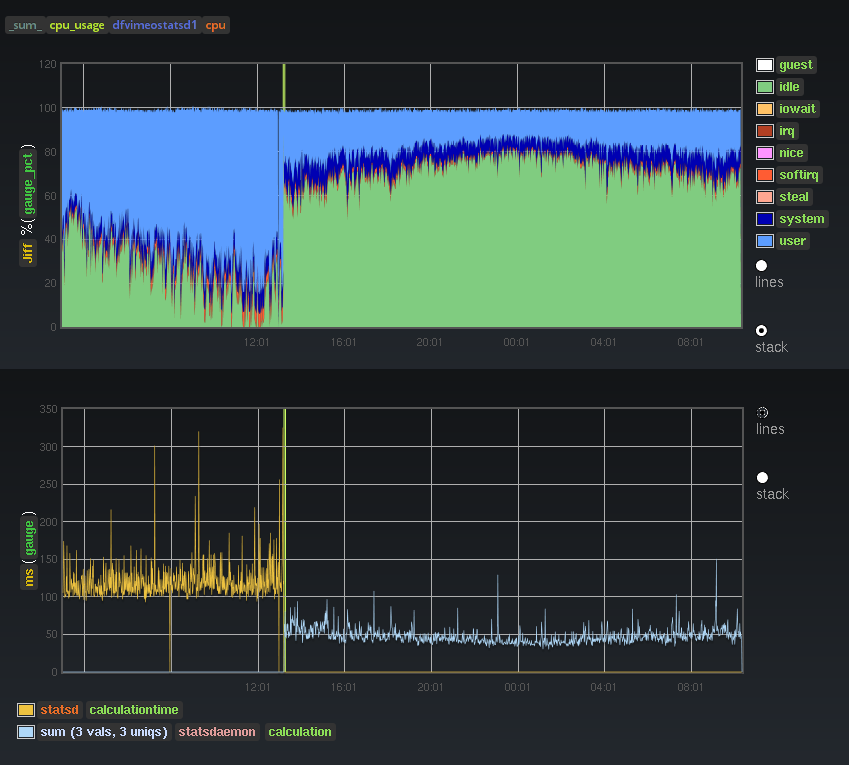
Perhaps debatable and prone to personal opinion, but people seem to agree that Go is more robust, easier to deploy and elegant than node.js. In terms of performance, I didn't do extensive or scientific benchmarking but here's the effect on our cpu usage and calculation time when switching from statsd to statsdaemon, with the same input load and the same things being calculated:

Performance

Performance and profiling

As with any statsd version, you should monitor whether the kernel drops incoming UDP packets. When statsdaemon (or statsd) cannot read packets from the udp socket fast enough - perhaps because it's overloaded with packet processing, or the udp reading is the slowest part of the chain (the case in statsdaemon) - then the udp buffer will grow and ultimately fill up, and have no more room for new packets, which get dropped, resulting in gaps in graphs. With statsdaemon this limit seems to be at around 60k packets per second. You can improve on this by batching multiple metrics into the same packet, and/or sampling more. Statsdaemon exposes a profiling endpoint for pprof, at port 6060 by default (see config).

Admin telnet api

help                             show this menu
sample_rate <metric key>         for given metric, show:
                                 <key> <ideal sample rate> <Pckt/s sent (estim)>
metric_stats                     in the past 10s interval, for every metric show:
                                 <key> <Pckt/s sent (estim)> <Pckt/s received>
peek_valid                       stream all valid lines seen in real time
                                 until you disconnect or can't keep up.
peek_invalid                     stream all invalid lines seen in real time
                                 until you disconnect or can't keep up.
wait_flush                       after the next flush, writes 'flush' and closes connection.
                                 this is convenient to restart statsdaemon
                                 with a minimal loss of data like so:
                                 nc localhost 8126 <<< wait_flush && /sbin/restart statsdaemon

Internal metrics

Statsdaemon submits a bunch of internal performance metrics using itself. Note that these metrics are in the metrics 2.0 format, they look a bit unusual but can be treated as regular graphite metrics if you want to. However using carbon-tagger and Graph-Explorer they become much more useful.

There's also a dashboard for Grafana on Grafana.net

Installing

go get github.com/raintank/statsdaemon/cmd/statsdaemon

Building

we use dep to save the dependencies to the vendor directory.

Command Line Options

Usage of ./statsdaemon:
  -config_file="/etc/statsdaemon.ini": config file location
  -cpuprofile="": write cpu profile to file
  -debug=false: print statistics sent to graphite
  -memprofile="": write memory profile to this file
  -version=false: print version string

Namespacing & Config file options

The default statsd namespace is notoriously messy so we highly recommend disabling the legacy namespace and customizing the prefixes as shown below.

listen_addr = ":8125"
admin_addr = ":8126"
graphite_addr = "127.0.0.1:2003"
flush_interval = 60

legacy_namespace = true
prefix_rates = "stats."
prefix_counters = "stats_counts."
prefix_timers = "stats.timers."
prefix_gauges = "stats.gauges."

# Recommended (legacy_namespace = false)
# counts -> stats.counters.$metric.count
# rates -> stats.counters.$metric.rate

#legacy_namespace = false
#prefix_rates = "stats.counters."
#prefix_counters = "stats.counters."
#prefix_timers = "stats.timers."
#prefix_gauges = "stats.gauges."

# prefixes for metrics2.0 metrics
# using this you can add tags, like "foo=bar.baz=quux."
# note that you should use '=' here.
# If your metrics use the '_is_' style, then we'll automatically apply the converted prefix instead.
prefix_m20_rates = ""
prefix_m20_counters = ""
prefix_m20_timers = ""
prefix_m20_gauges = ""

# send rates for counters (using prefix_rates)
flush_rates = true
# send count for counters (using prefix_counters)
flush_counts = false

percentile_thresholds = "90,75"
max_timers_per_s = 1000

statsdaemon's People

Contributors

amir avatar bbigras avatar ctdk avatar dcosson avatar dieterbe avatar ehlerst avatar jehiah avatar jensrantil avatar mark-stripe avatar mattkanwisher avatar mikedewar avatar mreiferson avatar ploxiln avatar rymo4 avatar ssgelm avatar torkelo avatar woodsaj avatar

Stargazers

 avatar  avatar  avatar  avatar  avatar  avatar  avatar  avatar  avatar  avatar  avatar  avatar  avatar  avatar  avatar  avatar  avatar  avatar  avatar  avatar  avatar  avatar  avatar  avatar  avatar  avatar  avatar  avatar  avatar  avatar  avatar  avatar  avatar  avatar  avatar  avatar  avatar  avatar  avatar  avatar  avatar  avatar  avatar  avatar  avatar  avatar  avatar  avatar  avatar  avatar  avatar  avatar  avatar  avatar  avatar  avatar  avatar  avatar  avatar  avatar  avatar  avatar  avatar  avatar  avatar  avatar  avatar  avatar  avatar  avatar  avatar  avatar  avatar  avatar  avatar  avatar  avatar  avatar  avatar  avatar  avatar  avatar  avatar  avatar  avatar  avatar  avatar  avatar  avatar  avatar  avatar  avatar  avatar  avatar  avatar  avatar  avatar  avatar  avatar  avatar

Watchers

 avatar  avatar  avatar  avatar  avatar  avatar  avatar  avatar  avatar  avatar  avatar  avatar  avatar  avatar  avatar  avatar  avatar  avatar  avatar  avatar  avatar  avatar  avatar  avatar  avatar  avatar  avatar  avatar  avatar  avatar  avatar

statsdaemon's Issues

metrics 2.0

Adding to ini:
prefix_m20_rates = "source=statsd.dc=aws."
prefix_m20_counters = "source=statsd.dc=aws."
prefix_m20_timers = "source=statsd.dc=aws."
prefix_m20_gauges = "source=statsd.dc=aws."

Breaks TOML
Error message:
Could not read config file: /etc/statsdaemon.ini is not a valid TOML file. See https://github.com/mojombo/toml

metrics2.0 _is_ questions for legacy metrics

Some developers may send the word _is_ in their metrics. This causes statsdaemon to drop the metric in legacy graphite to the main tree.

echo "foo-service.38ac60-643107ecbe1f.test.com_amazing_www_foo_serialization_fooRequestXMLSerializer_error_name_FastInfosetException_Input_stream_is_not_a_fast_infoset_document.Count:40978|g" | nc -u -w1 127.0.0.1 8125

2017/01/24 11:12:15 DEBUG: WRITING foo-service.38ac60-643107ecbe1f.test.com_amazing_www_foo_serialization_fooRequestXMLSerializer_error_name_FastInfosetException_Input_stream_is_not_a_fast_infoset_document.Count 40978 1485277935

This should write to stats.gauges or some type of warning. I'm not sure how this would work in an ideal world.

align flush interval with real time interval

flush at the right time so that timestamps match time/10s intervals (i.e. divide by 10 or 60), this way it aligns with graphite and graphite doesn't need to skip part of a period

sometimes metric_stats not correct

input:

  ....advanced_api_call....:1|c|@0.01 

metric_stats:

$ echo metric_stats | nc localhost 8126 | grep advanced_api_call
....advanced_api_call.v.. 0 10
....advanced_api_call....10 10
(...)

packets sent should always be 100 times packets received, it should def not be 0!

issue building statsdaemon

I'm having trouble building from the master branch using go 1.5.1 on darwin and linux amd64.

No errors during the build, just no output of the binary. If I do specify a binary output, it throws an error when I try to start it up.

go build -a -v -o statsdaemon-amd64
runtime
sync/atomic
errors
unicode
unicode/utf8
math
sort
sync
io
syscall
github.com/tv42/topic
internal/singleflight
github.com/vimeo/statsdaemon/common
bytes
strings
time
strconv
math/rand
reflect
os
github.com/vimeo/statsdaemon/ticker
fmt
github.com/metrics20/go-metrics20
log
runtime/cgo
github.com/vimeo/statsdaemon/counters
github.com/vimeo/statsdaemon/gauges
github.com/vimeo/statsdaemon/timers
net
github.com/vimeo/statsdaemon/udp
github.com/vimeo/statsdaemon

Here is the output when i try to run it.

./statsdaemon-amd64 
./statsdaemon-amd64: line 1: syntax error near unexpected token `newline'
./statsdaemon-amd64: line 1: `!<arch>'

Building other apps seems to work fine. I was able to build and use the bitly version of statsdaemon without any issues. I need the vimeo version because it has the prefix option for different metric types.

Legacy format appends .count .rate despite the flag

With config settings:

legacy_namespace = true
prefix_rates = "stats."
prefix_counters = "stats_counts."
prefix_timers = "stats.timers."
prefix_gauges = "stats.gauges."

send
echo "deploys.test.myservice:1|c" | nc -w 1 -u 127.0.0.1 8125 echo "deploys.test.myservice:1|c" | nc -w 1 -u 127.0.0.1 8125

nc -l 2003 |grep -v statsdaemon
stats_counts.deploys.test.myservice.count 2 1485198930
stats.deploys.test.myservice.rate 0.2 1485198930

Statsd default behavior for this same metric is:
stats_counts.deploys.test.myservice 2 1485199431 stats.deploys.test.myservice 0.2 1485199431

Configuring which stats to send

Hi,

Me and my team are surveying drop-in replacements for statsd - specifically ones that can handle metrics 2.0 well.

We thought that statsdaemon can be a good candidate, but we are concerned about the massive amounts of irrelevant stats being sent.

For instance, we really have no use for the pckt_* metrics, as well for std / median / sum metrics.

Looking at the source code / readme, unfortunately they do not seem to be configurable.

I understand those can be filtered out using carbon-relay black/white list, however this will cause unnecessary network / CPU overhead.

Am I missing anything?

Thanks.

randomly unable to parse ini ?

if i start statsdaemon and kill it, start it, kill it, etc
it will arbitrarily parse the config and assign itself the correct instance string, graphite_addr, and sometimes it just reverts to all defaults.
actually, the 2nd-to-last case even parses the correct instance key, but uses the default graphite_addr.
no idea what's going on here. this happens arbitrarly, irrespective of which args i use, needless to say, i use the same binary and config file.

maybe something to do with github.com/stvp/go-toml-config ?
@stvp any idea?

[root@dfvimeostatsd1 ~]# ./statsdaemon-parseline2-2
parsing /etc/statsdaemon.ini
graphite_addr is 127.0.0.1:2003
2014/10/13 15:11:20 statsdaemon instance 'null' starting
2014/10/13 15:11:20 listening on :8125
2014/10/13 15:11:20 listening on :8124
Listening on :8126
^C!! Caught signal interrupt... shutting down
2014/10/13 15:11:21 ERROR: dialing 127.0.0.1:2003 failed - dial tcp 127.0.0.1:2003: connection refused
[root@dfvimeostatsd1 ~]# /sbin/stop statsdaemon; ./statsdaemon-parseline2-2 -cpuprofile=cpuprof-parseline2
stop: Unknown instance: 
parsing /etc/statsdaemon.ini
graphite_addr is 127.0.0.1:2003
2014/10/13 15:11:22 statsdaemon instance 'null' starting
2014/10/13 15:11:22 listening on :8125
2014/10/13 15:11:22 listening on :8124
Listening on :8126
^C!! Caught signal interrupt... shutting down
2014/10/13 15:11:24 ERROR: dialing 127.0.0.1:2003 failed - dial tcp 127.0.0.1:2003: connection refused
[root@dfvimeostatsd1 ~]# ./statsdaemon-parseline2-2
parsing /etc/statsdaemon.ini
graphite_addr is 127.0.0.1:2003
2014/10/13 15:11:25 statsdaemon instance 'dfvimeostatsd1' starting
2014/10/13 15:11:25 listening on :8125
2014/10/13 15:11:25 listening on :8124
Listening on :8126
2^C!! Caught signal interrupt... shutting down
2014/10/13 15:12:05 ERROR: dialing 127.0.0.1:2003 failed - dial tcp 127.0.0.1:2003: connection refused
[root@dfvimeostatsd1 ~]# /sbin/stop statsdaemon; ./statsdaemon-parseline2-2 -cpuprofile=cpuprof-parseline2
stop: Unknown instance: 
parsing /etc/statsdaemon.ini
graphite_addr is carbon:2003
2014/10/13 15:12:07 statsdaemon instance 'dfvimeostatsd1' starting
2014/10/13 15:12:07 listening on :8125
2014/10/13 15:12:07 listening on :8124
Listening on :8126

statsdaemon processing time vs statsd 0.8.0 nodejs

I may be misinterpreting the processing time metric but it looks like the following setup is outperforming statsdaemon at least in the "processing_time" category. I assumed that maybe the 4 nodejs pids should be added up but even so are much less processing time. Is this something to worry about does 600ms equal latency before a metric gets sent to graphite?

Setup
statsd-proxy (c-code re-write)
statsd 0.8.0 x4
m4.xlarge Intel(R) Xeon(R) CPU E5-2676 v3 @ 2.40GHz
statsdaemon v0.6 (built w/go1.8rc2, git hash 1.0.0-12-g1a031b9) (set to nice -1)
carbon-c-relay is behind statsd doing aggregation (set to nice 19 to not steal cycles from statsdaemon)

screen shot 2017-01-24 at 1 34 56 pm

screen shot 2017-01-24 at 1 25 28 pm

There seems to be no performance difference between the two setups other than CPU usage reduction.

CPU usage does go down substantially when the test begins at 10:30
screen shot 2017-01-24 at 1 21 01 pm

UDP packet drops (statsdaemon enabled 10:30)
Even though statsdaemon is showing it is more efficient on cpu there are more drops than statd-proxy which uses SO_REUSEPORT (only kernel 3.9+).
screen shot 2017-01-24 at 1 19 44 pm

Q: Collecting metrics2.0 with statsdaemon for later using Grafana?

This is a question, not an issue. Thanks in advance for your great work!

I am struggling to assess the impact of using the metrics2.0 specification.

Context: I am planning to install the following stack,

  • Several collectors using metrics2.0
  • statsdaemon
  • InfluxDB
  • Grafana

Is there any advantage / disadvantage in using metrics2.0 from the beginning of the project? Will Grafana be able to digest the metrics?

TCP support

TCP support would be great, because some networks cannot run in UDP for various reasons.

Unable to assign config file

Hi

I had a statsdaemon running on my server 2 days back. It was having issues sending metrics so I decided to reinstall it. But ever since I trying to assign a config file to it, I am getting the below error

Could not read config file: /tmp/statsdaemon/statsdaemon.ini is not a valid TOML file. See https://github.com/mojombo/toml

I see a couple of commits made yesterday. Is anyone seeing the same issue

update log system to logrus

Just a cleanup to bring this into parity with the other raintank products.

github.com/sirupsen/logrus

Let me know if you are open to this change and i will make a PR.

Recommend Projects

  • React photo React

    A declarative, efficient, and flexible JavaScript library for building user interfaces.

  • Vue.js photo Vue.js

    ๐Ÿ–– Vue.js is a progressive, incrementally-adoptable JavaScript framework for building UI on the web.

  • Typescript photo Typescript

    TypeScript is a superset of JavaScript that compiles to clean JavaScript output.

  • TensorFlow photo TensorFlow

    An Open Source Machine Learning Framework for Everyone

  • Django photo Django

    The Web framework for perfectionists with deadlines.

  • D3 photo D3

    Bring data to life with SVG, Canvas and HTML. ๐Ÿ“Š๐Ÿ“ˆ๐ŸŽ‰

Recommend Topics

  • javascript

    JavaScript (JS) is a lightweight interpreted programming language with first-class functions.

  • web

    Some thing interesting about web. New door for the world.

  • server

    A server is a program made to process requests and deliver data to clients.

  • Machine learning

    Machine learning is a way of modeling and interpreting data that allows a piece of software to respond intelligently.

  • Game

    Some thing interesting about game, make everyone happy.

Recommend Org

  • Facebook photo Facebook

    We are working to build community through open source technology. NB: members must have two-factor auth.

  • Microsoft photo Microsoft

    Open source projects and samples from Microsoft.

  • Google photo Google

    Google โค๏ธ Open Source for everyone.

  • D3 photo D3

    Data-Driven Documents codes.