Code Monkey home page Code Monkey logo

obsidian-tracker's Introduction

Obsidian Tracker Plugin

GitHub release

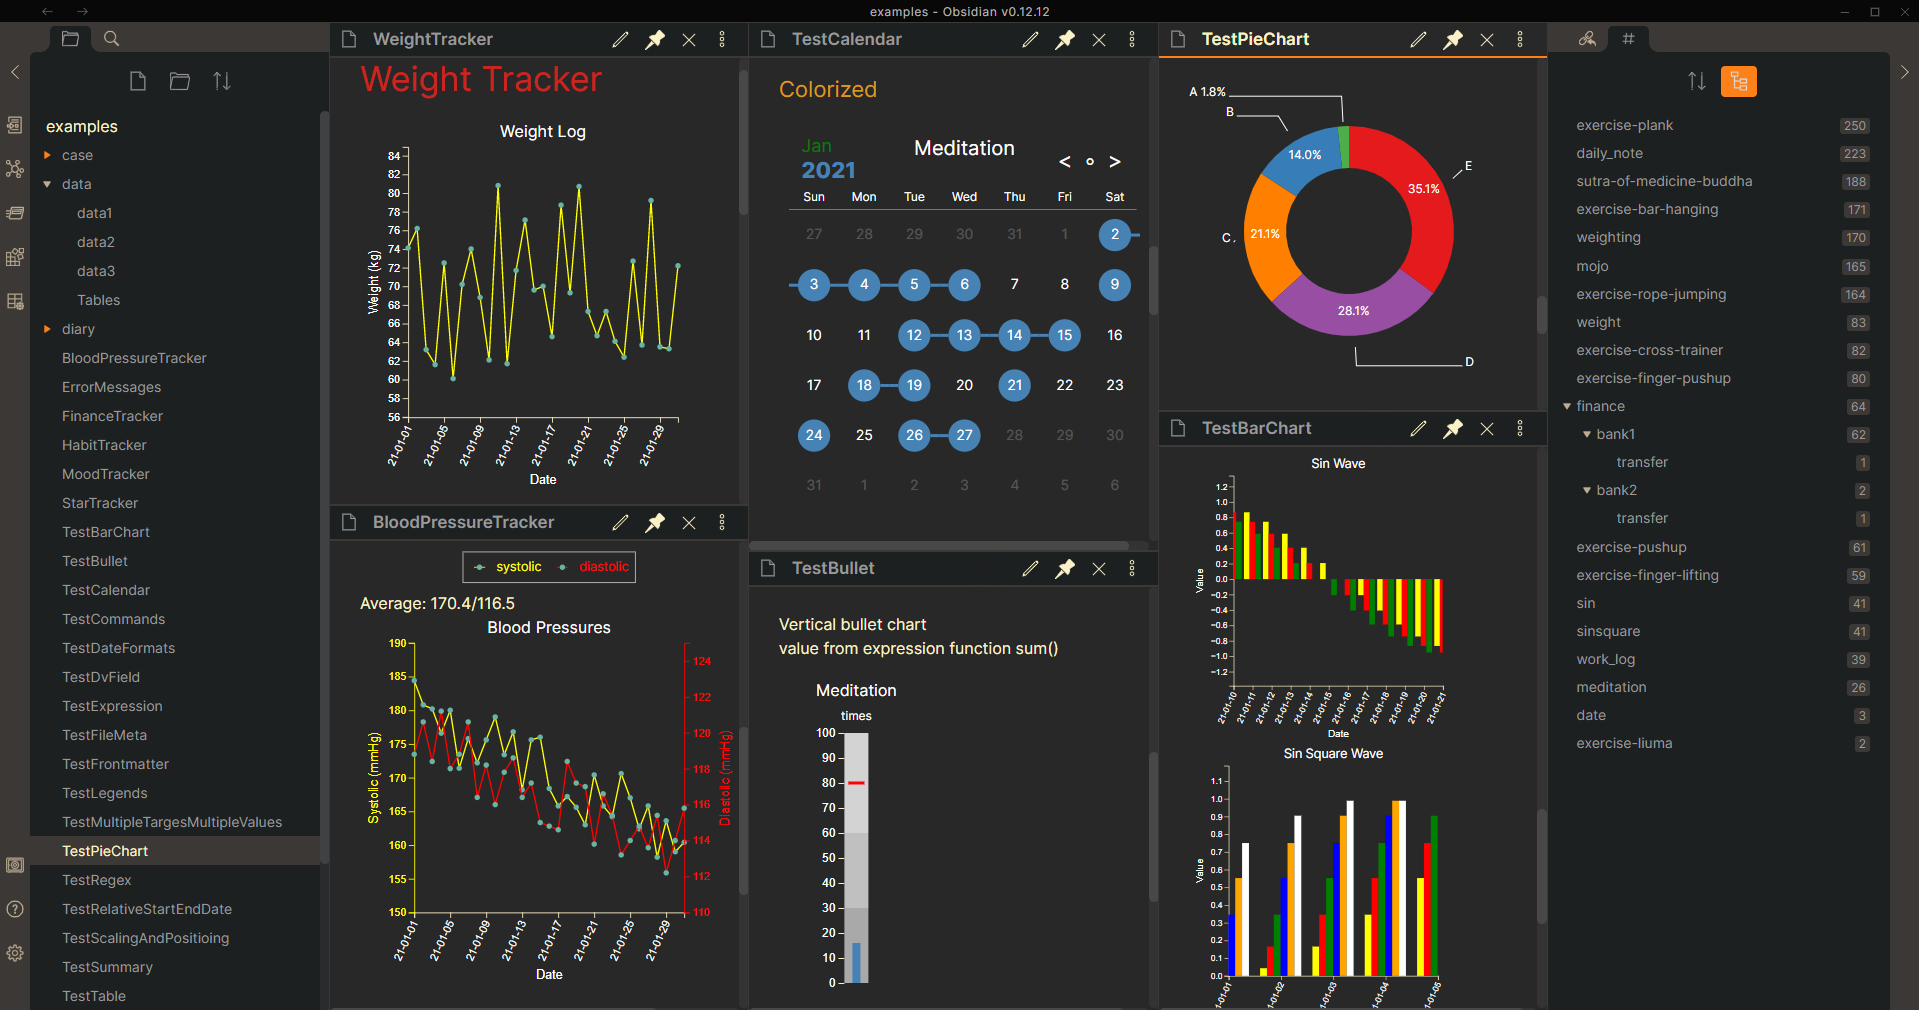
This is an Obsidian plugin that helps you collect data from notes and represent it comprehensively.

Here is a table containing simplified examples showing what you can track.

What's New

Version 1.14.0

  • Update dependencies
  • Prevent overlapping external labels in pie chart
  • Enable Stacked Bar Chart

Version 1.13.3

  • Update dependencies
  • Fix typo in FinanceTracker.md
  • Fix typo in TestExpression.md
  • Update main.ts - use new format for {{average}}

Version 1.13.2

  • Update dependencies
  • Fix typo in README.md
  • Change streak counts to terminate on falsey values rather than null

Version 1.13.1

  • Fix packaging script

Version 1.13.0

  • Add support for inline dataview fields (including emoji support for values)
  • Update dependencies

Version 1.12.0

  • Add aspect ratio parameter for graphs
  • Reorganize release notes in readme to be in descending order (latest release first)

Version 1.11.0

  • Add support for checkboxes in new properties added in Obsidian 1.4
  • Fix typos in documentation and examples

Version 1.10.9

  • Replace tab characters by spaces
  • Accept more unicode characters in dvField
  • Allow emojis in the folder path
  • Fixed bugs

Version 1.10.8

  • Fixed startDate/endDate misread as a relative date

Version 1.10.7

  • Allow using html image tags as emoji inputs

Version 1.10.6

  • Fixed the coloring for missing data in the month view

Version 1.10.5

  • Allow using a relative date value in initMonth in the month view

Version 1.10.4

  • Allow using a regular expression as a key of the parameter textValueMap
  • Add a parameter shiftOnlyValueLargerThan to determine when to do valueShift
  • Fixed bugs reported by users
  • Fixed typo in plugin settings

Version 1.10.3

  • Allow using the parameter fitPanelWidth with the output type month and pie
  • Fixed the resizing and positioning of the chart tooltip

Version 1.10.2

  • Fixed plugin not rendering on some macOS machines

Version 1.10.1

  • Fixed 'failed to load plugin' on iOS

Version 1.10.0

  • Add annotation mode for month view (examples)
  • Add parameters xAxisTickInterval, yAxisTickInterval, xAxisTickLabelFormat and yAxisTickLabelFormat for the line and bar chart (examples)
  • Allow using regular expression in parameter dateFormatPrefix and dateFormatSuffix (examples)
  • Add parameters file, specifiedFilesOnly, fileContainsLinkedFiles, and fileMultiplierAfterLink to retrieve data from specified files (examples)
  • Add a parameter textValueMap to convert texts or emojis to specified values (examples)
  • Fixed bugs
  • Enhanced error messages

!!! Breaking Changes !!!

From version 1.9.0, template variables, e.g. '{{sum}}', are deprecated. Instead, Tracker provide operators (+, -, *, /, %) and functions (dataset(), sum(), maxStreak(), ......etc) to help us do data processing. For users having code blocks from previous version, please replace '{{sum}}' by '{{sum()}}' or '{{sum(1)}}' by '{{sum(dataset(1))}}'. More information about the new expressions could be found here.

Usage

  1. Have some targets you want to track in daily notes.
  2. Add a new note for displaying the tracker.
  3. Add tracker code blocks manually (examples) or using commands.
  4. Switch the document view mode to 'Preview', then the code block will get rendered.

For more use cases, please download and open the examples folder in obsidian with this plugin installed and enabled.

More Details You May Want to Know

Support

  • If you like this plugin or want to support further development, you can Buy Me a Coffee.
  • Please report bugs and request features in GitHub Issues

obsidian-tracker's People

Contributors

bnjbvr avatar channingwalton avatar dependabot[bot] avatar ganesshkumar avatar generic-user avatar gma avatar gnopps avatar huyz avatar ianhakes avatar joeyseal avatar laharah avatar lazyguru avatar lulunac27a avatar mr-dionysus avatar mtomas7 avatar mvrtza avatar prolenodev avatar pyrochlore avatar souponaroom avatar woodworker avatar xychang avatar

Stargazers

 avatar  avatar  avatar  avatar  avatar  avatar  avatar  avatar  avatar  avatar  avatar  avatar  avatar  avatar  avatar  avatar  avatar  avatar  avatar  avatar  avatar  avatar  avatar  avatar  avatar  avatar  avatar  avatar  avatar  avatar  avatar  avatar  avatar  avatar  avatar  avatar  avatar  avatar  avatar  avatar  avatar  avatar  avatar  avatar  avatar  avatar  avatar  avatar  avatar  avatar  avatar  avatar  avatar  avatar  avatar  avatar  avatar  avatar  avatar  avatar  avatar  avatar  avatar  avatar  avatar  avatar  avatar  avatar  avatar  avatar  avatar  avatar  avatar  avatar  avatar  avatar  avatar  avatar  avatar  avatar  avatar  avatar  avatar  avatar  avatar  avatar  avatar  avatar  avatar  avatar  avatar  avatar  avatar  avatar  avatar  avatar  avatar  avatar  avatar  avatar

Watchers

 avatar  avatar  avatar  avatar  avatar  avatar  avatar  avatar  avatar  avatar  avatar  avatar  avatar  avatar  avatar  avatar

obsidian-tracker's Issues

Wiki linked dates will not parse in graph

Tracker graphs only parse when using non wiki-linked dates.

Example table:

Date Data Usage Cap
[[2021.03.01]] 0.04 MB 2.05 GB
[[2021.03.03]] 0.04 MB 2.05 GB
[[2021.03.17]] 9.15 MB 2.05 GB
[[2021.03.19]] 9.15 MB 2.56 GB
[[2021.03.24]] 98.88 MB 2.50 GB

Leaving the wiki links on the dates does not allow the graph to show.

This table will work though:

Date Data Usage Cap
2021.03.01 0.04 MB 2.05 GB
2021.03.03 0.04 MB 2.05 GB
2021.03.17 9.15 MB 2.05 GB
2021.03.19 9.15 MB 2.56 GB
2021.03.24 98.88 MB 2.50 GB

FWIW, this is my tracker codeblock:

searchType: table
searchTarget: __inbox/T-Mobile Data Tracking[0][0], __inbox/T-Mobile Data Tracking[0][1]
xDataset: 0
line:
    yAxisLocation: none, left
    lineColor: none, yellow
    showLegend: true
	fillGap: true

Multiple values from text search

That would suit me too. I have a bunch of entries for running in the form of 'run:: 5.32 @ 6.21'. This means that I ran 5.32km at a pace of 6.21 minutes per km. I would love to be able to plot that as two lines on a chart. At the moment I'm doing this by recording the string directly in the body of my daily note rather than in the front matter. Can I get the two values using a text search target and regular expression ? I'm struggling to understand the syntax of how to do that.

Thanks

Originally posted by @dcoales in #13 (comment)

Counting tag occurences giving wrong results

First of all, great plugin and amazing concept, so kudos to that for the developer.

Problem statement is, I am trying to fetch the number of todos (by tag) created with respect to the dates and trying to draw a line chart for it. I want to know about two problems i am facing here,

if Folder has an emoji in its name, Parser doesnt work

First one is, the YAML parser is not parsing a folder name with an emoji, its saying that the folder doesnt exist, dont know if am doing wrong there.
Screenshot 2021-05-27 at 7 45 34 PM
Screenshot 2021-05-27 at 7 45 49 PM

If i give the root folder as vault, then it returns an absurd result for searching the occurrences of "#todo"

I am confused, since it dint accept the emoji, i gave the root folder as vault and tried to get all the occurences of the tag todo and still it dint work.
Screenshot 2021-05-27 at 7 46 20 PM
Screenshot 2021-05-27 at 7 46 26 PM

Things i am sure about

  • Yes i create todo tags every single day
  • The emoji did not work for folder name whatsoever, tried from multiple source (maybe i am missing something here)

Ignore missing values a.k.a. non-daily tracker

Is there support for non-daily trackers? For example: I track the size of certain muscles in order to follow progress. I do this every other day and not every day. When I render charts there are gaps between data points. Lines are not drawn, so I have to go with bar charts. However, the more time goes by the narrower get the bars, since most of the days there are no data points. I'd like an option ignoreEmpty where dates are skipped when there is no data for the given date. Is this already possible?

Delays in appearance of tracker content

Originally opened this to ask about why I couldn't get the month view trackers to appear. Then, later on, they started working, and it wasn't because of anything I'd changed in my setup. (I did change things, but changing them back to test didn't break the month view.)

I'm still having issues with not all of my entries showing up on bar and line graphs, even for ones written and detailed in the exact same way as a working graph, with the only difference being the searchTarget. All the bits it's looking for are in the same format and in the same note as an entry that is working for a different searchTarget (And it's not as if the new searchTarget itself can find nothing, as some of the instances are appearing. But others with identical format, pasted in a different Daily Note, are not appearing.) Perhaps this is also a delay, but some of it has been missing for longer than the month view trackers were.

All-round weird experience with this. But it looks really handy, so I really hope I can straighten it out!

Graph not rendering

Hi, I think this plugin will be very useful. I'm using the following code:

searchType: tag
searchTarget: dailyquestions/meditate
folder: Daily Notes
line:
yAxisLabel: Rating
yMin: 1
yMax: 9

Where Daily Notes is the Daily Notes folder. I am A Brit so my Date format default is DD-MM-YYYY. For some reason, the charts do not render at all when I use the above syntax. There are no error message. Am I missing something?

Labels and lines not showing

I have the following set up:

searchType: text
searchTarget: 'Run::.*@(?<value>[\s]*[0-9]+[\.][0-9]*)'
folder: /journals
startDate: 2021 05 01, Sat
line:
    title: Running Pace
    xAxisLabel: When
    yAxisLabel: Pace
	yAxisUnit: min/km
	lineColor: red

However, none of the labels show nor any lines. I just get this:

tracker

I can't figure out what I'm doing wrong !

Cannot register pages in specified folder

Hello, I am unsure why this problem exists.

my code is:

searchTarget: Learn, Improve my wellbeing, Make progress, Manage my energy, Be mindful, Contribute, Share, Strive, Love my family, Love myself
searchType: dvField
datasetName: πŸ‘©β€πŸŽ“ Learning, πŸ‘© Wellbeing, πŸ“ˆ Progress, πŸ’‘ Energy, 🌸Mindfulness, 🎁 Contribute, πŸ“¬ Share, πŸ’― Strive, πŸ’• Family, πŸ’œ Self-love
folder: + Day Notes
startDate: 2021-05-15
fitPanelWidth: true
line:
    title: Daily Questions Summary
    lineColor: magenta, red, orange, green, cyan, blue, purple, indigo, black, grey
    showLegend: true
    legendPosition: right
    yMax: 10

I am trying to achieve this so my data is read from a Day Note and translated across to the tracker.

The section in my day note looks like this:

- #❓/πŸ‘©β€πŸŽ“ | Learn:: 1
- #❓/πŸ‘© | Improve my wellbeing::  2
- #❓/πŸ“ˆ | Make progress:: 3
- #❓/πŸ’‘ | Manage my energy:: 4 
- #❓/🌸 | Be mindful:: 4
- #❓/🎁 | Contribute:: 5
- #❓/πŸ“¬ | Share:: 6
- #❓/πŸ’― | Strive:: 7
- #❓/πŸ’• | Love my family:: 7 
- #❓/πŸ’œ | Love myself:: 8

I create pages in the specified day note folder, shown on line 7 in the Tracker Example, using the data from my Day Note just above, yet i receive this: https://gyazo.com/5dfea46876248dacb4ea349b5ae87357

Sorry for your time, I just have no idea what I'm doing wrong.

add start date and end date to summary

Can you add Start Date and End Date to the summary template variables so that we can see the Start Date and End Date of the latest streak and the Start Date and End Date of the data set.

Possible to track data in table rows

As I mentioned in the Discord; would be nice if I could track and graph rows (say in a table) like date: 2021-03-04 time: 5:45 systolic: 125 diastolic 65. I can make a table nicely using dataview it would be amazing if they could play together!

Interpolation for timeseries plotting

Enhancement

It would be great if generated graphs would interpolate data.

For example, say we have the following data:

Day 1: 150
Day 3: 160

Then, the graph would interpolate the data and plot a point at day 2 with a value of 155.

Support more operations/units for time values

In the time value example, one can use 8:1 in the front matter to denote one minute past eight in the morning. It would be great to support more operations like this, e.g. something like the following:

  • 00:01:30 or something like 1min30sec for 1 minute and 30 seconds
  • 01:01:30 or something like 1h1min30sec for 1 hour, 1 minute and 30 seconds

I am not sure what is the best way to do this, but it would be great to be able to denote time values in a more flexible way.

Cannot draw chart for narrow range values

The example Weight Log chart looks good because it has yMin = 60 and yMax = 80, and only that range of values is shown, not the full range starting from yMin = 0. However, if the range of values is only between yMin = 65 and yMax = 80, suddenly the chart shows up with yMin = 0, even if there is no value smaller than 65 and even if you set yMin = 65 explicitly.

This is because of the code used here:

    if ((yMin >= 0 && yMin > yMax * 0.8) || (yMin >= 0 && graphInfo.accum)) {
        yScale.domain([0, yMax * 1.2]).range([height, 0]);
    }

Since 65 > 80 * 0.8, it forcefully sets the minimum of the yScale to 0. This is not what one would expect, not sure why you are doing this?

How to specify legend labels for tags?

Hello,

How can I specify the name of the labels for the legend?
It would be nice if by default it would use the name of the tags.
But is it possible to set the names manually?
(I went through the docs and the example but couldn't find what I needed)

Here is my code

```tracker
searchType: tag
searchTarget: time-tracking/phd, time-tracking/crypto, time-tracking/social, time-tracking/sport
folder: /02_AREAS/daily_notes
startDate: 2021-06-21_Mon
endDate: 2021-06-27_Sun
bar:
    title: Time tracking for week 24
	yAxisLabel: Time
    yAxisUnit: h
    yMin: 0
	yMax: 16
	allowInspectData: true
	showLegend: true
	legendPosition: right
    barColor: green, yellow, blue, orange
```

Here is what I get:
image

Thank you for this awesome plugin. It helps me keep things in Obsidian.

Changing the size of the chart

I tried looking for a way to change the plotted graph area, but couldn't find any way.
Can the area or the size of the graph be changed?

Currently it previews as a square block, I intend to have it full page width and maybe scrollable too. Possible?

Tracking value tuples (like blood pressure)

This is a really useful plugin, thank you for making it!

It would be great if this could be used for tracking blood pressure values as well. The peculiarity here is that you want to track two values, the systolic and diastolic value, and display them in one diagram. You may also want to track and show the pulse together with these. Another similar use case would be tracking weight and waist size in the same diagram.

Maybe we can have an option to display the values for more than one tag in one diagram, and the possibility to specify multiple values with a single tag, since entering blood pressure values with two or three different tags will be cumbersome.

Time values cannot be tracked when included as Dataview fields

Following the time values example, the following can be tracked if they are included in the front matter. However, if they are defined as Dataview inline fields, they cannot be tracked with this plugin.

clock-in:: 8:1
clock-out:: 17:0
sleep:: 9:2 pm/6:37 am

The following gives no results:

searchType: dvField
searchTarget: sleep[0], sleep[1]
valueShift: -24:00, 00:00
datasetName: Sleep, WakeUp
line:
    title: "Sleep"
    yAxisLabel: "Time (24h)"
    lineColor: yellow, red
    showPoint: true
	showLegend: true

Am I missing anything in the query above?

Display intervals in the calendar view

Hi, I've been using this plugin to track task completion on daily notes with great success, but I'm stumbling over an issue today.
I want to track my fasting intervals, so made a table inside a new note looking like this:

Start Date End Date Duration (min) Duration (readable)
12 Jul 2021 at 19:05 20 Jul 2021 at 22:45 11740 8 days, 3 hours, 40 minutes

And on my graph page, I want to display intervals (I only need column 1 and 2), something akin to this.
.

Is this currently feasible or it's something not implemented yet? I looked at the extensive documentation, and while I did find how to parse a table data into a calendar view, it was only one-off events.

Make the regex a bit more relaxed

The regex for searching tagged values is very strict. For instance, it ignores the following:

My weight todaay was #weight:100kg!

I think the parser should allow and ignore any punctuation characters after the value.

I had the wish to track words...

this way I can make a dashboard with word streaks, daily words in my could and on given projects see my writing progress over time, and of course, be a bit ashamed of myself when I slack off.
many statistics I can think about like most words written ever. accumulative words in the vault, count streaks, and words to go to a given goal....

Emoji Tracking

I'm using the Emoji Tool Bar GITHUB from Oliveryh.

I know that it's just images. Is there any support for this. The text type and the star examples didn't work.

Invalid date range?

I keep seeing the message 'invalid date range'. What am I doing wrong? I already set the date format to YYYY-MM-DD_ddd and the journal folder in the plugin settings. Thank you!

searchType: tag
searchTarget: #πŸ”₯/learn  
folder: /
startDate: 2021-05-08_Sat
endDate: 2021-05-10_Mon
line:
    title: "Line Chart"
    xAxisLabel: Date
    yAxisLabel: Value

Bar with multiple inputs

This plugin is the best -- many thanks for taking the time to put it together!

I am trying to make a bar chart of multiple exercise types. I've looked at the examples and I just can't see what I'm doing wrong -- if you see in the attached, the individual tags get read as expected, but when I try and put them all in one chart it draws only a selection.
Screenshot 2021-07-30 at 09 53 28
Screenshot 2021-07-30 at 09 53 32

PS. A more natural chart for this would be a stacked bar chart; it doesn't look like it's on the roadmap but it would be great.
PPS. Multiple inputs on the calendar option would be great.
PPPS. Also, an option to add a legend.

Feature Request: Activity Tracker Graph and/or Calendar

Hey there, just discovered this - thanks for the great plugin!

I wanted to make a feature request. For a lot of habits, the main thing we want to track is just completion on a given day.
The best visual for this is actually not a bar/line graph, but a calendar view so you get a visual sense of streaks + context on days of the week.
It'd be great if we could add support for this, either in a typical vertical calendar format, or something like the Github activity view:
image

There's another plugin that is somewhat related you might look at for inspiration: https://forum.obsidian.md/t/obsidian-activity-tracking-specific-project-or-vault/12873

Hope you take it into consideration!

Count Task with sub tags

I use Tags to label some of my tasks

-  [ ] #Health/Water  - Fill water Jug 
-  [ ] #Routine/maintenence - Clean out inbox
-  [ ] #Health/Vitamins Take vitamin B12
-

Is there any way to filter tasks by both tag and task? Tried to do it but running into issues

Feature Request: Pie Chart graph type

For some items, such as "percentage of days in the office" it would be helpful to have a pie chart graph type. I already track this using a bar chart (with a -1 penalty so I can see "up bars" when I'm in the office and "down bars" when I'm not, but would love to track various percentages (last 30 days, last 90 days, and last 365 days).

Thanks for considering this!

count completed tasks

Could you add the ability to count completed tasks? For example, I have a task list that includes walking everyday. Instead of counting the occurrence of the tag #walk, I'd like to count how many times the task

  • walk

is completed.

Month tracker not working as expected with values

searchType: table
searchTarget:  _Dailies/Tracker/tracking[0][0], _Dailies/Tracker/tracking[0][11]
xDataset: 0
month:
    startWeekOn:
    threshold: 2
    color: green
    headerMonthColor: orange
    dimNotInMonth: false
    todayRingColor: orange
    selectedRingColor: steelblue
    circleColorByValue: true
    showSelectedValue: true

I use a table for tracking everything. I had a count of habits accomplished in a day at the end of the table. I had values greater than 2 in zero-indexed column 11, but the links and solid circles are not showing up. Am I missing something?

image

Exemples with databases files

hello, thank you for plugin, i like to request if is possible in examples section, you put the md files with the data that the examples is using, because i am having a little problens to parsing my data, and with complete examples will be more easy to me learn the plugin funcions.

searchType: table fails with error in console

This could easily be a syntax mistake on my part, but providing details in case it's not.

Table is in /testTable.md, contents:

# Hello

| theDate    | theValue | 
| ---------- | -------- |
| 2021-07-11 | 2        |
| 2021-07-12 | 4        |
| 2021-07-20 | 10       |

Tracker is in /testTracker.md, contents:

```tracker
searchType: table
searchTarget: testTable[0][0], testTable[0][1]
xDataset: 0
line:
    yAxisLocation: none, left
    lineColor: none, red
    showLegend: true
```

This gives the following error in console when viewing testTracker.md:

main.ts:469 Uncaught (in promise) TypeError: Cannot read property 'getParentTarget' of null
    at _l.eval (eval at <anonymous> (app.js:1), <anonymous>:15:167456)
    at Generator.next (<anonymous>)
    at o (eval at <anonymous> (app.js:1), <anonymous>:15:165)

I'm using Obsidian v0.12.10 and Tracker v1.8.2.

Tracking time values

This is a very interesting plugin, thanks for developing this!
I was wondering if you'd consider adding the ability to track time as a value.
Right now I include the time I worked on something in my daily notes frontmatter like so:

---
clocked-in: 09:00 am
clocked-out: 05:00 pm
---

I'd like to visualize it with a line graph showing two lines, one for the clock-in time and one for the clock-out time.

Maybe it would be more feasible with a 24h time format instead of a 12h time format as well as adding the unit in the Tracker code block? What do you think?

regex in date format

I have a lot of old journal entries which have slightly different file name structure.
An example of Old format is YYMMDD - grace which in obsidian is as YYMMDD[ - grace]

For current year, i am using new format as YYMMDD[ - journal]

Is it possible to pull data from the both using regular expression for dateformat like YYMMD[- /journal|grace/] ?

Thanks for your work.

Limit time range dynamically

Heyhey, let me first say I love your plugin!

I'd really like to generate a graph that only shows the last n entries, is there any chance you could add something like

...
startDate: -n

?

Cheers

custom delimiter for multiple values

Thanks for this plugin! It is very handy for visualization. I wonder if you would consider adding an option to customize delimiters in content with multiple values.

Currently the delimiter is '/', so for example, I can search for sleep[0] and sleep[1] in the frontmatter content below:

---
sleep: 180/120
---

It would be great if we can set our own delimiter, such as "," or ";", so I can write:

---
sleep: [180, 120]
---

This will allow more flexibility and also compatibility with other uses (e.g. arrays in the Dataview plugin). Thank you!

Getting No notes found under this given search condition

I have tried what seems like a million variations of tests, and nothing gets past this error.

Here is a sample note with these fields at the beginning of the note for links, tags, and dataview:

Author:: [[Charles Duhigg]]
ReadDate:: 2021-08
SourceType:: Book
Tags:: #books/selfhelp


Note text is here

And here are a bunch of tracker queries:

searchType: fileMeta
searchTarget: mDate
folder: /
line:
    title: "Line Chart"

No notes found under the given search condition

searchType: fileMeta
searchTarget: size
folder: 
endDate: 2021-01-31
line:
    title: File Size Variation
	yAxisLabel: Size
	yAxisUnit: bytes

No notes found under the given search condition

searchType: tag
searchTarget: books/selfhelp 
folder: 
startDate:
endDate:
summary:
    style: "color:white;"

No notes found under the given search condition

searchType: text
searchTarget: 'ReadDate:\s(?<value>[0-9]+)'
summary:

No notes found under the given search condition

So, I am obviously missing some key simple setup thing, but I don't know what. :(

How to capture decimal values?

I am using this query. How can I have it capture '2.5' hours?

searchType: text  
searchTarget: 'Studied for\s+(?<value>[0-9]+)\s+hours'

I found this regex but don't really know how to name it' ' -- ?[0-9]*\.?[0-9]*
πŸ˜“

Unable to get the plugin to work.

We are trying to use Tracker to make some graph related to helpdesk agent performances.

We have a collection of notes, each one of them is a review of an incident created by an agent, and has the following frontmatter :

agent: a_name
incident: a_string
sysid: another_string
incident creation date: 2021-06-21T06:13:56

Note: the note's name is the incident string (thus not a date).

After looking for a while on the doc, we were unable to get that graph to work :

searchType: frontmatter, frontmatter
searchTarget: incident creation date, agent
datasetName: xDataset, agentDataset
folder: Analysis/Incidents
bar:
    title: "Bar Chart"
    xAxisLabel: Date
    yAxisLabel: Count

Over and over again we have "No notes found under the given search condition".
They are notes in the given folder. Each of them have the right frontmatter (they are generated by a script) so we don't know what we are doing wrong.
Could you help us?

Feature Request: yAxisInterval

Would love to specify the interval for the y-axis. Right now it goes by .5 in my bar/line graph trackers. However, it would be handy to be able to say the interval should be 1, or 2, etc. instead of .5.

Counting symbols as value

Right now I have a lot of historical data for mood tracking that is of the form:

07:37 [[🧠]] [[πŸ”·πŸ”·]] note of indeterminate length
more stuff 
blah blah
etc
19:36 [[🧠]] [[πŸ”·πŸ”·πŸ”·] another note

My question: is there a way to configure tracker to see the lines with the timestamp above as input for mood and use the count of the symbols as the value for each? Effectively seeing the first line as equivalent to:

Mood: 2

etc?

Feature Request: Track completed / uncompleted tasks

It would be super useful to track the number of finished or unfinished tasks in specific files.

Referring to markdown tasks

  • task
  • finished task

Use case:
To have a graph spanning days visualizing how much I got done or didn't get done.

Legend Not Showing

This is an awesome plugin, but I am having trouble getting the legend to render. I followed the example in TestLegends.md.

searchType: frontmatter
searchTarget: sleep, mood, energy, productivity
folder: Daily Notes
startDate: 2021-05-02
endDate: 2021-05-08
line:
    title: Trackers
    yAxisLabel: Sleep, Mood, Energy, Productivity
    yAxisUnit: Hours
    showPoint: true
    lineColor: black, green, red, blue
    showLegend: true
    legendPosition: right
    legendOrientation: horizontal

Screen Shot 2021-05-05 at 8 59 07 PM

Support hex/rgb colors

Currently color customization is supported using plain words

bar:
	barColor: green

It'd be great to be able to customize colors using hex/rgb:

bar:
	barColor: #ffaa11

Feature Request: Normalize Datasets

It would be extremely helpful to have an option to normalize the dataset within the tracker. (https://en.wikipedia.org/wiki/Normalization_(statistics))

(Potentially even allowing us to apply mathematical functions to the dataset).

Use case: normalize datasets to compare different data. For example, overlaying sleep with a productivity graph, or overlaying weight with an energy graph, since the units are completely different, it's hard to visualize. However, normalizing all values to 0 <= x <= 1 would allow quick comparisons.

Dates note rendering as expected

Hi it's me again. Everything looks great now, thank you so much. The only things which is puzzling me is that the X Axis dates are all the same, even though the date points are right. Sorry to bother you again. Is there a fix?
OB Trackker Dates

Recommend Projects

  • React photo React

    A declarative, efficient, and flexible JavaScript library for building user interfaces.

  • Vue.js photo Vue.js

    πŸ–– Vue.js is a progressive, incrementally-adoptable JavaScript framework for building UI on the web.

  • Typescript photo Typescript

    TypeScript is a superset of JavaScript that compiles to clean JavaScript output.

  • TensorFlow photo TensorFlow

    An Open Source Machine Learning Framework for Everyone

  • Django photo Django

    The Web framework for perfectionists with deadlines.

  • D3 photo D3

    Bring data to life with SVG, Canvas and HTML. πŸ“ŠπŸ“ˆπŸŽ‰

Recommend Topics

  • javascript

    JavaScript (JS) is a lightweight interpreted programming language with first-class functions.

  • web

    Some thing interesting about web. New door for the world.

  • server

    A server is a program made to process requests and deliver data to clients.

  • Machine learning

    Machine learning is a way of modeling and interpreting data that allows a piece of software to respond intelligently.

  • Game

    Some thing interesting about game, make everyone happy.

Recommend Org

  • Facebook photo Facebook

    We are working to build community through open source technology. NB: members must have two-factor auth.

  • Microsoft photo Microsoft

    Open source projects and samples from Microsoft.

  • Google photo Google

    Google ❀️ Open Source for everyone.

  • D3 photo D3

    Data-Driven Documents codes.