Code Monkey home page Code Monkey logo

pyecharts-snapshot's Introduction

pyecharts logo

pyecharts

Python ❤️ ECharts = pyecharts

Github Actions Status Codecov Package version PyPI - Python Version

PyPI - Format Contributions welcome License

English README

📣 简介

Apache ECharts 是一个由百度开源的数据可视化,凭借着良好的交互性,精巧的图表设计,得到了众多开发者的认可。而 Python 是一门富有表达力的语言,很适合用于数据处理。当数据分析遇上数据可视化时,pyecharts 诞生了。

✨ 特性

  • 简洁的 API 设计,使用如丝滑般流畅,支持链式调用
  • 囊括了 30+ 种常见图表,应有尽有
  • 支持主流 Notebook 环境,Jupyter Notebook 和 JupyterLab
  • 可轻松集成至 Flask,Sanic,Django 等主流 Web 框架
  • 高度灵活的配置项,可轻松搭配出精美的图表
  • 详细的文档和示例,帮助开发者更快的上手项目
  • 多达 400+ 地图文件,并且支持原生百度地图,为地理数据可视化提供强有力的支持

⏳ 版本

v0.5.x 和 V1 间不兼容,V1 是一个全新的版本,详见 ISSUE#892ISSUE#1033

V0.5.x

支持 Python2.7,3.4+

经开发团队决定,0.5.x 版本将不再进行维护,0.5.x 版本代码位于 05x 分支,文档位于 05x-docs.pyecharts.org

V1

仅支持 Python3.6+

新版本系列将从 v1.0.0 开始,文档位于 pyecharts.org;示例位于 gallery.pyecharts.org

V2

仅支持 Python3.6+

新版本基于 Echarts 5.4.1+ 进行渲染, 文档和示例位置与 V1 相同

🔰 安装

pip 安装

# 安装 v1 以上版本
$ pip install pyecharts -U

# 如果需要安装 0.5.11 版本的开发者,可以使用
# pip install pyecharts==0.5.11

源码安装

# 安装 v1 以上版本
$ git clone https://github.com/pyecharts/pyecharts.git
# 如果需要安装 0.5.11 版本,请使用 git clone https://github.com/pyecharts/pyecharts.git -b v05x
$ cd pyecharts
$ pip install -r requirements.txt
$ python setup.py install

📝 使用

本地环境

生成 HTML

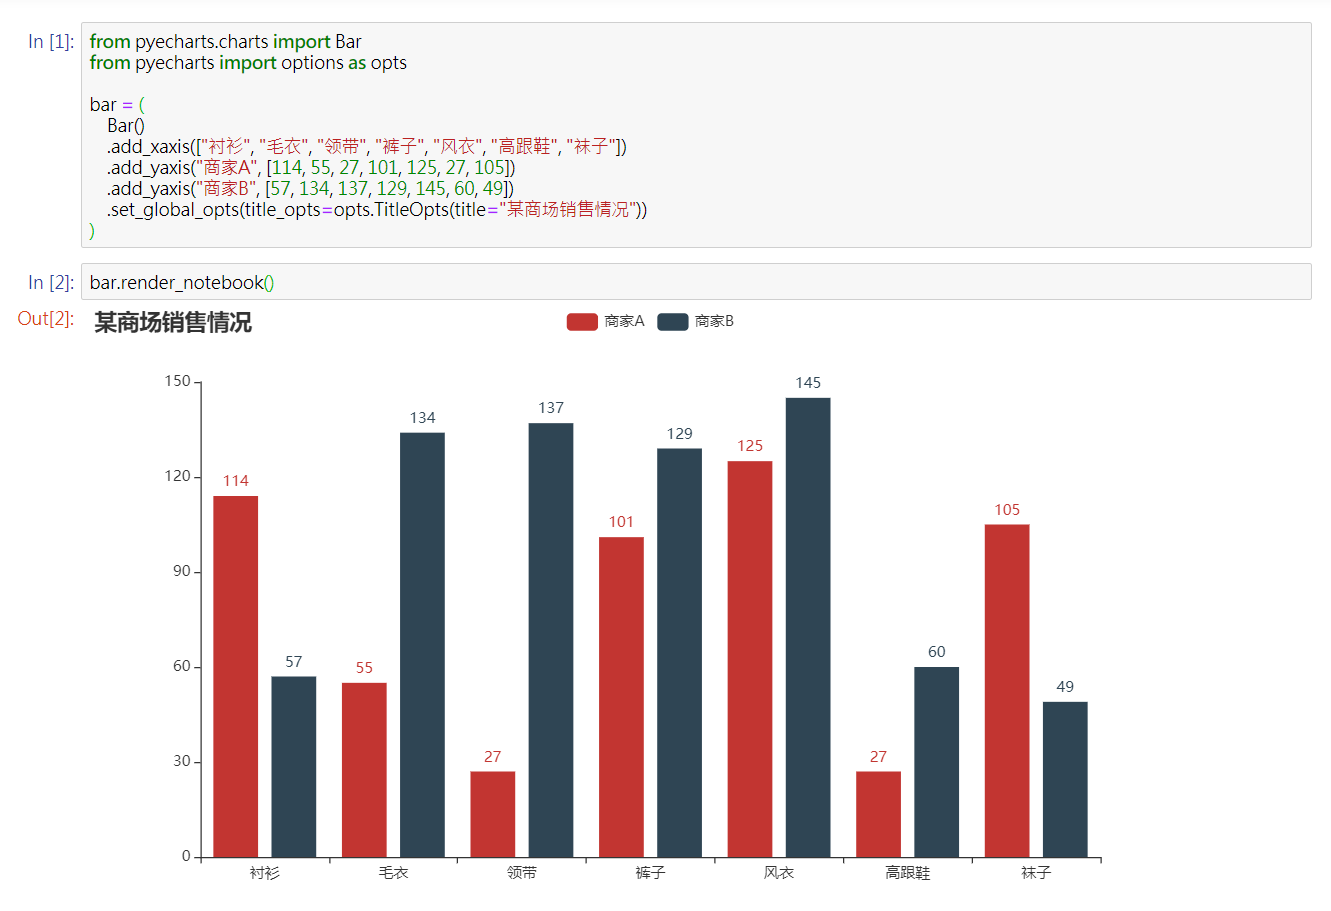
from pyecharts.charts import Bar
from pyecharts import options as opts

# V1 版本开始支持链式调用
bar = (
    Bar()
    .add_xaxis(["衬衫", "毛衣", "领带", "裤子", "风衣", "高跟鞋", "袜子"])
    .add_yaxis("商家A", [114, 55, 27, 101, 125, 27, 105])
    .add_yaxis("商家B", [57, 134, 137, 129, 145, 60, 49])
    .set_global_opts(title_opts=opts.TitleOpts(title="某商场销售情况"))
)
bar.render()

# 不习惯链式调用的开发者依旧可以单独调用方法
bar = Bar()
bar.add_xaxis(["衬衫", "毛衣", "领带", "裤子", "风衣", "高跟鞋", "袜子"])
bar.add_yaxis("商家A", [114, 55, 27, 101, 125, 27, 105])
bar.add_yaxis("商家B", [57, 134, 137, 129, 145, 60, 49])
bar.set_global_opts(title_opts=opts.TitleOpts(title="某商场销售情况"))
bar.render()

生成图片

from snapshot_selenium import snapshot as driver

from pyecharts import options as opts
from pyecharts.charts import Bar
from pyecharts.render import make_snapshot


def bar_chart() -> Bar:
    c = (
        Bar()
        .add_xaxis(["衬衫", "毛衣", "领带", "裤子", "风衣", "高跟鞋", "袜子"])
        .add_yaxis("商家A", [114, 55, 27, 101, 125, 27, 105])
        .add_yaxis("商家B", [57, 134, 137, 129, 145, 60, 49])
        .reversal_axis()
        .set_series_opts(label_opts=opts.LabelOpts(position="right"))
        .set_global_opts(title_opts=opts.TitleOpts(title="Bar-测试渲染图片"))
    )
    return c

# 需要安装 snapshot-selenium 或者 snapshot-phantomjs
make_snapshot(driver, bar_chart().render(), "bar.png")

Notebook 环境

Jupyter Notebook

JupyterLab

Web 框架

🔖 Demo

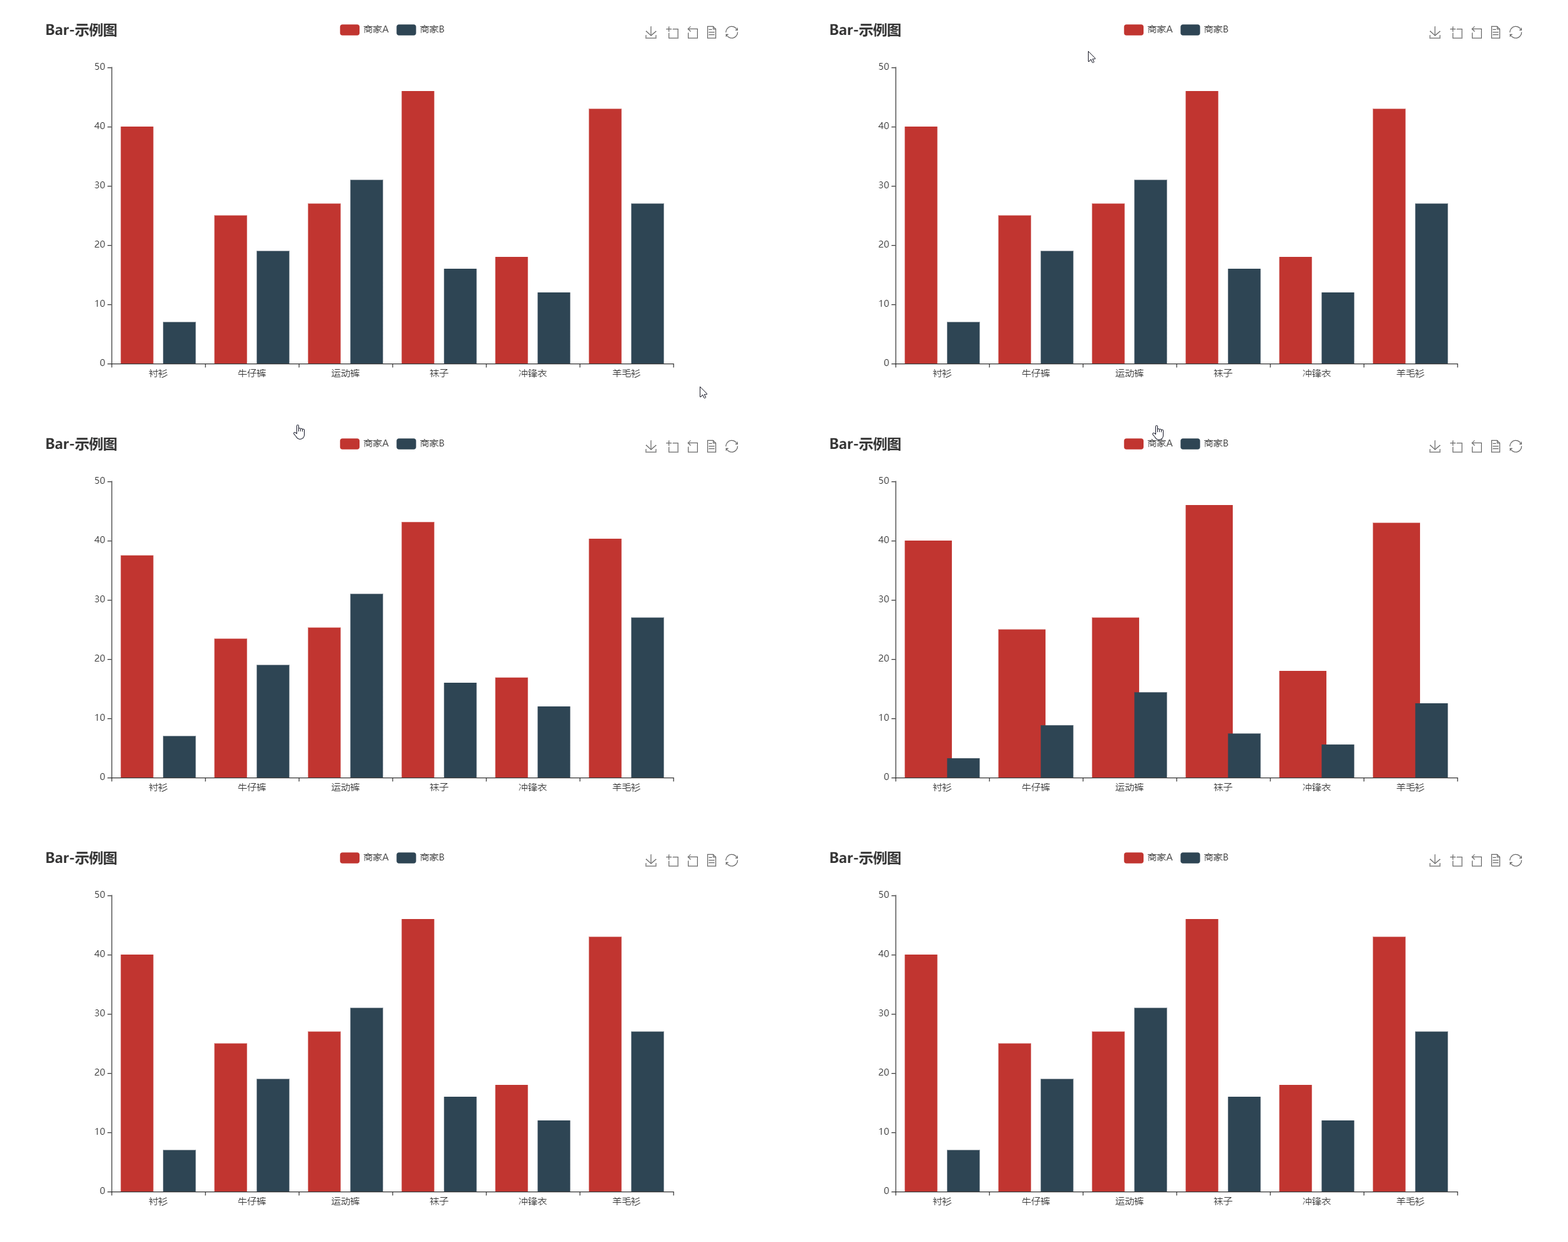
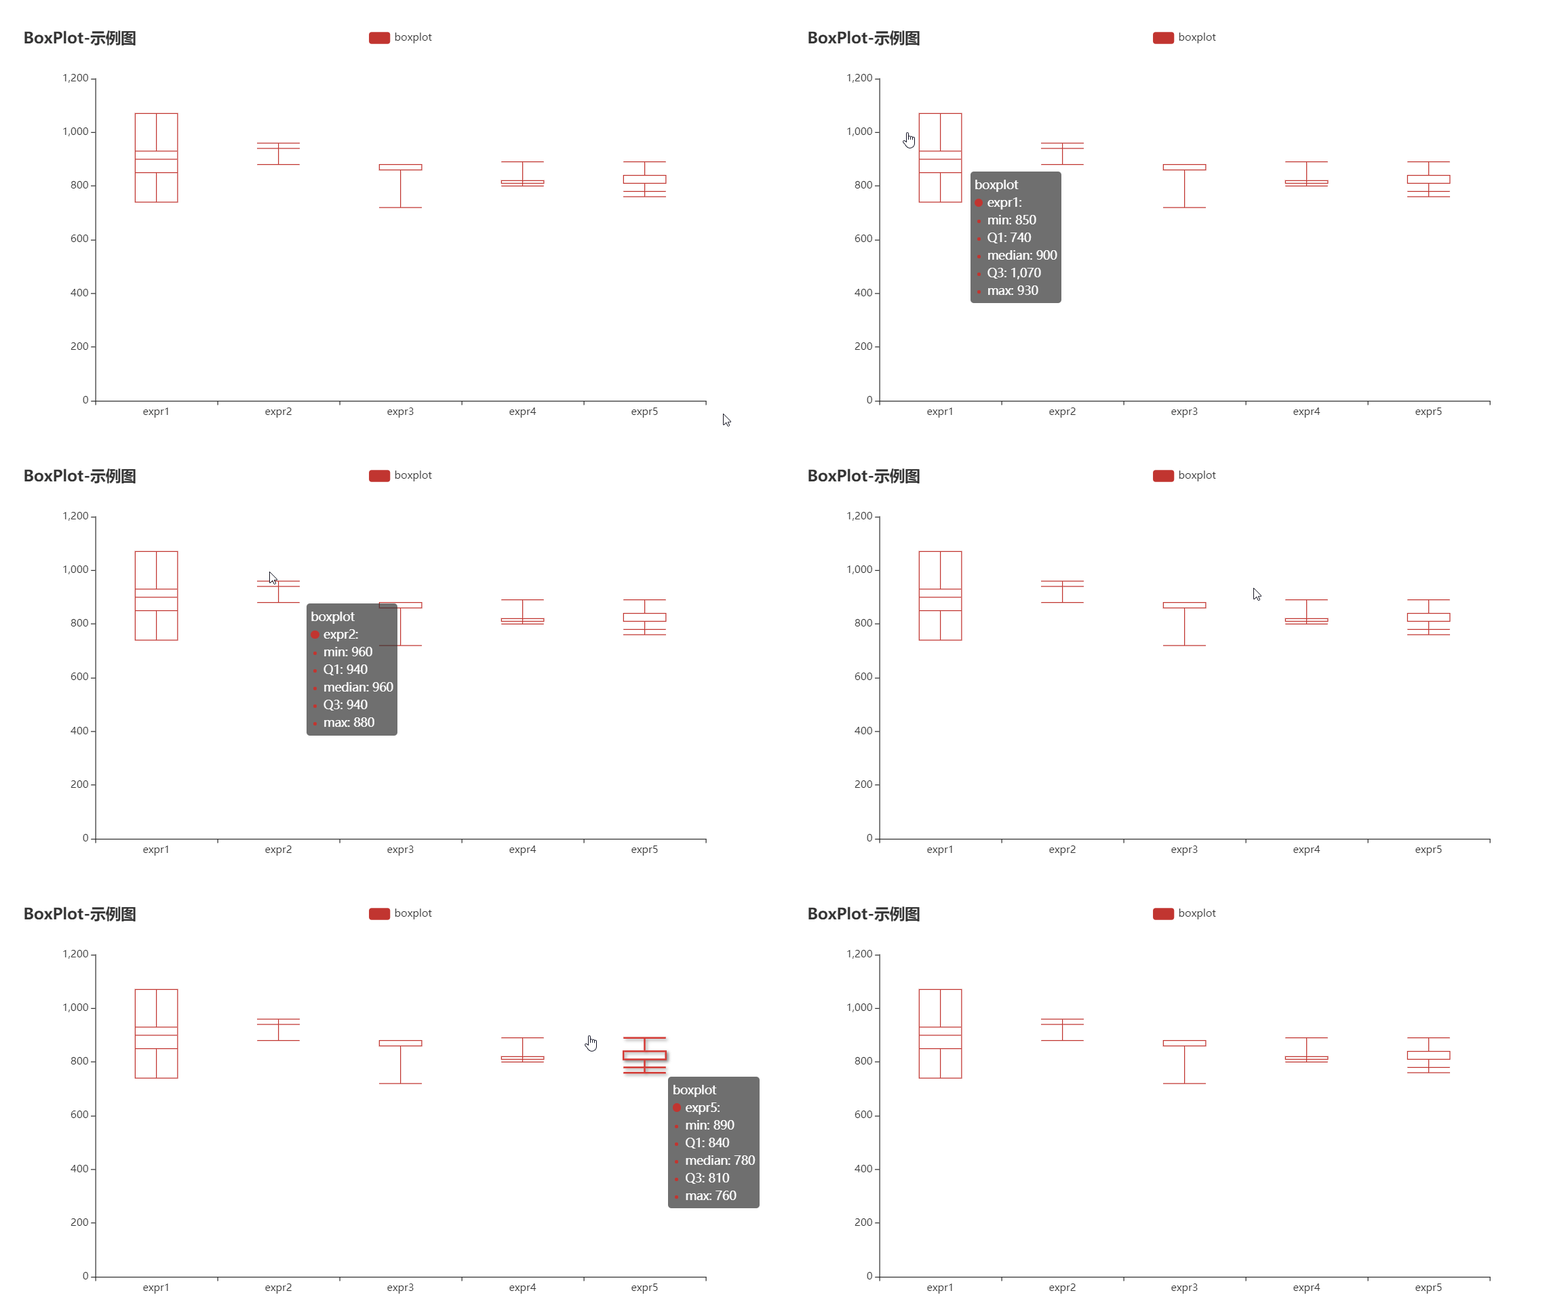
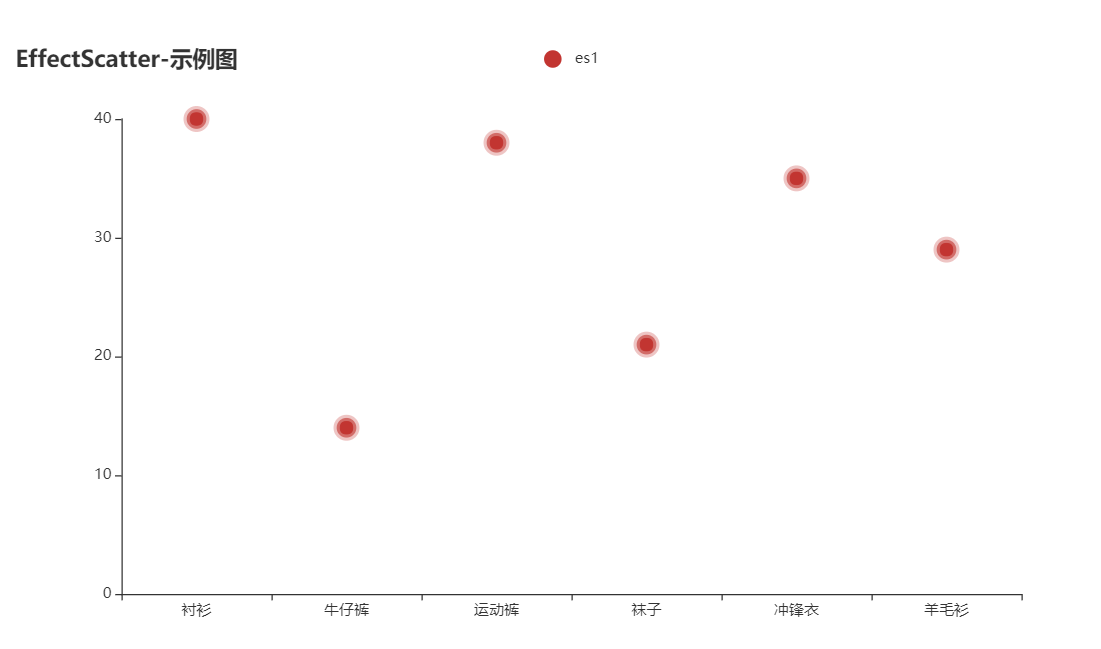
Demo 代码位于 example 文件夹下,欢迎参考 pyecharts 画廊 pyecharts-gallery

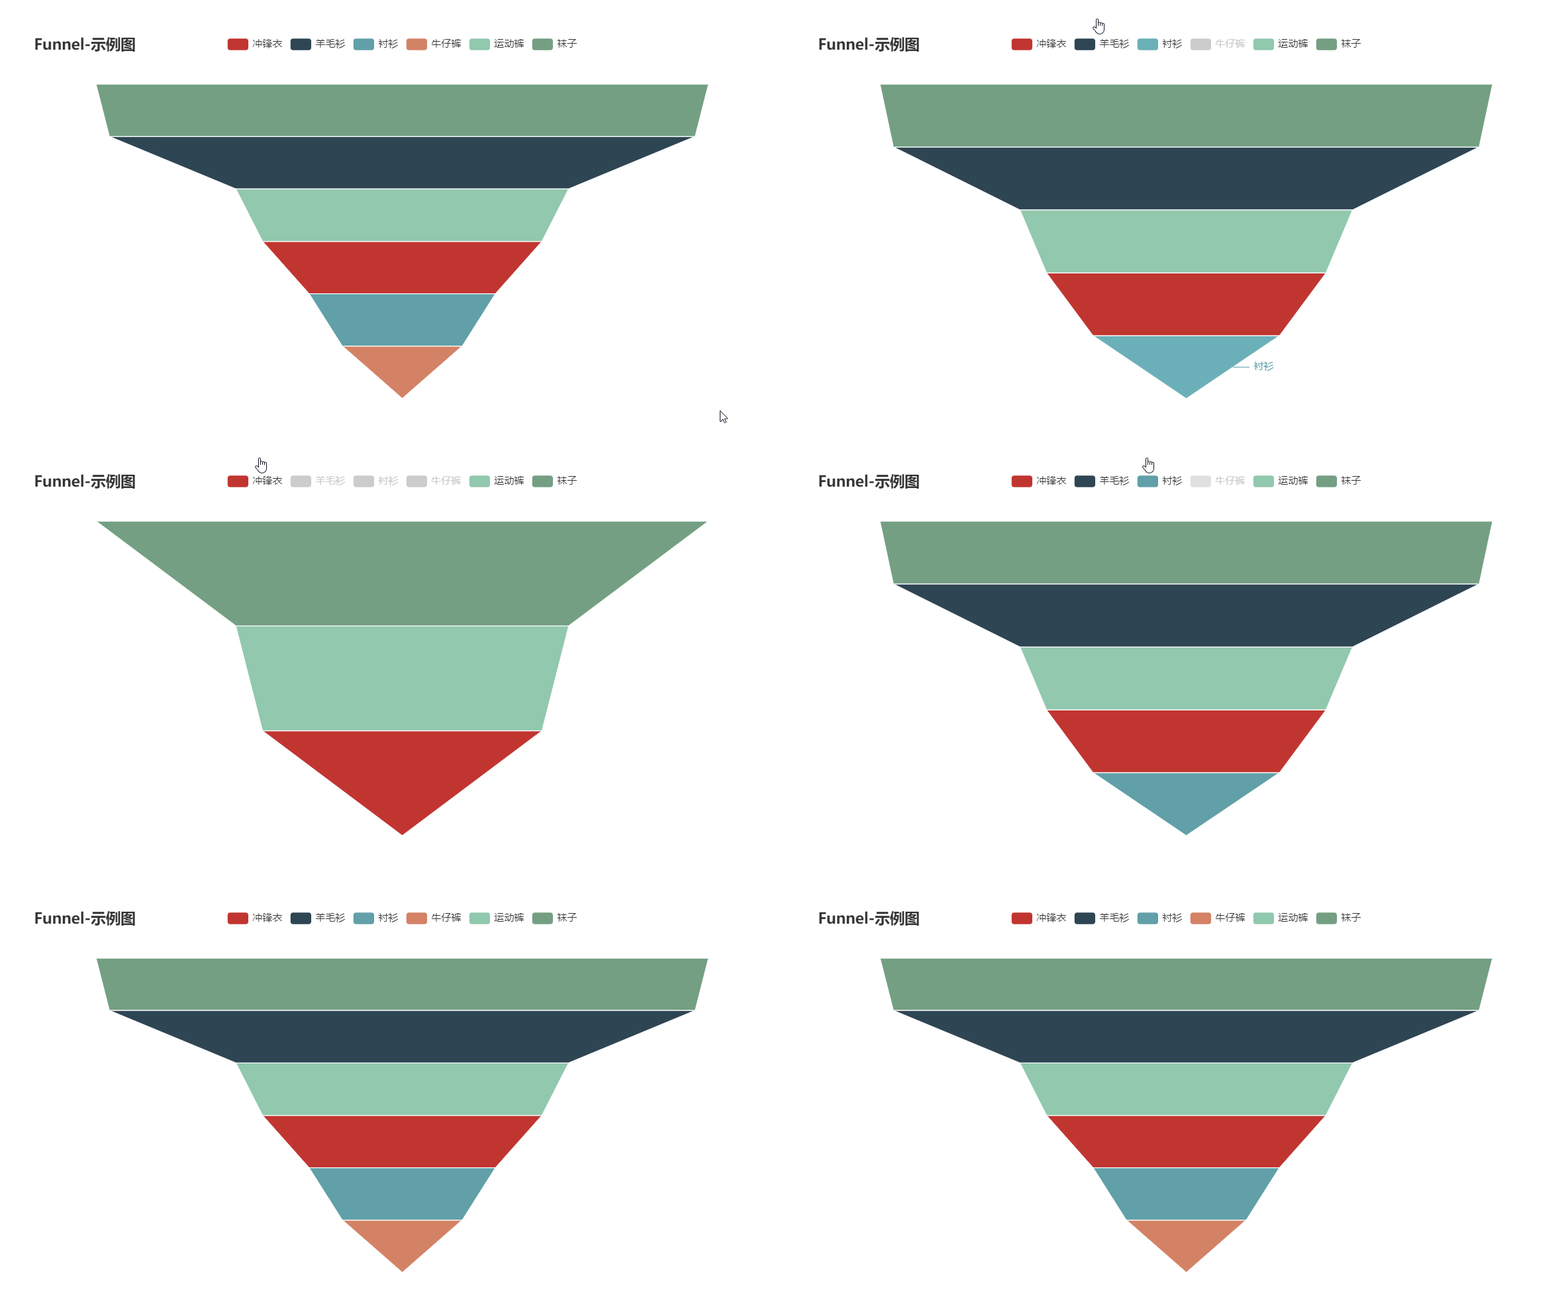
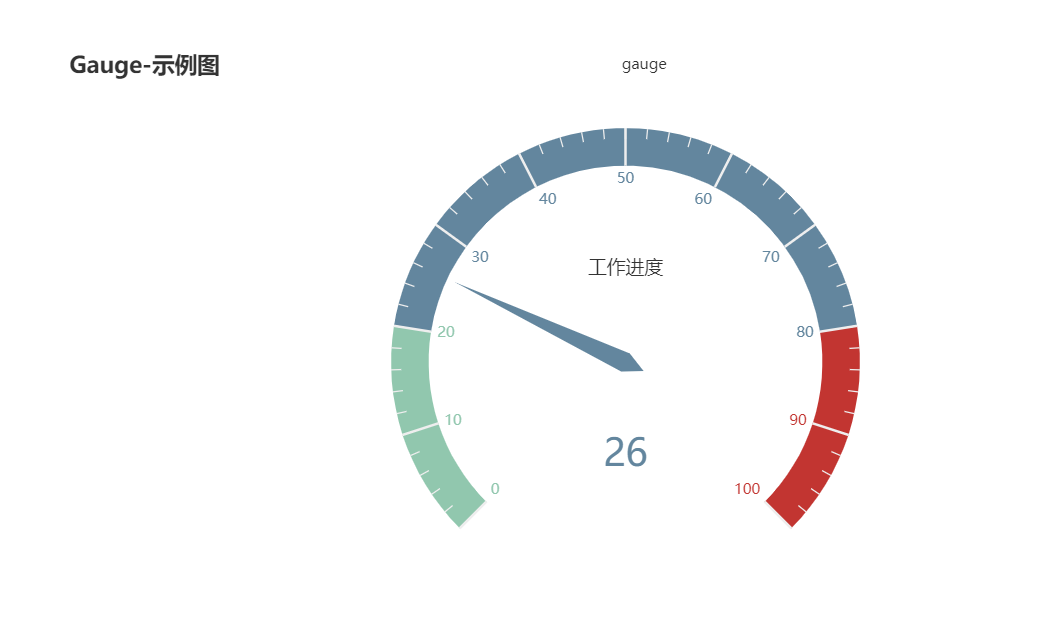
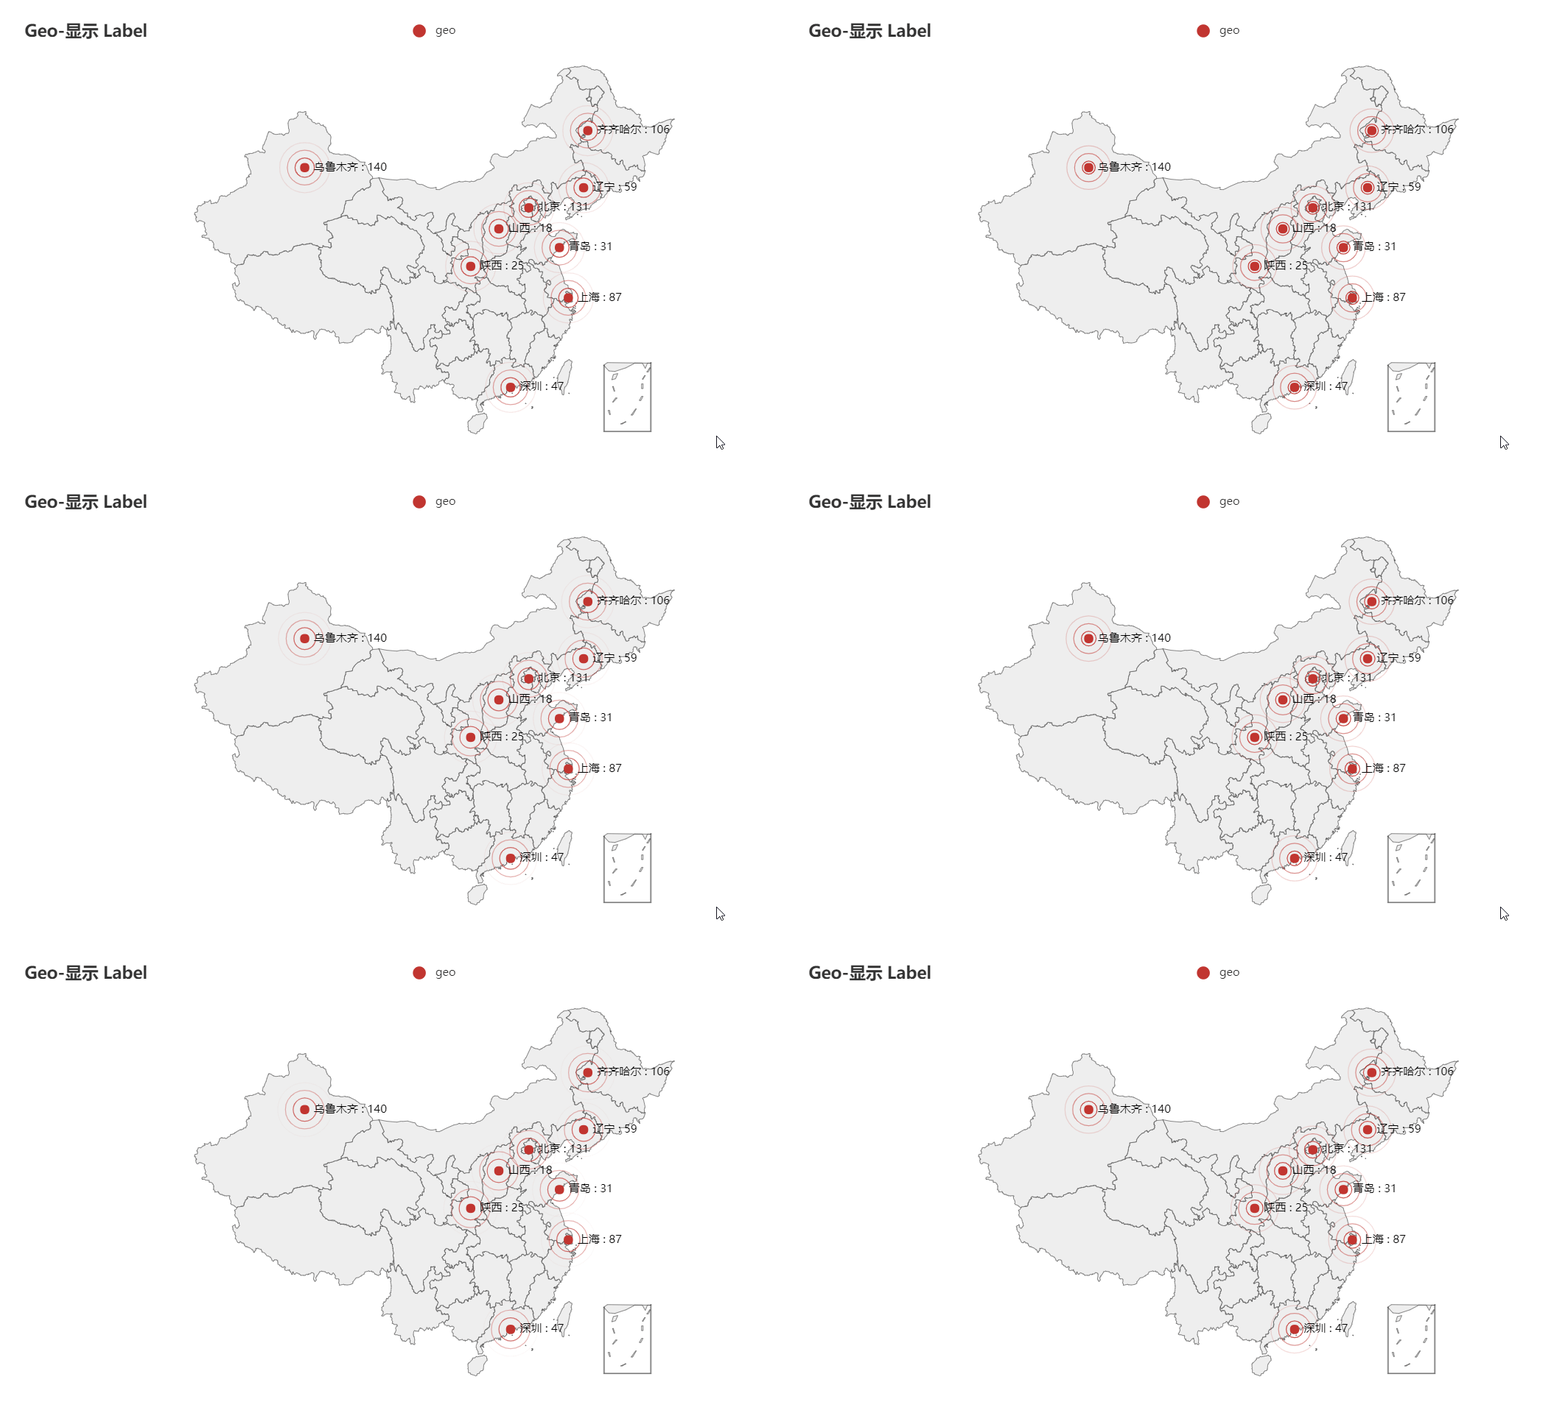
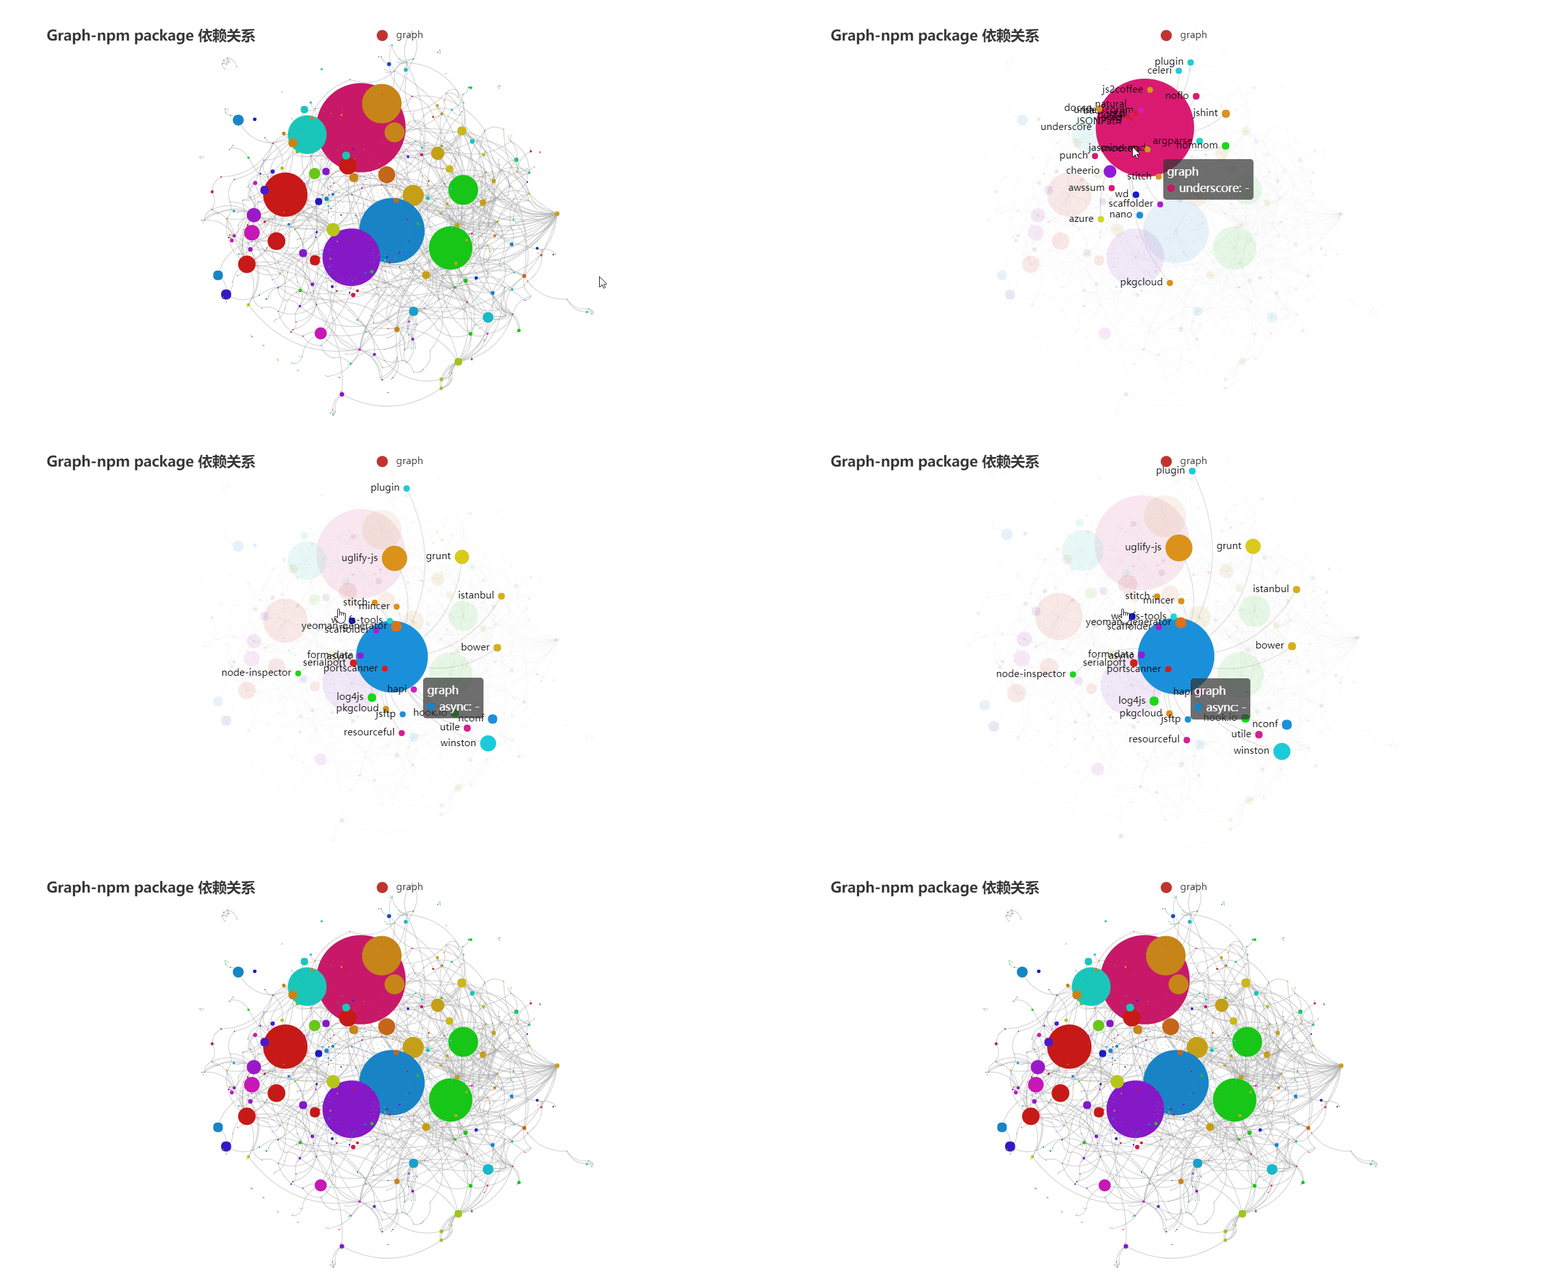
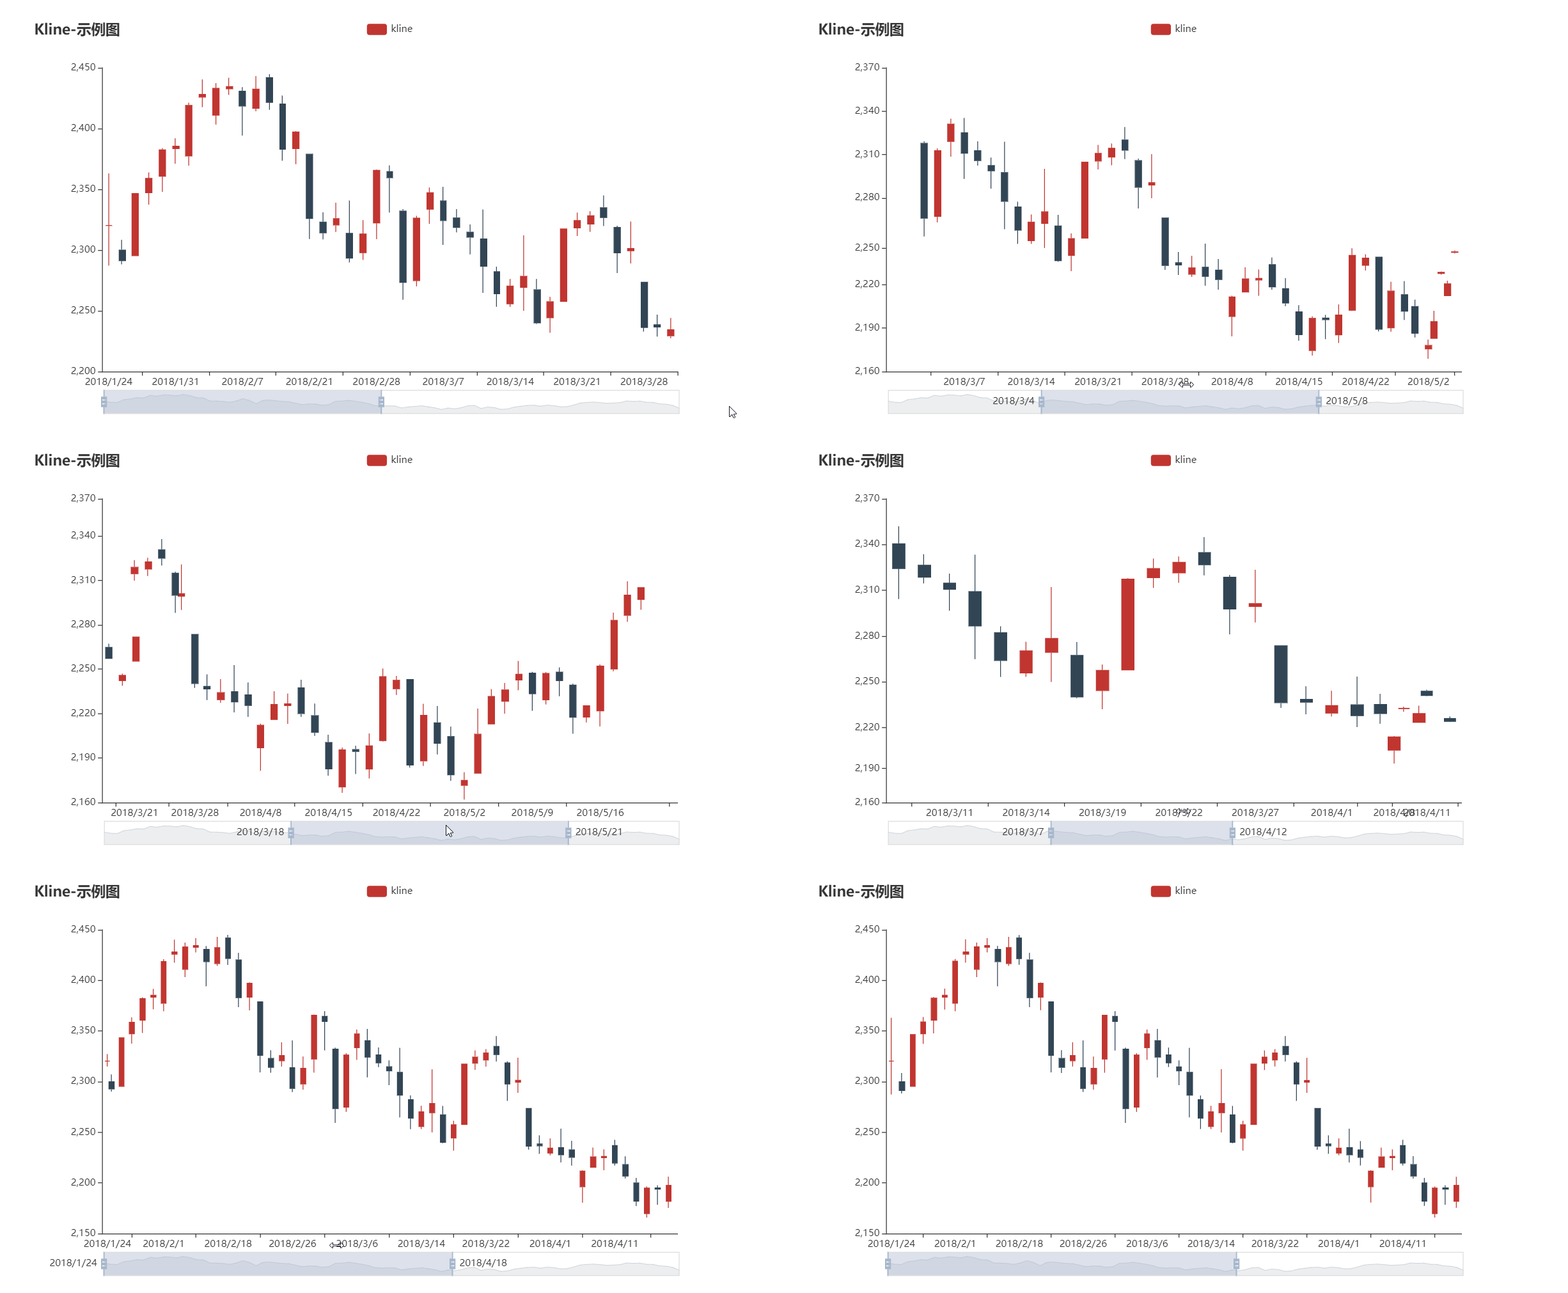
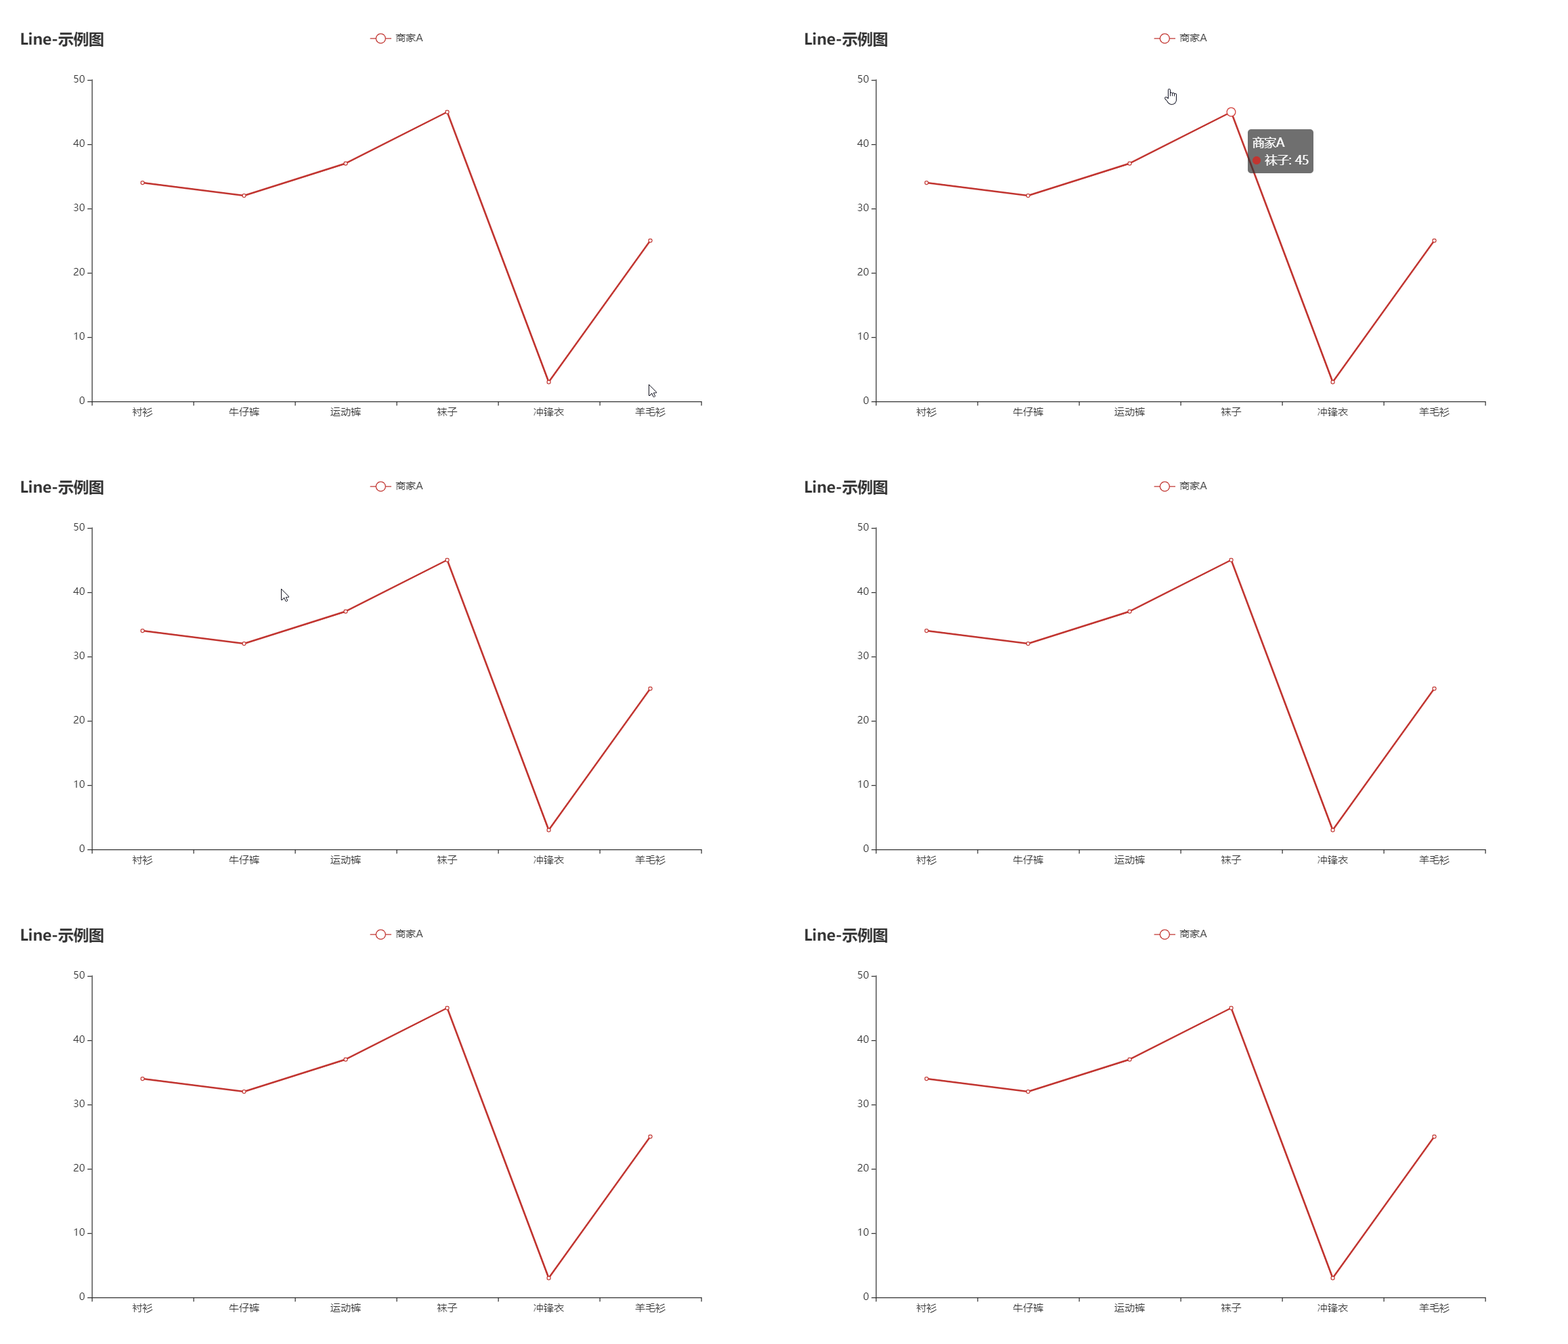
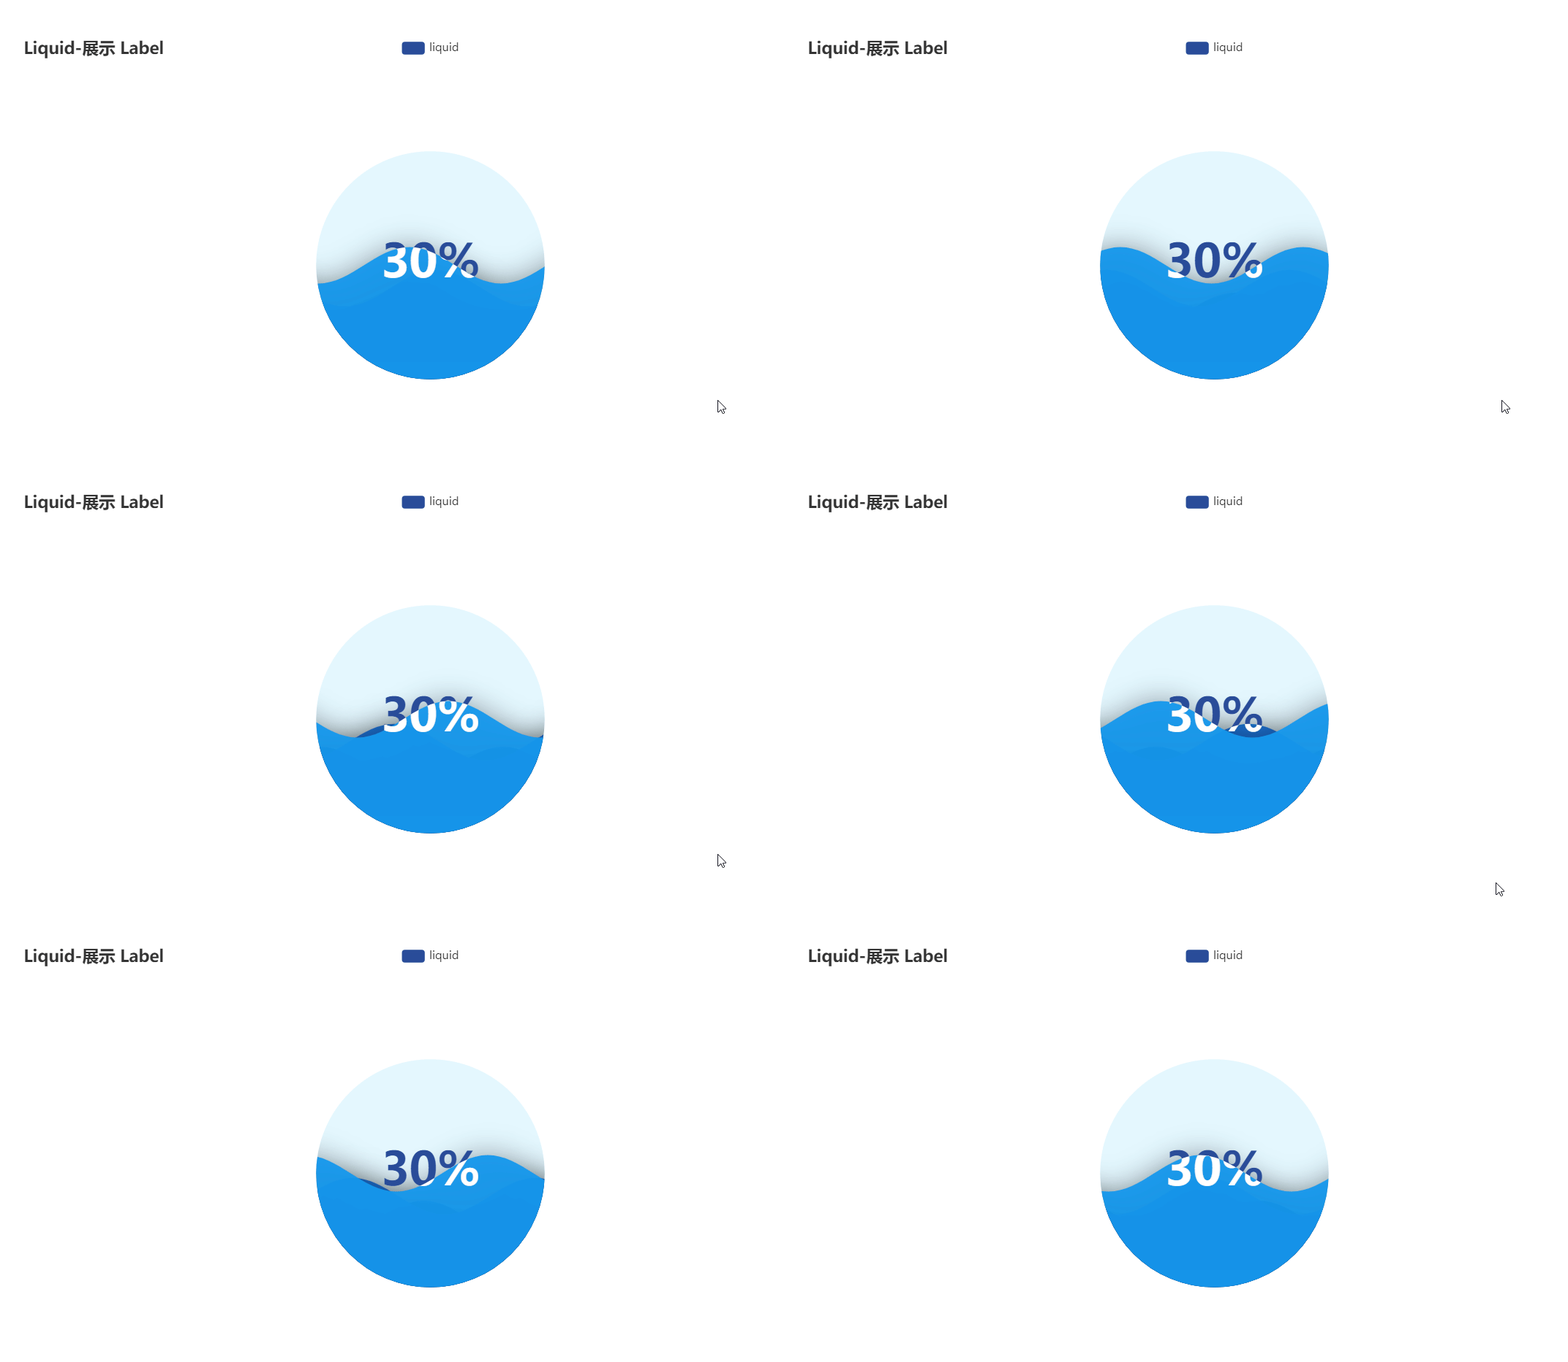
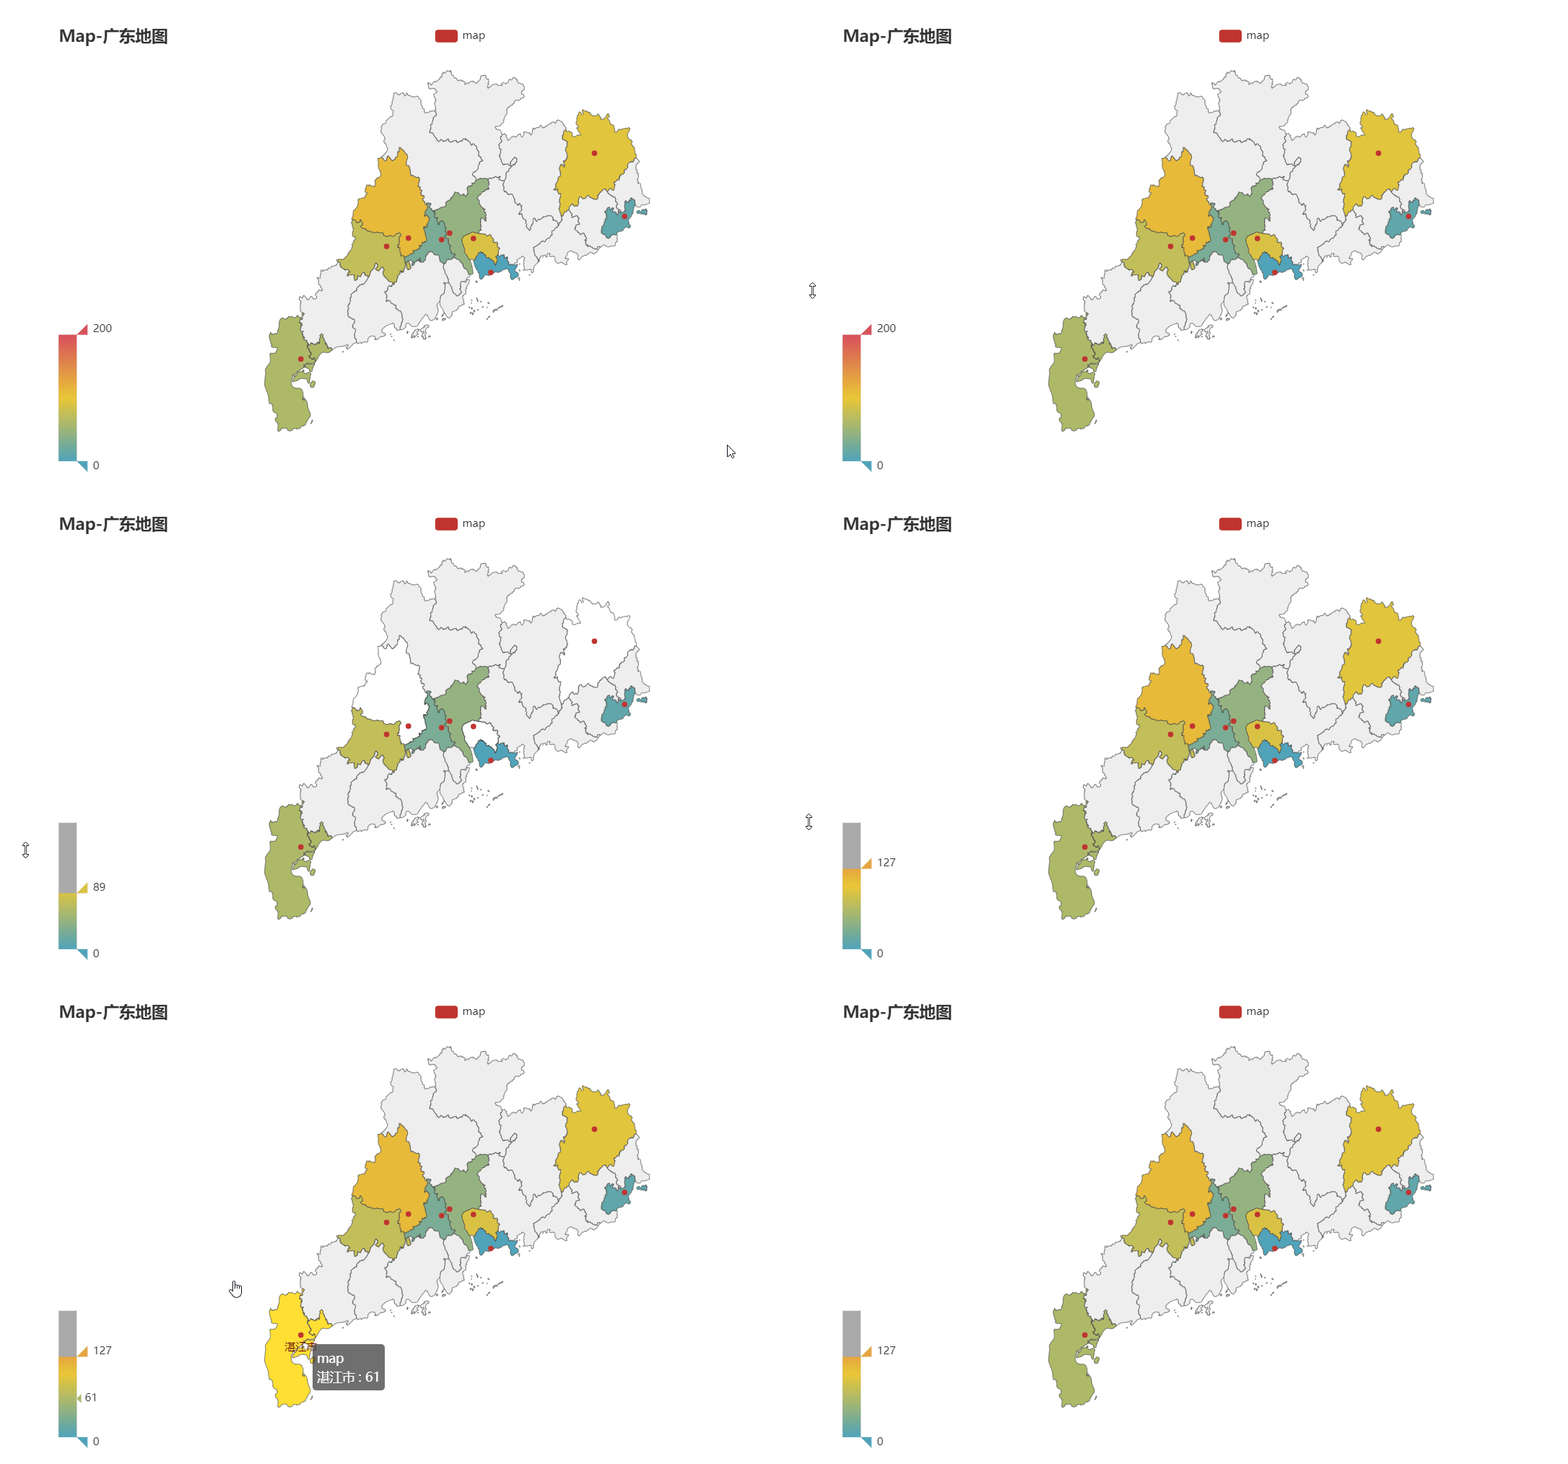
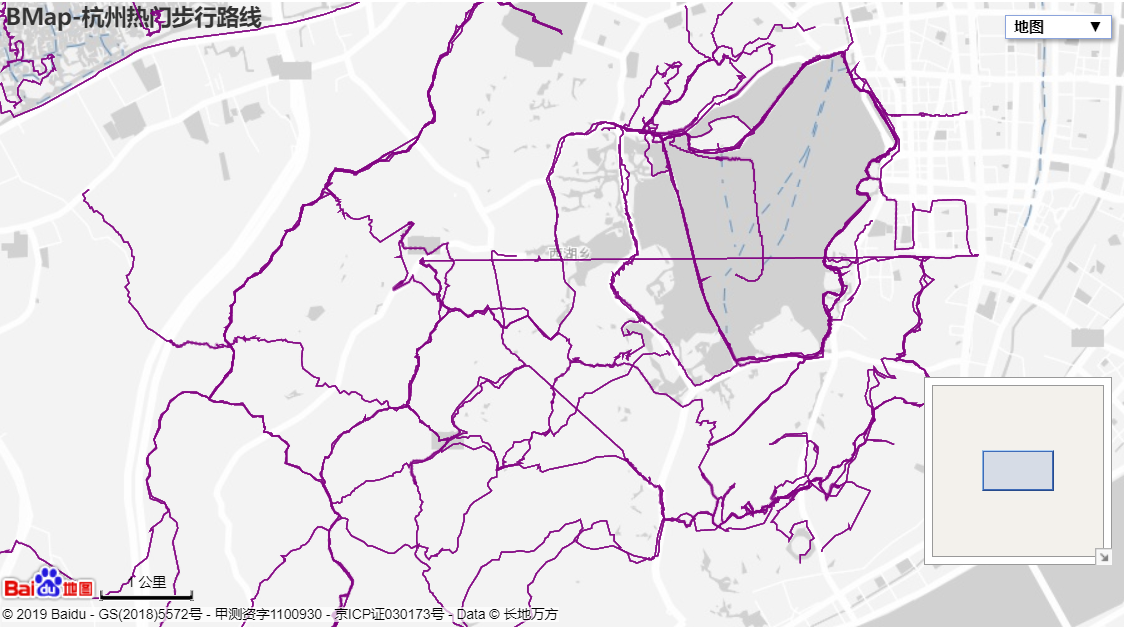
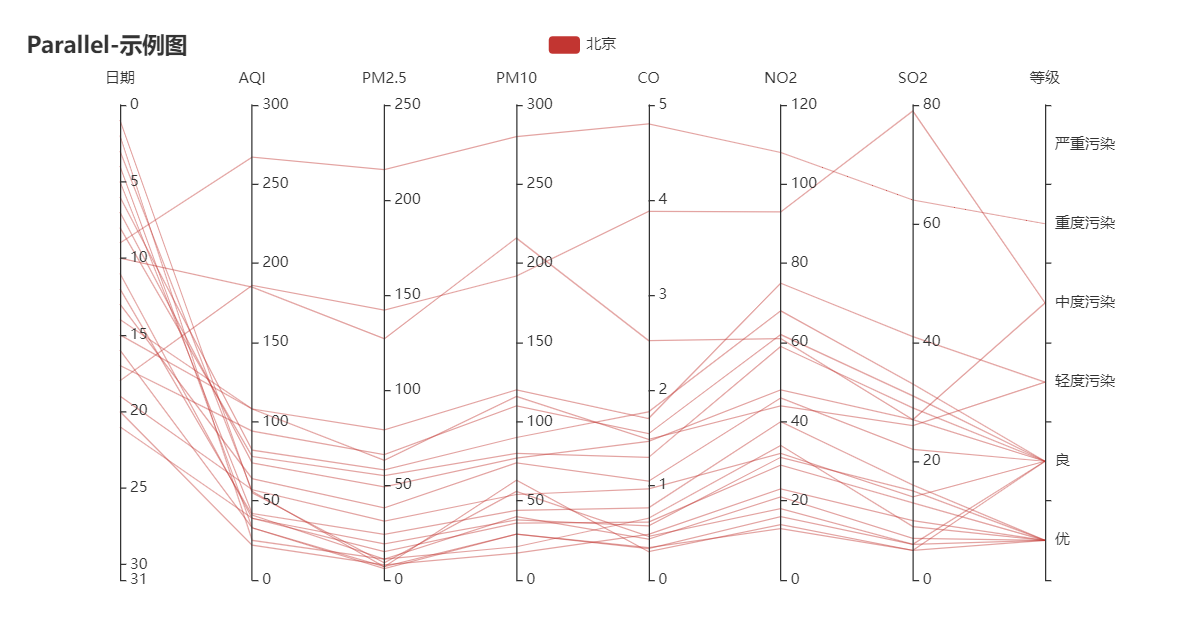
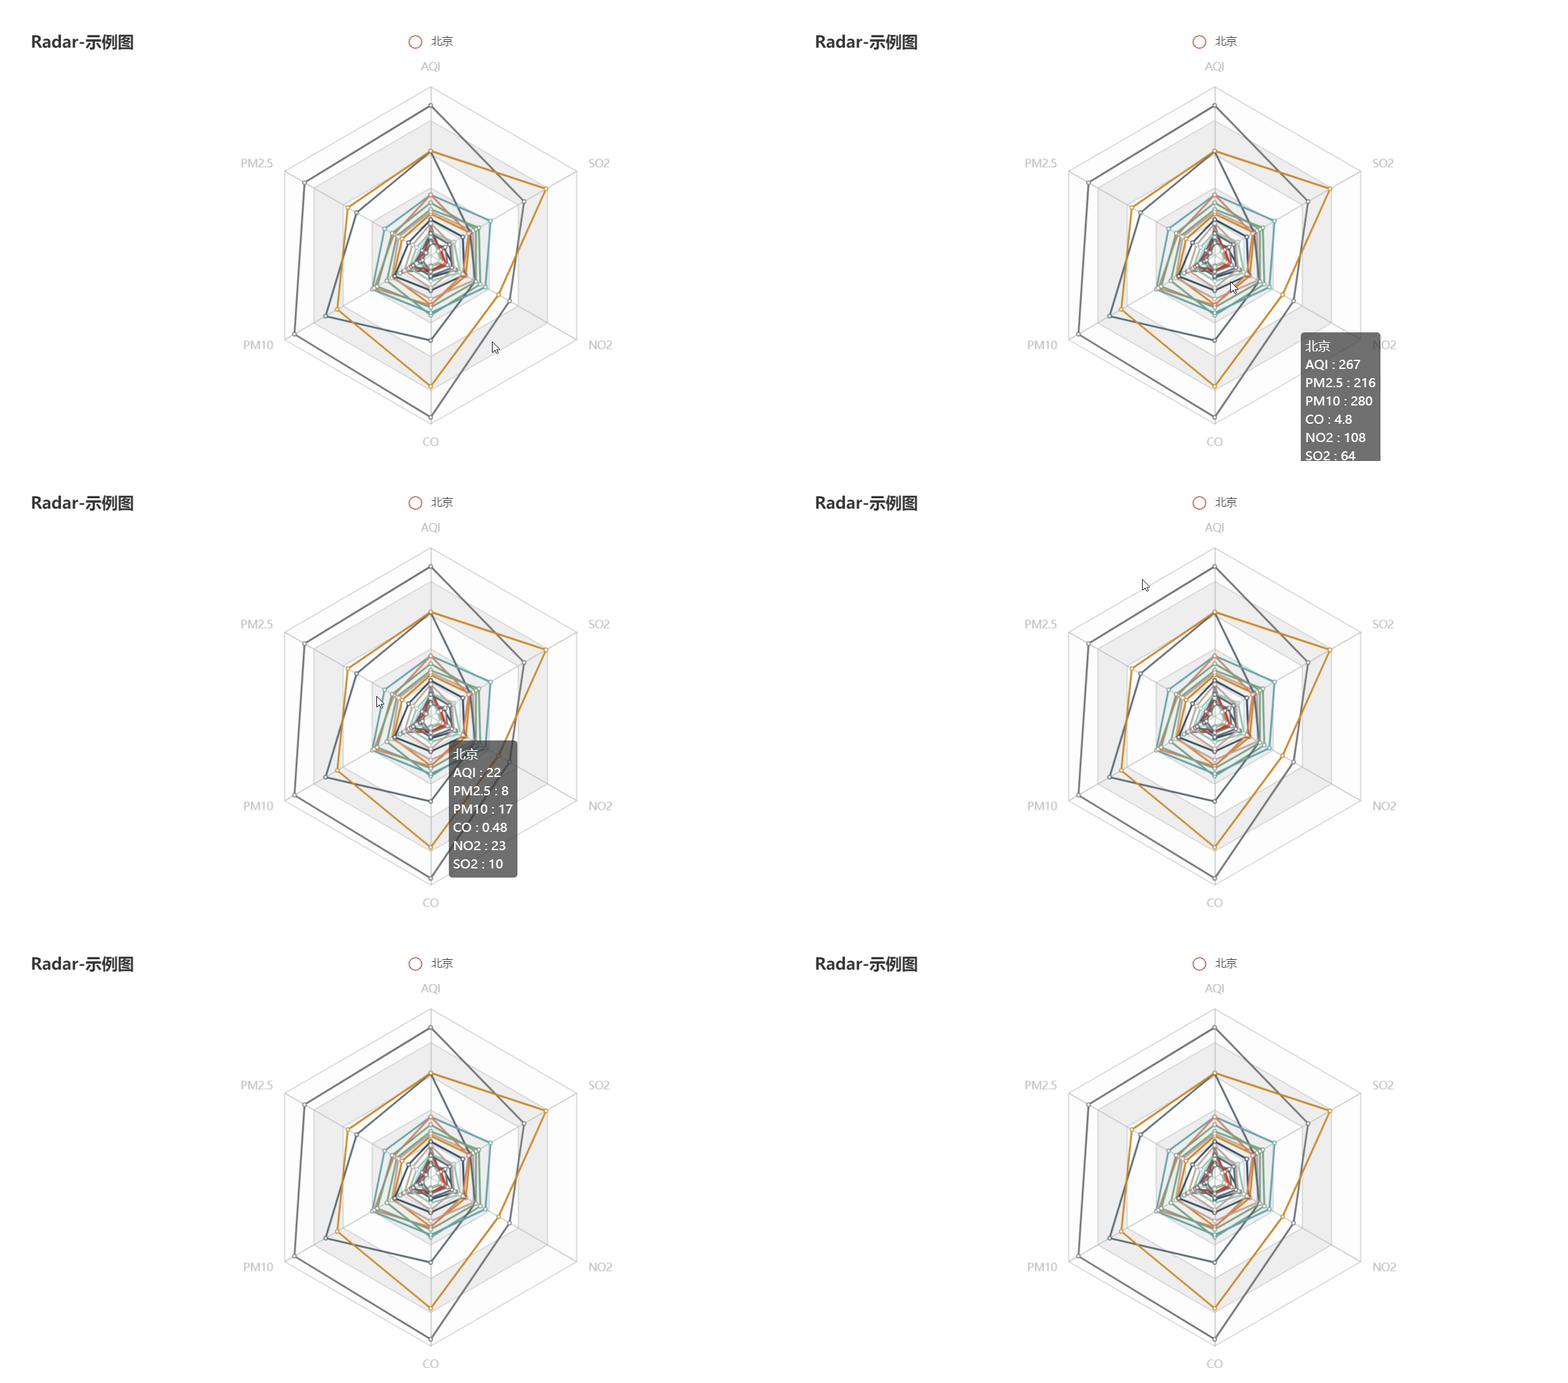
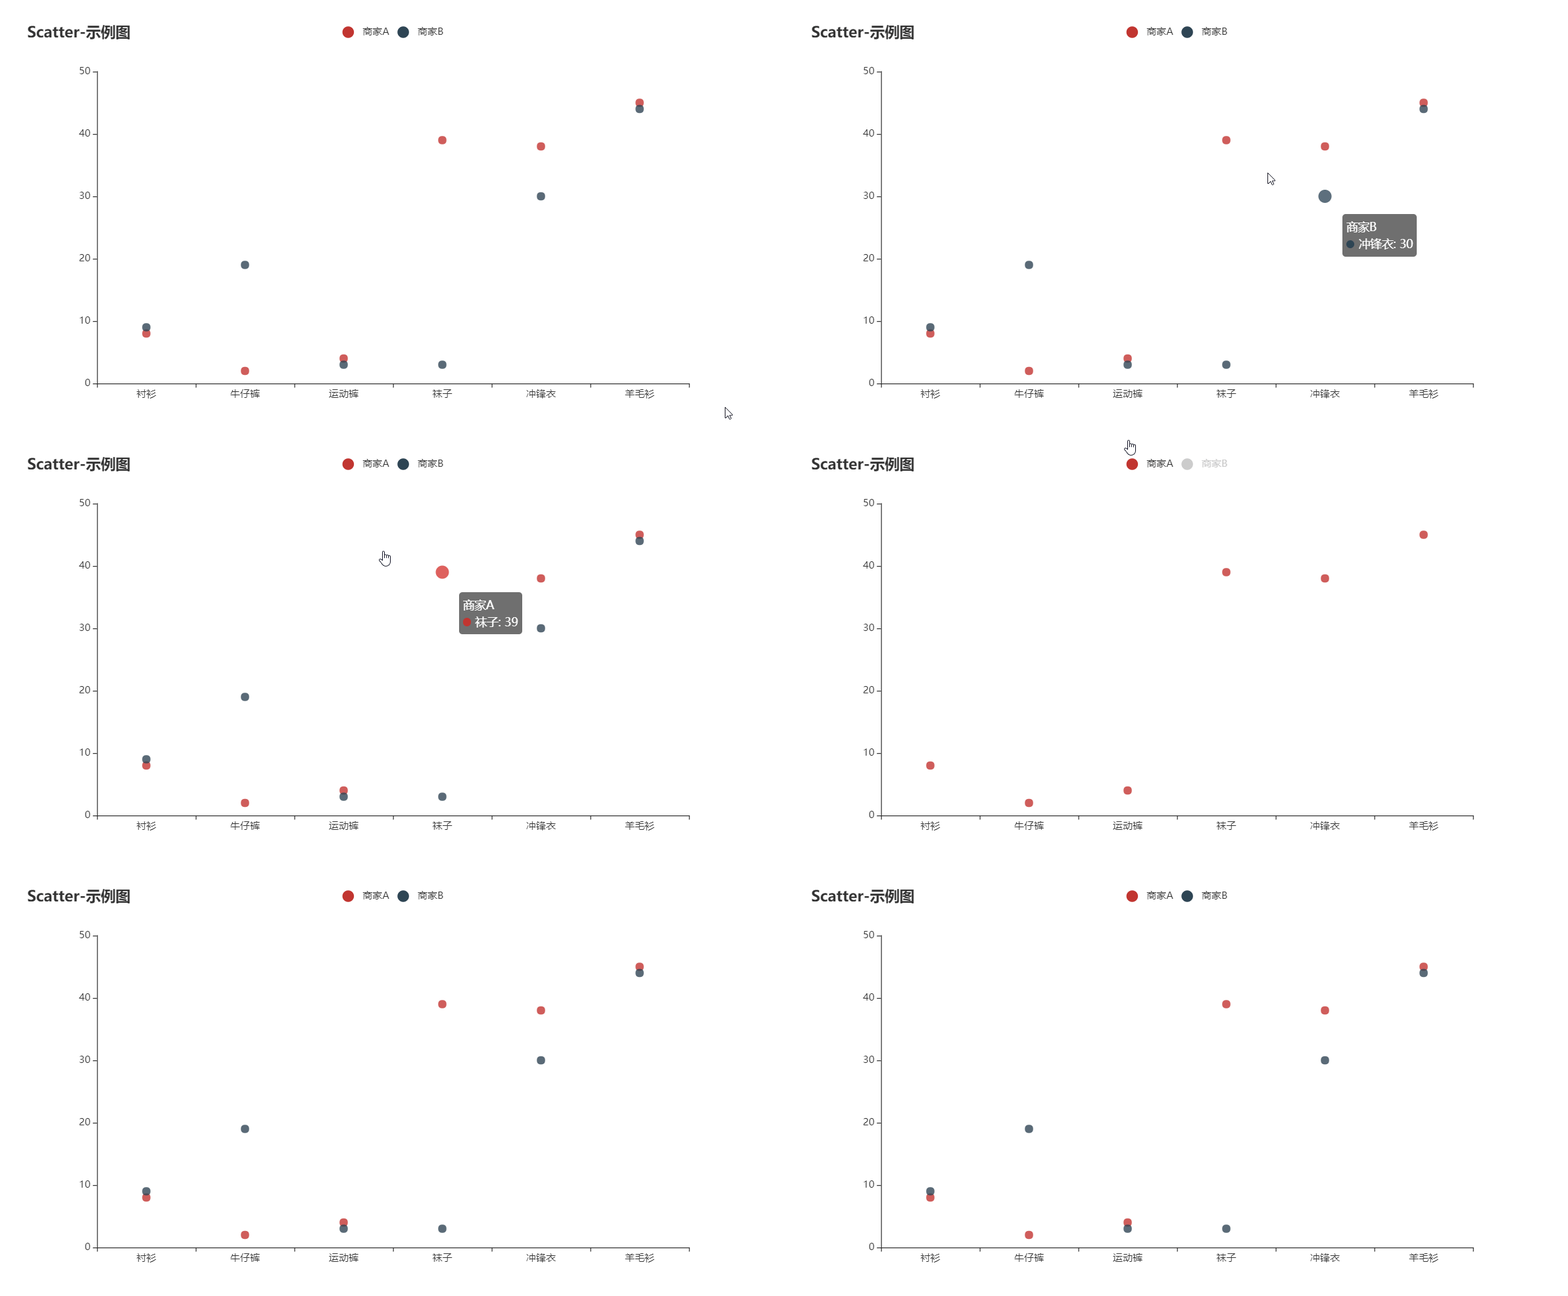
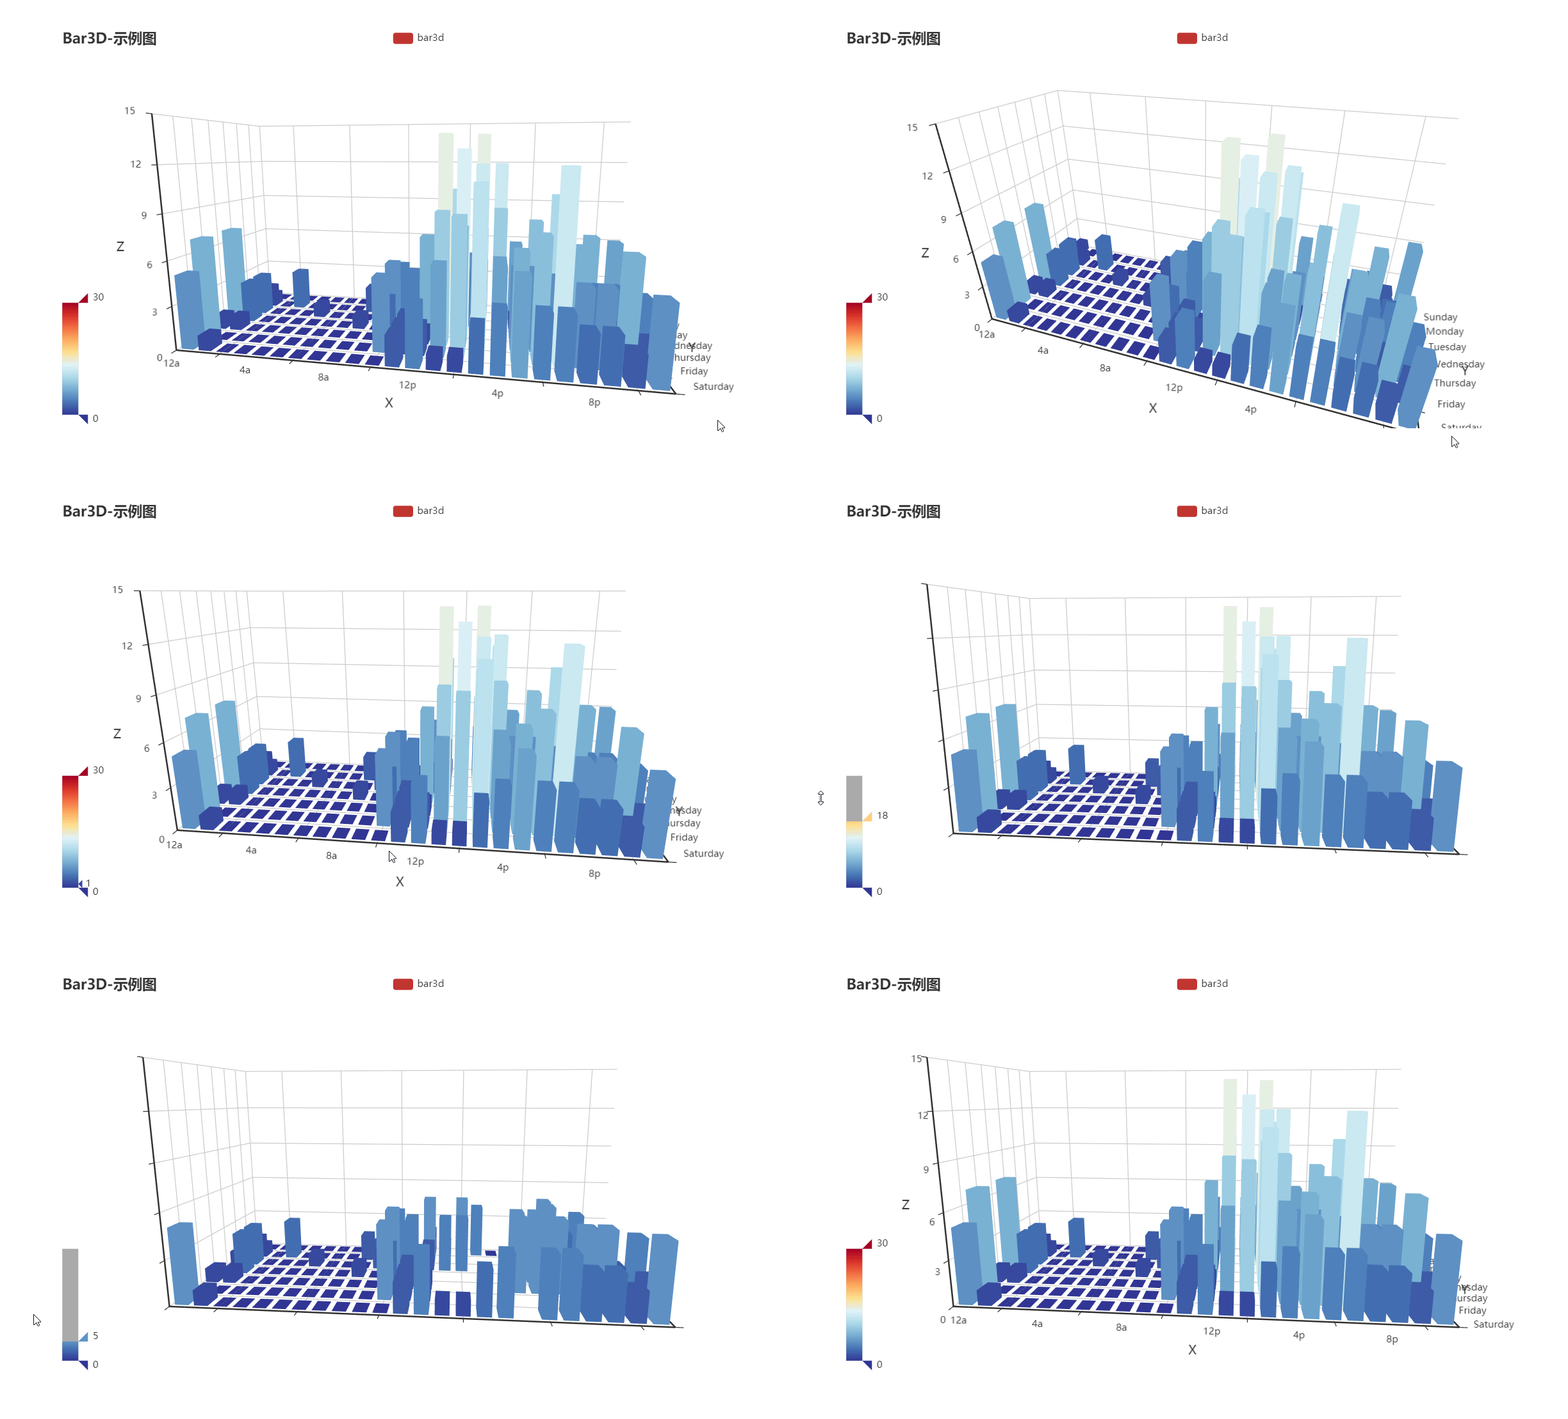
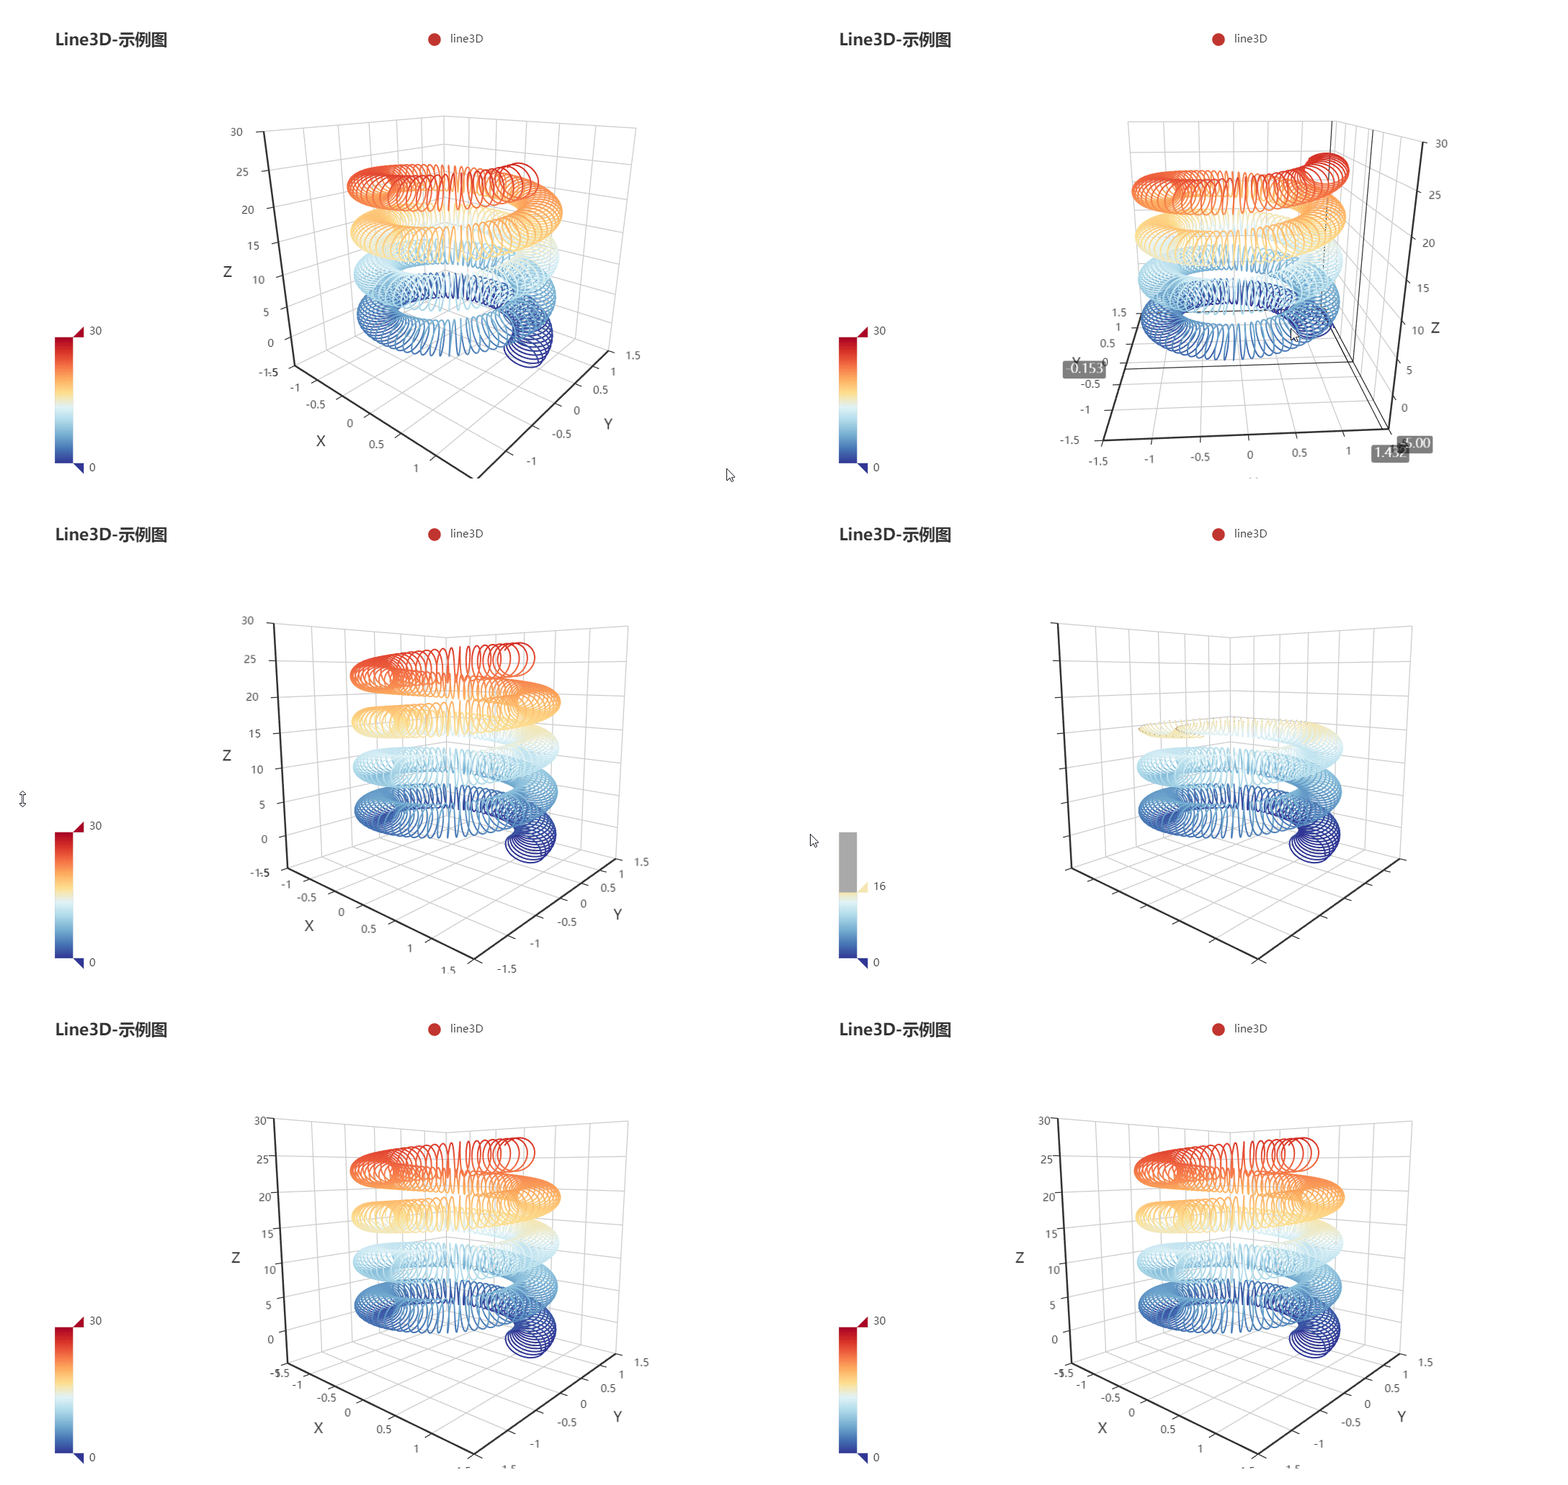
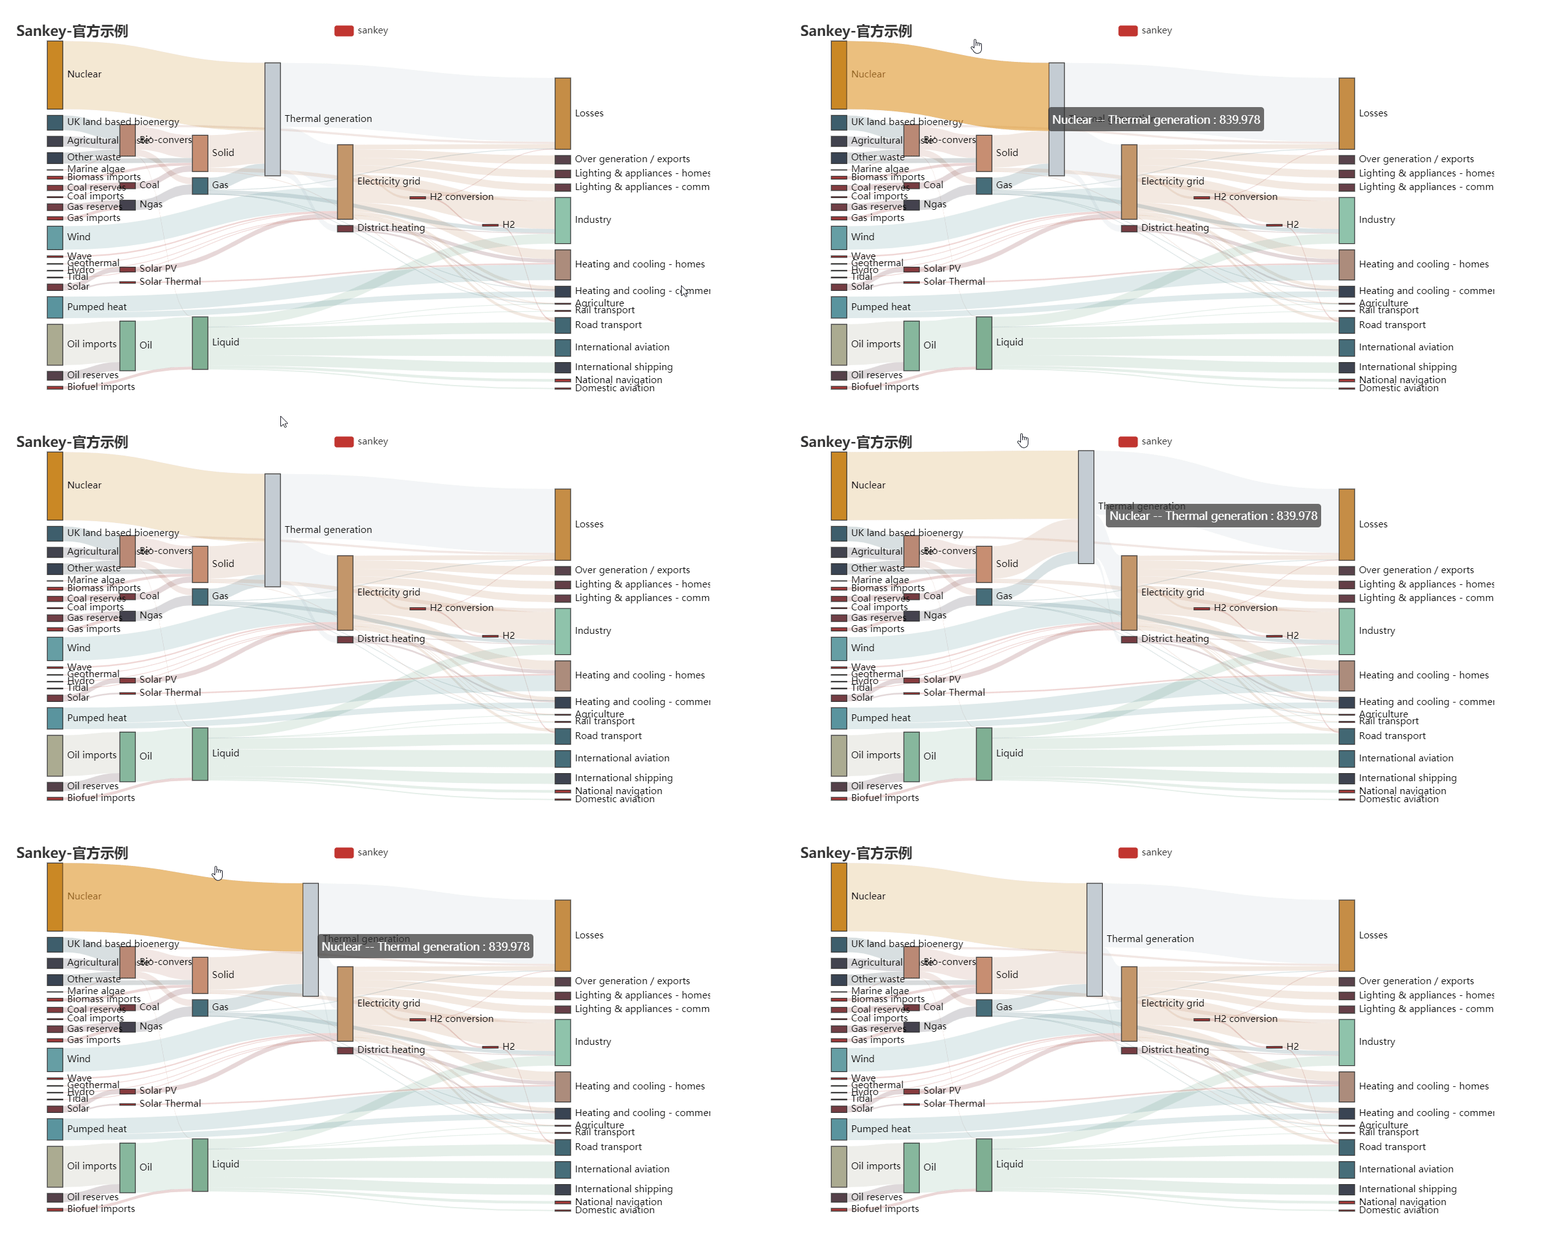
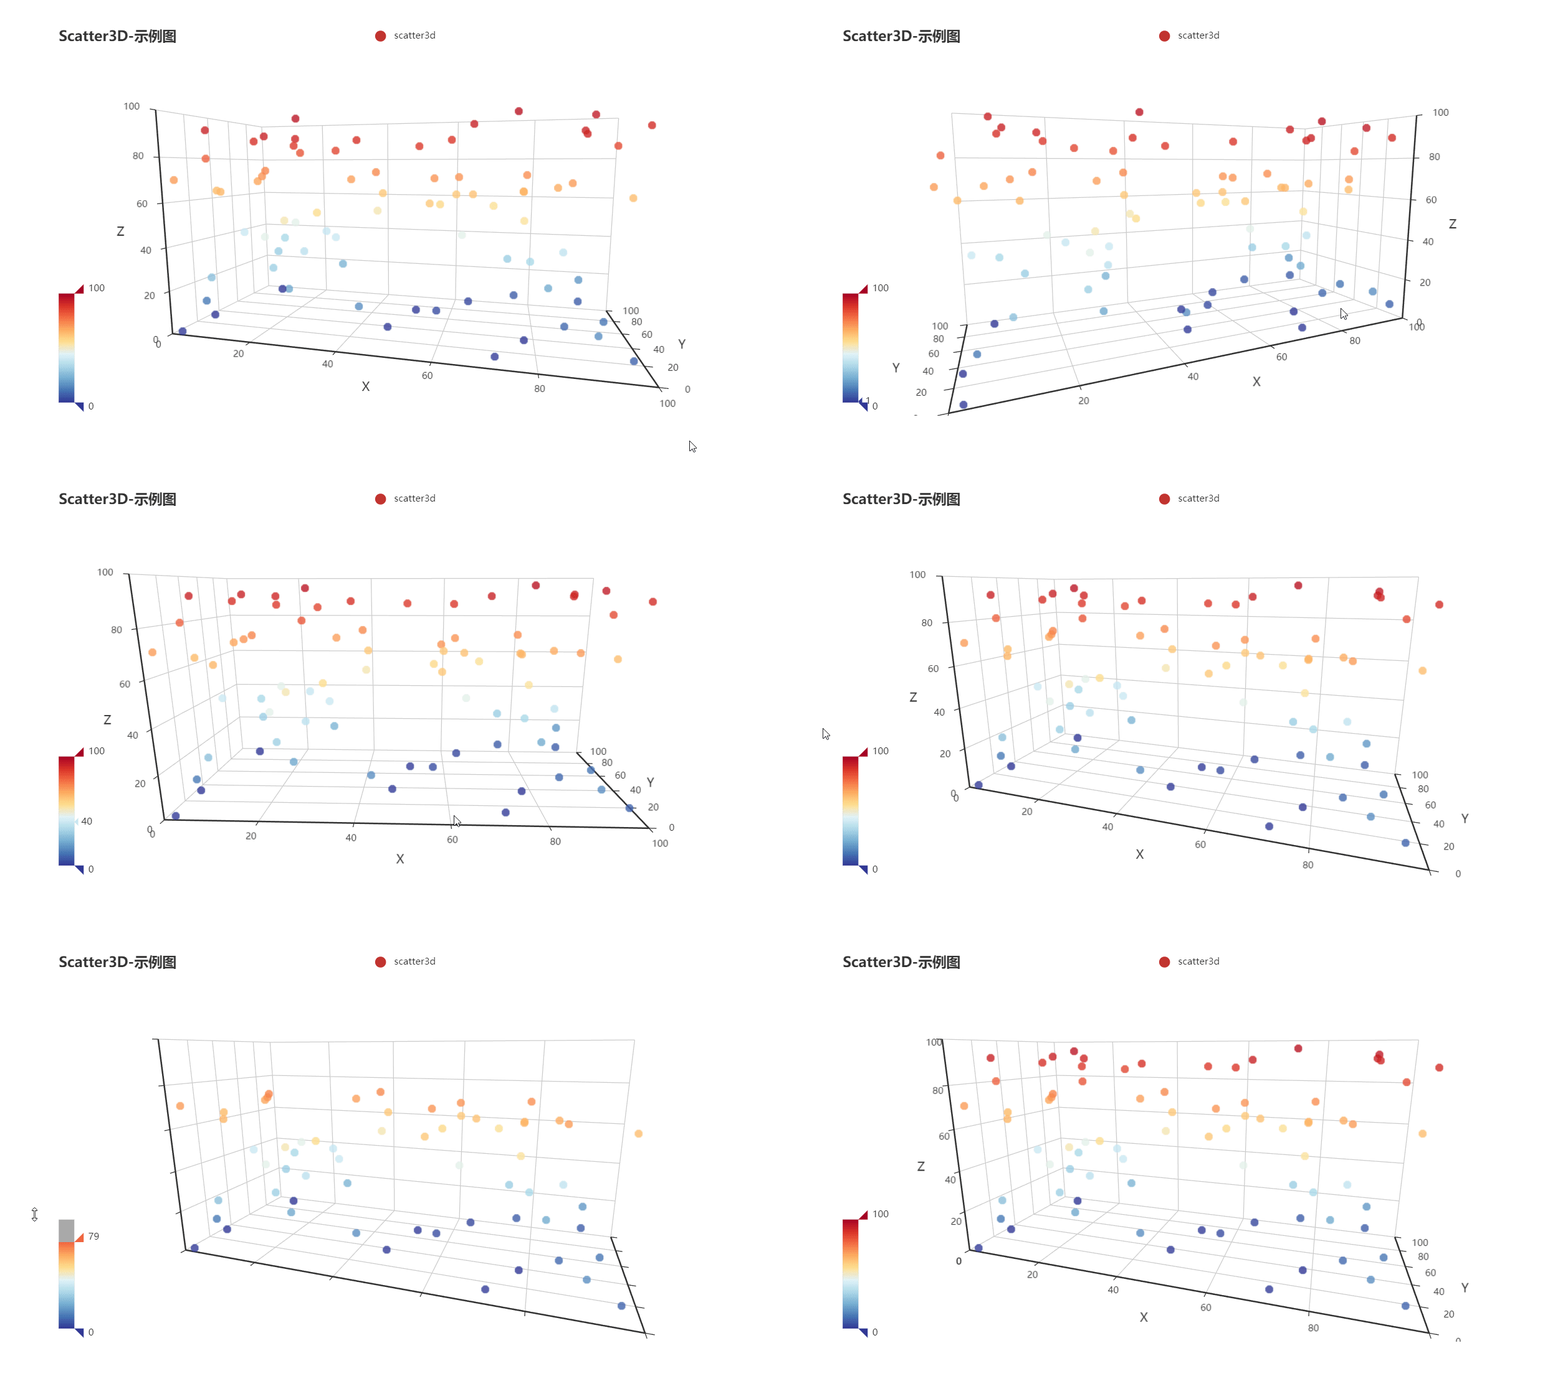
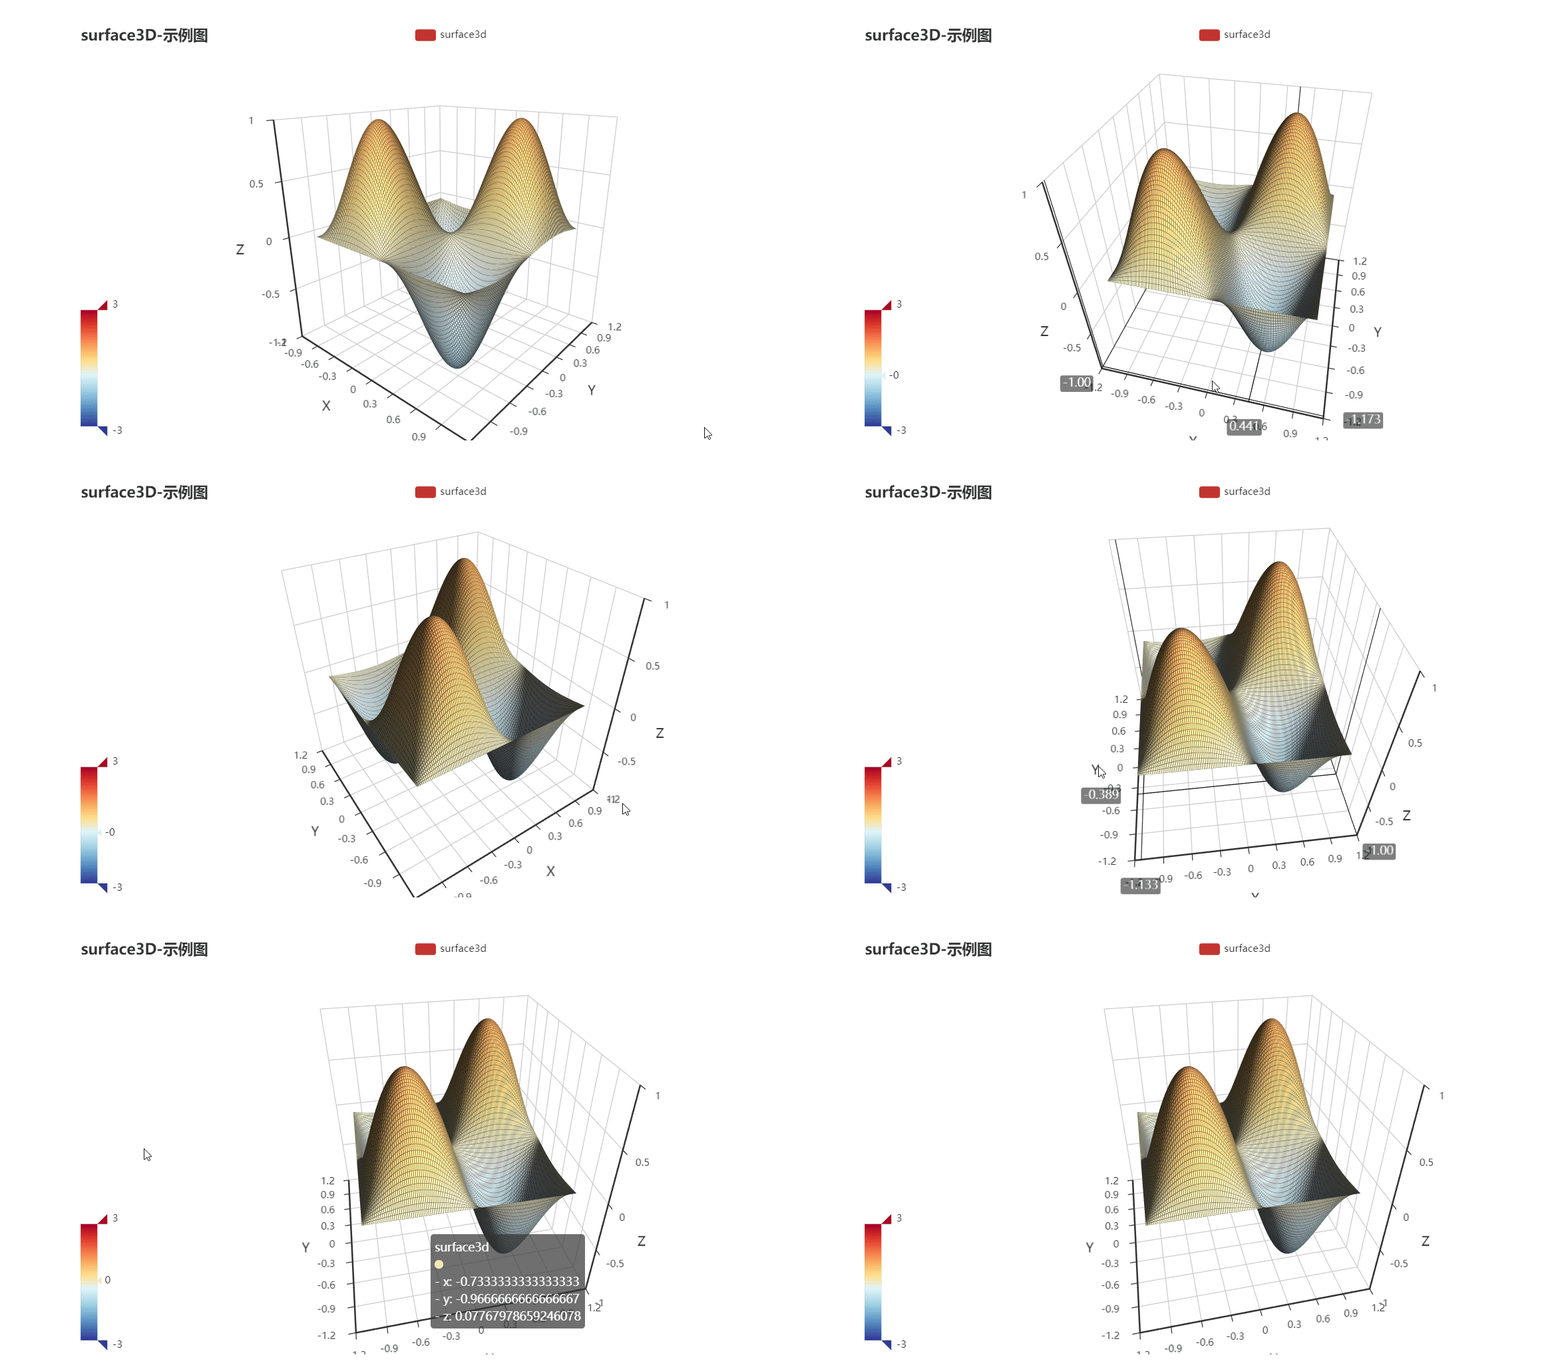
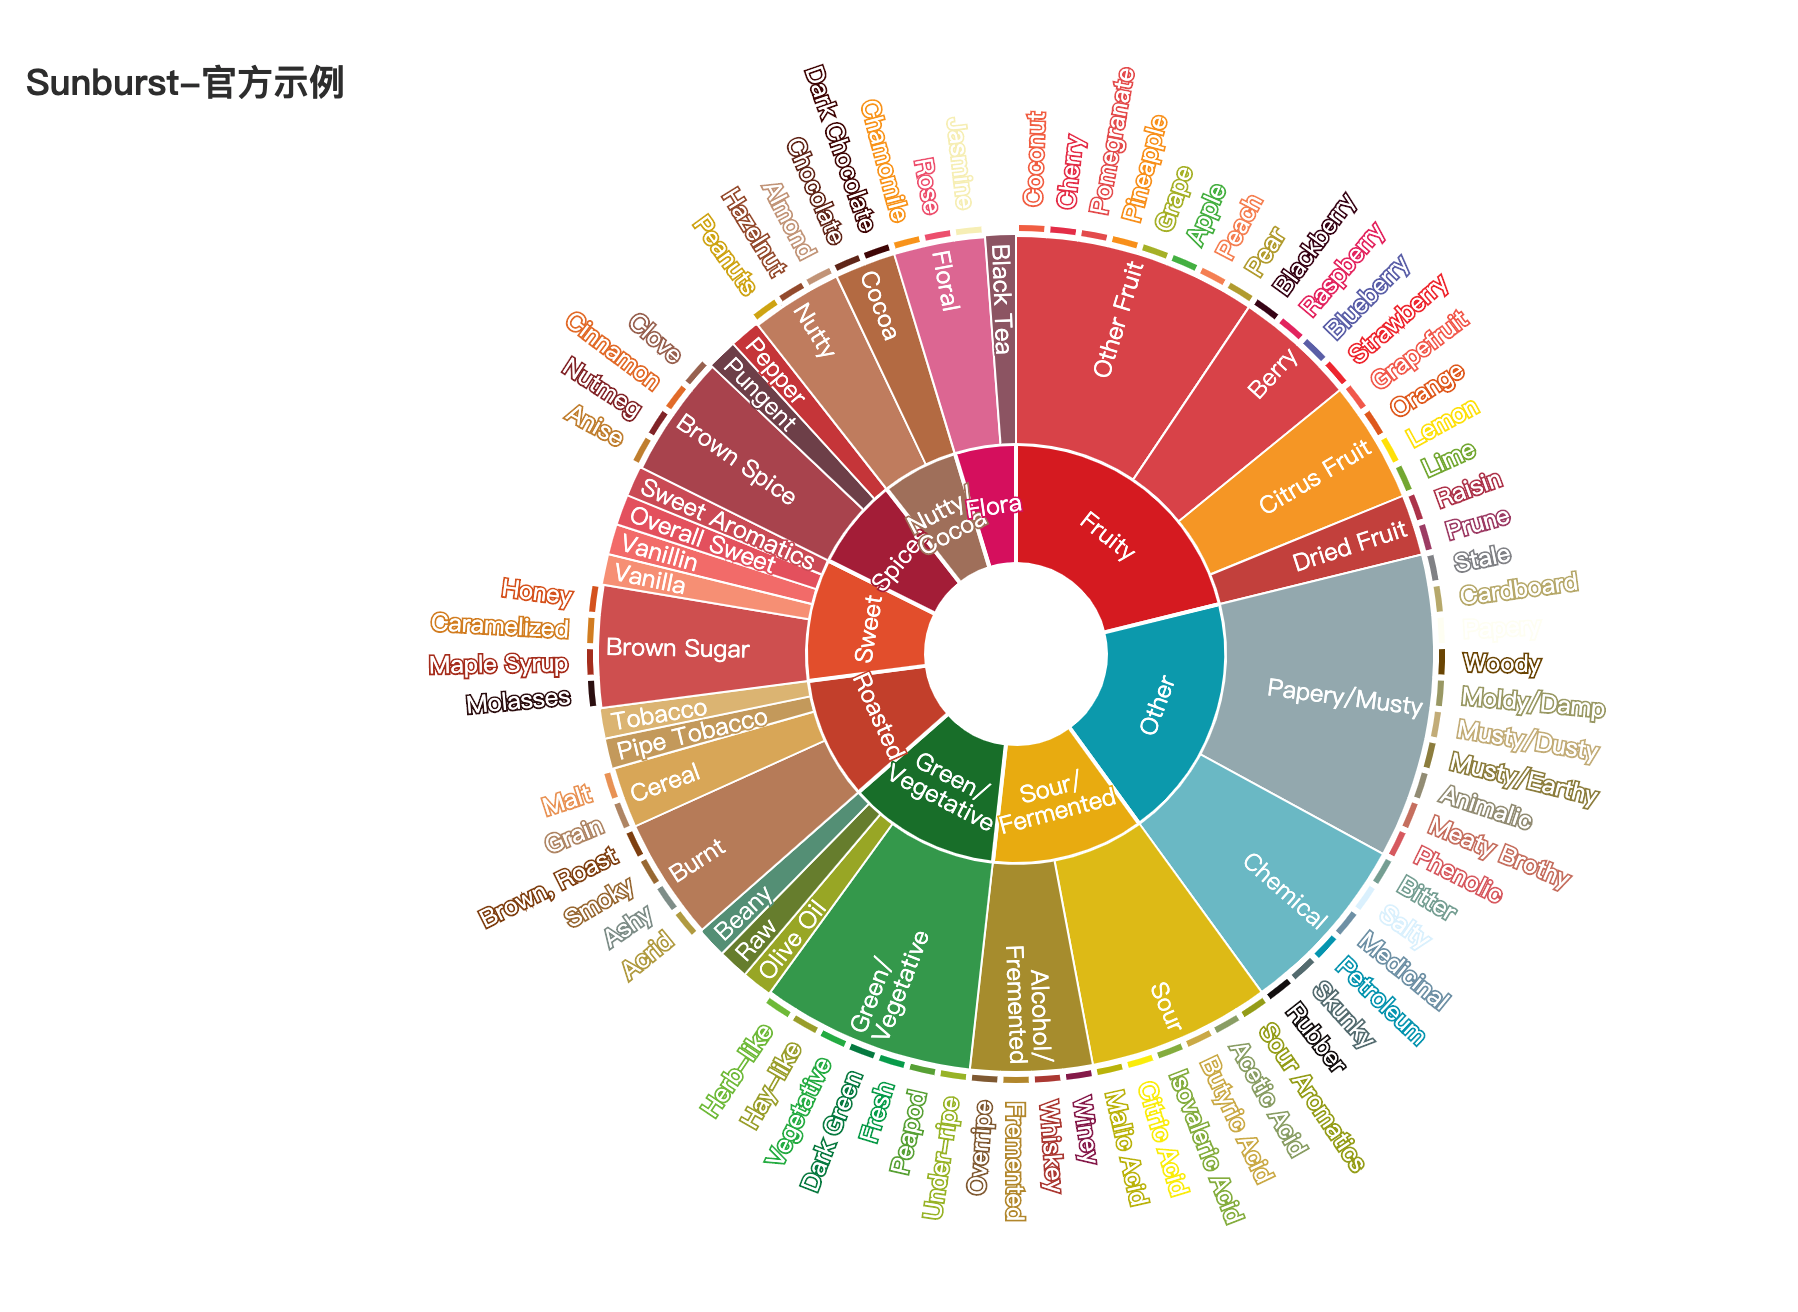
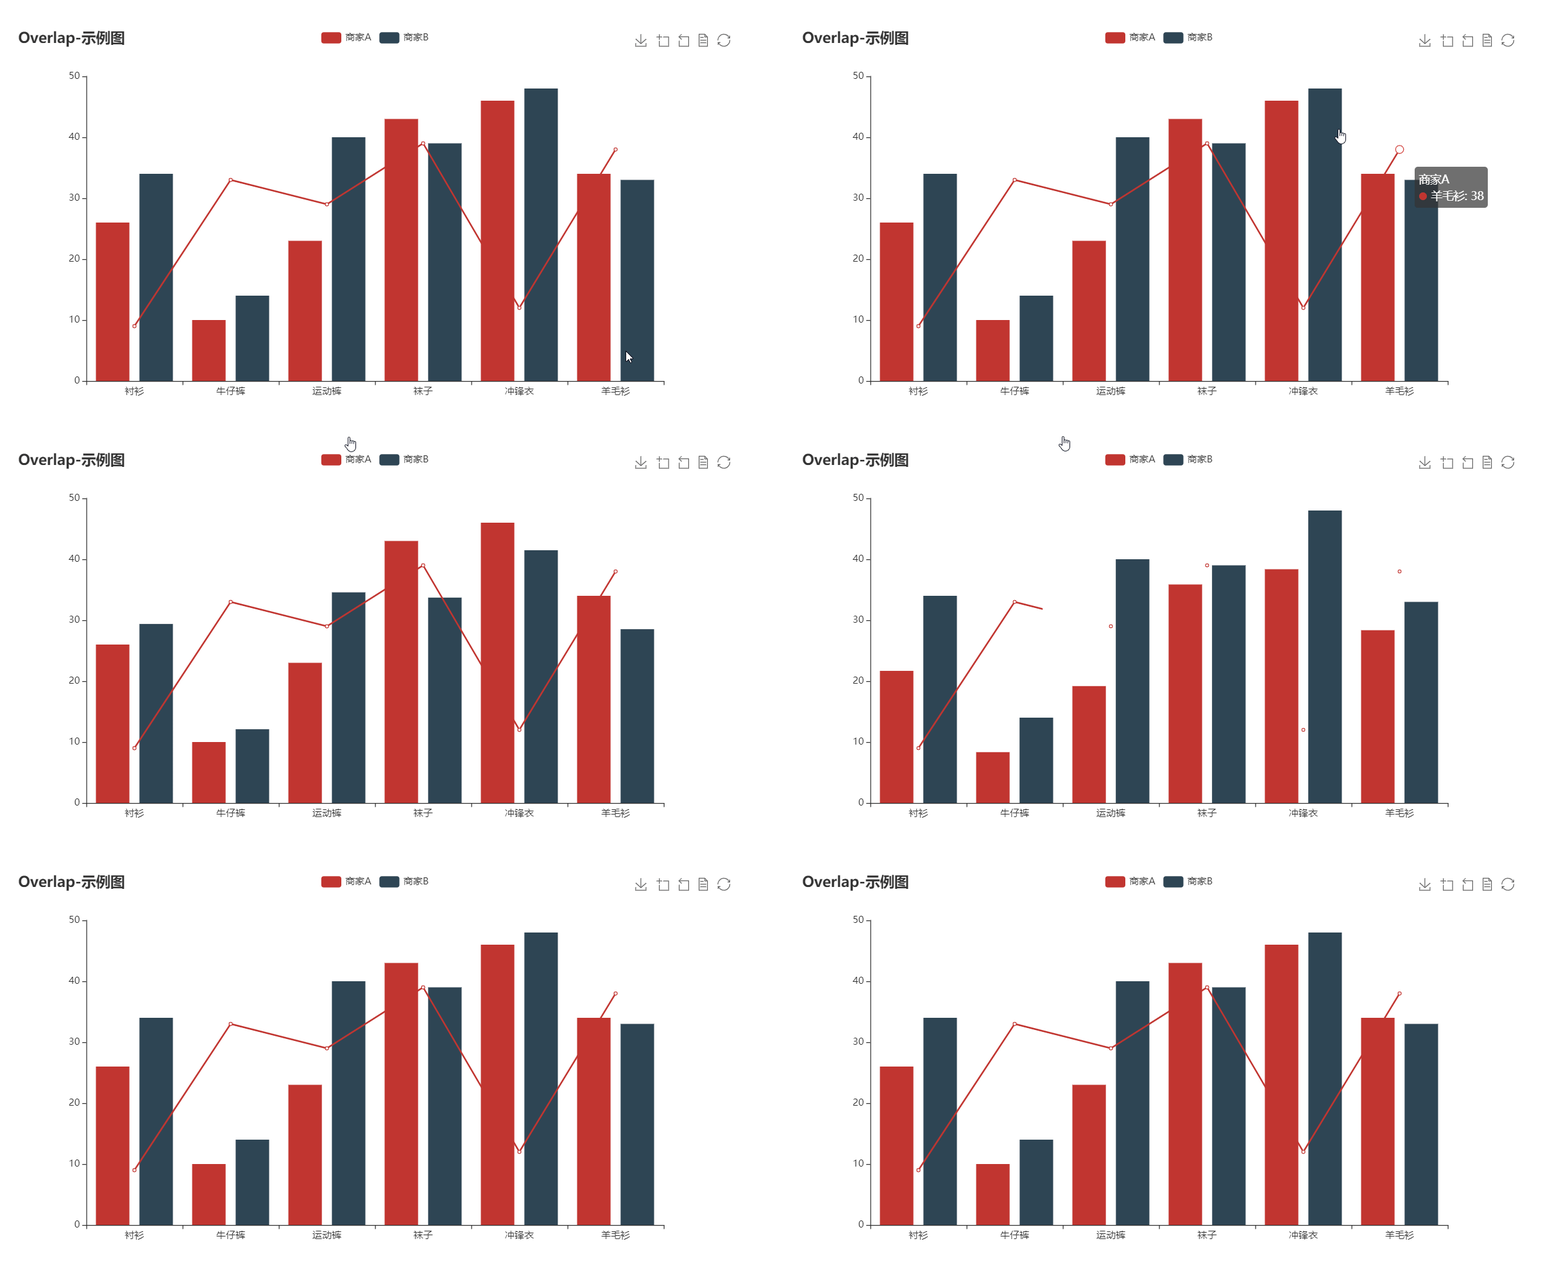
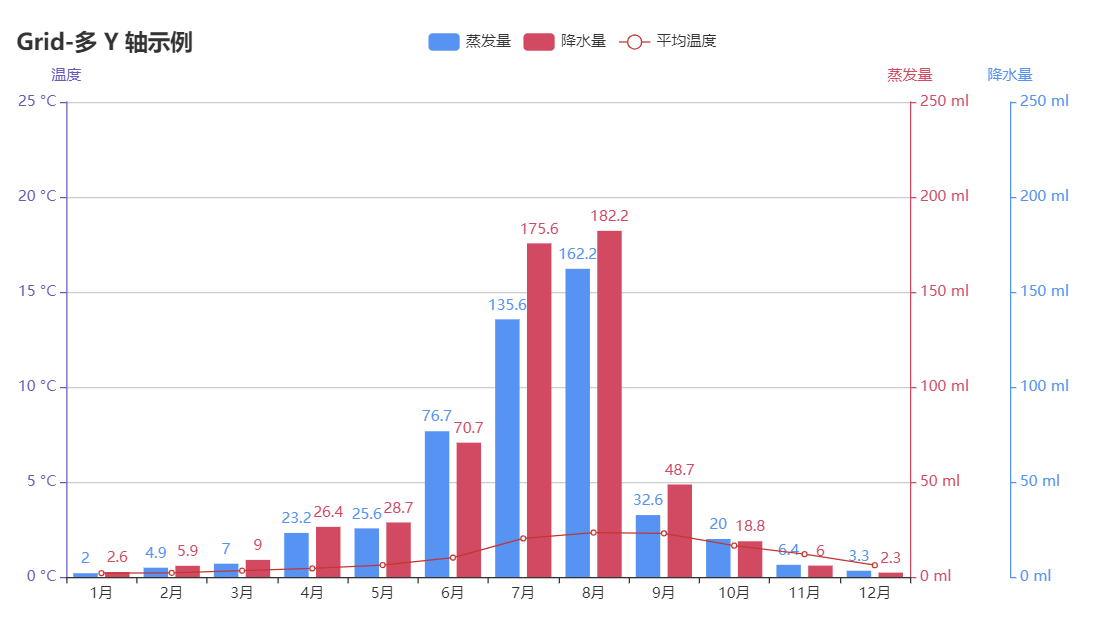
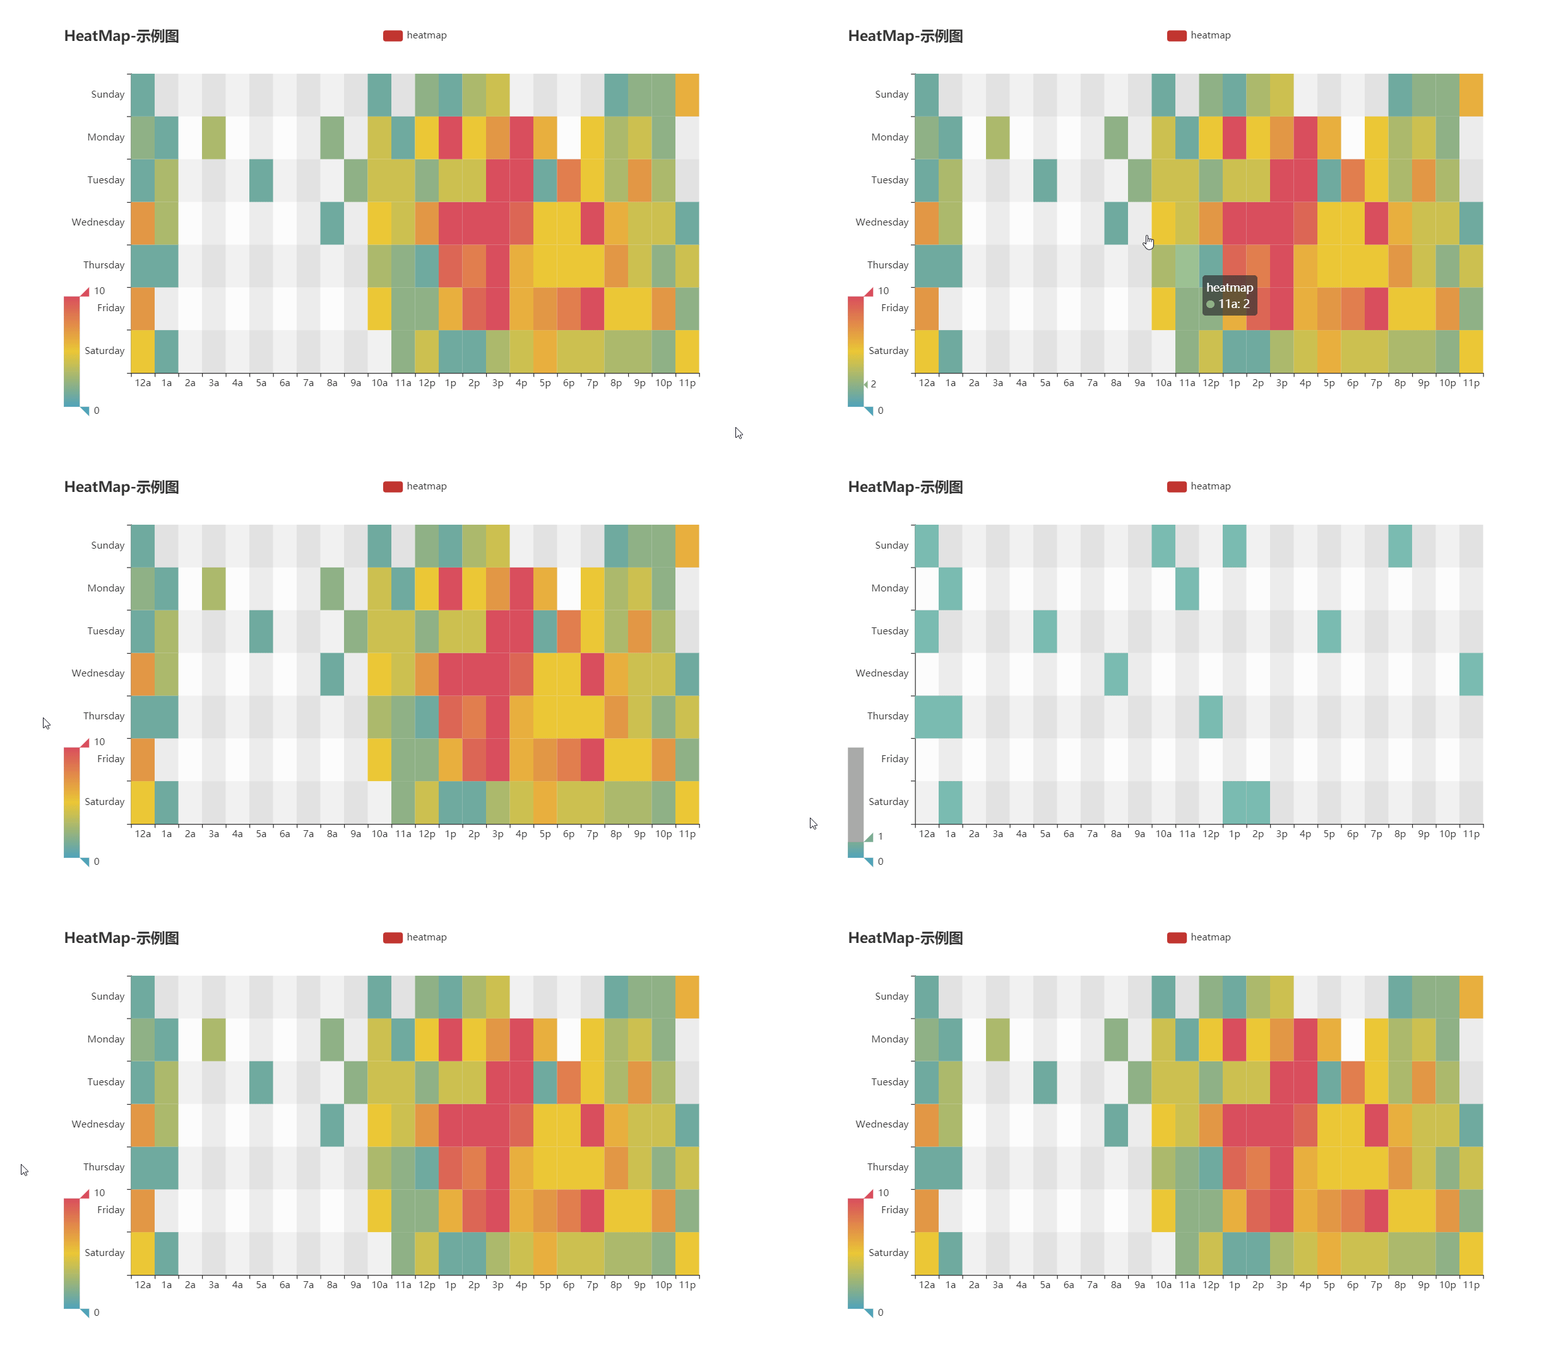
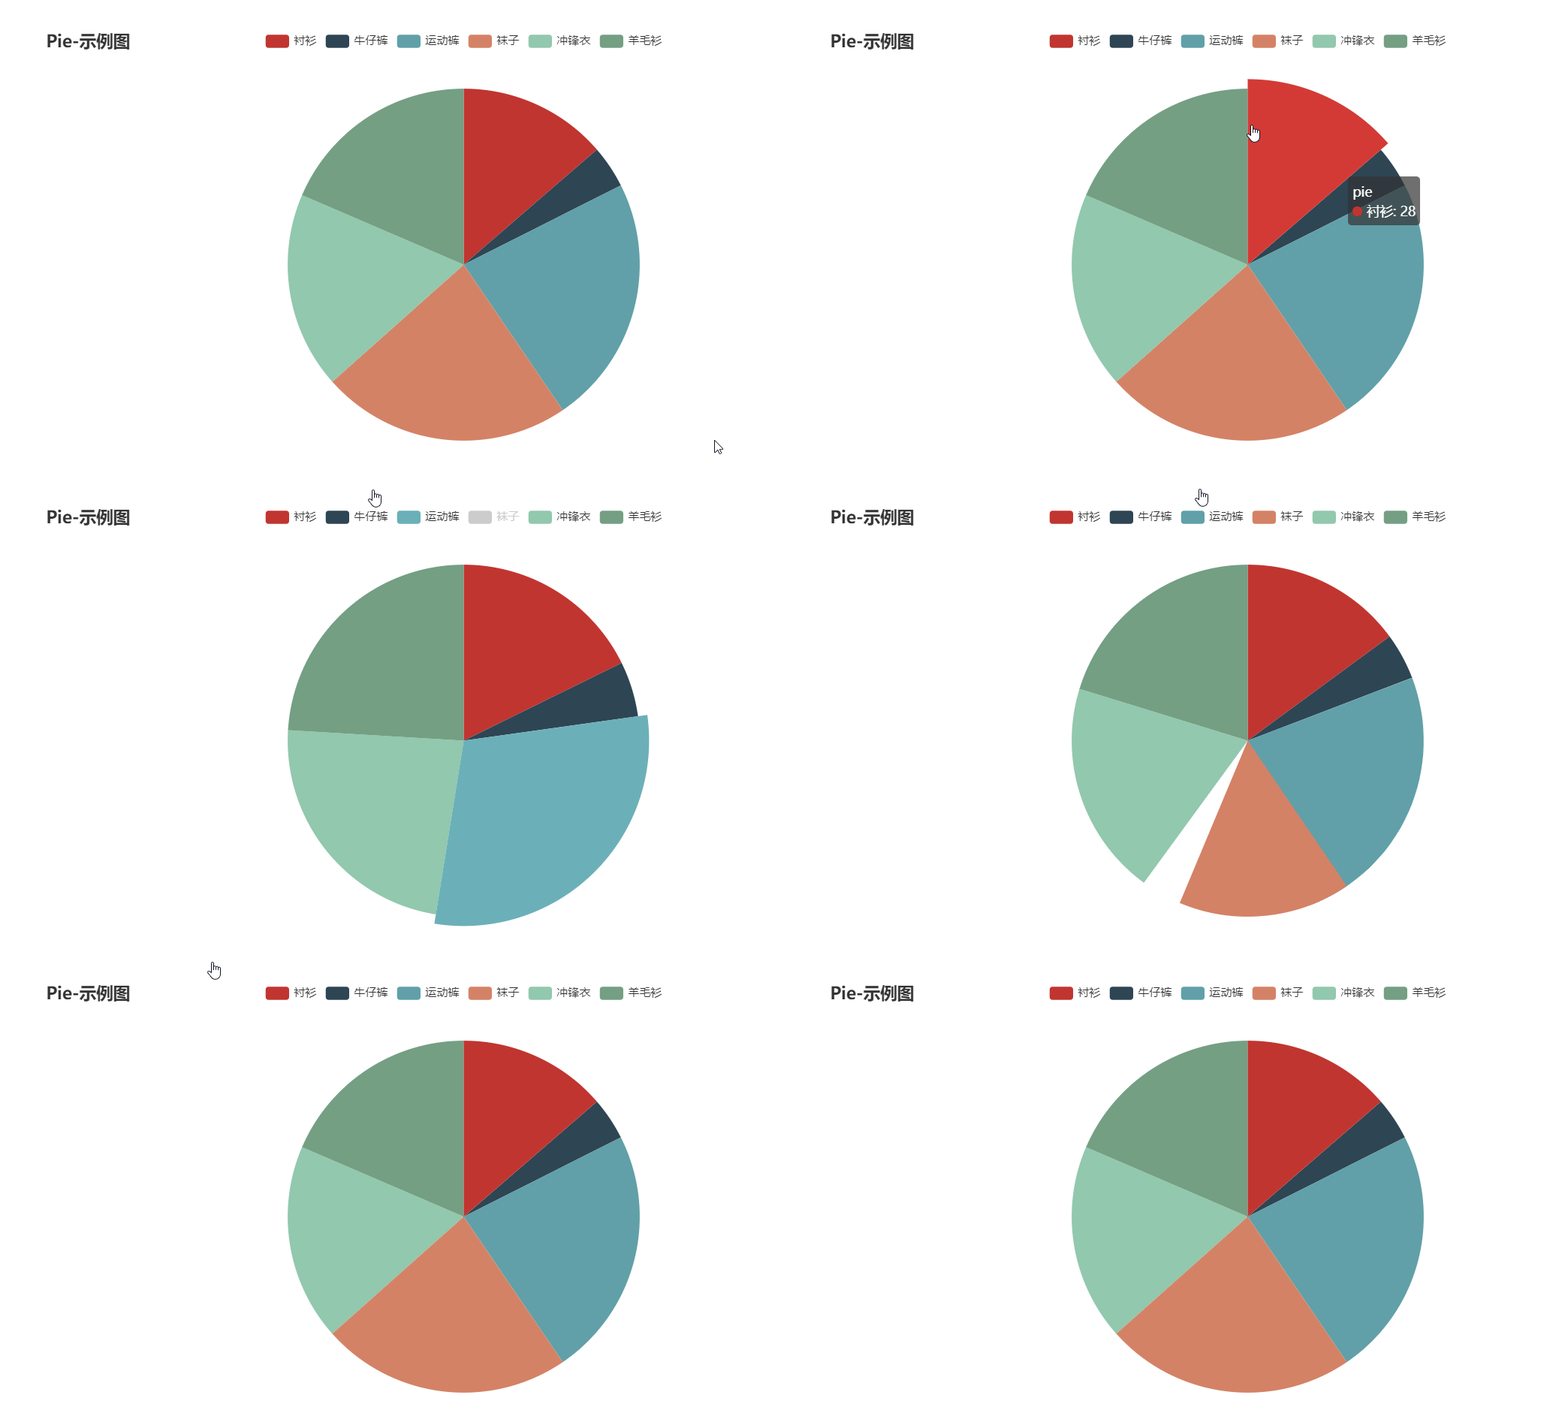
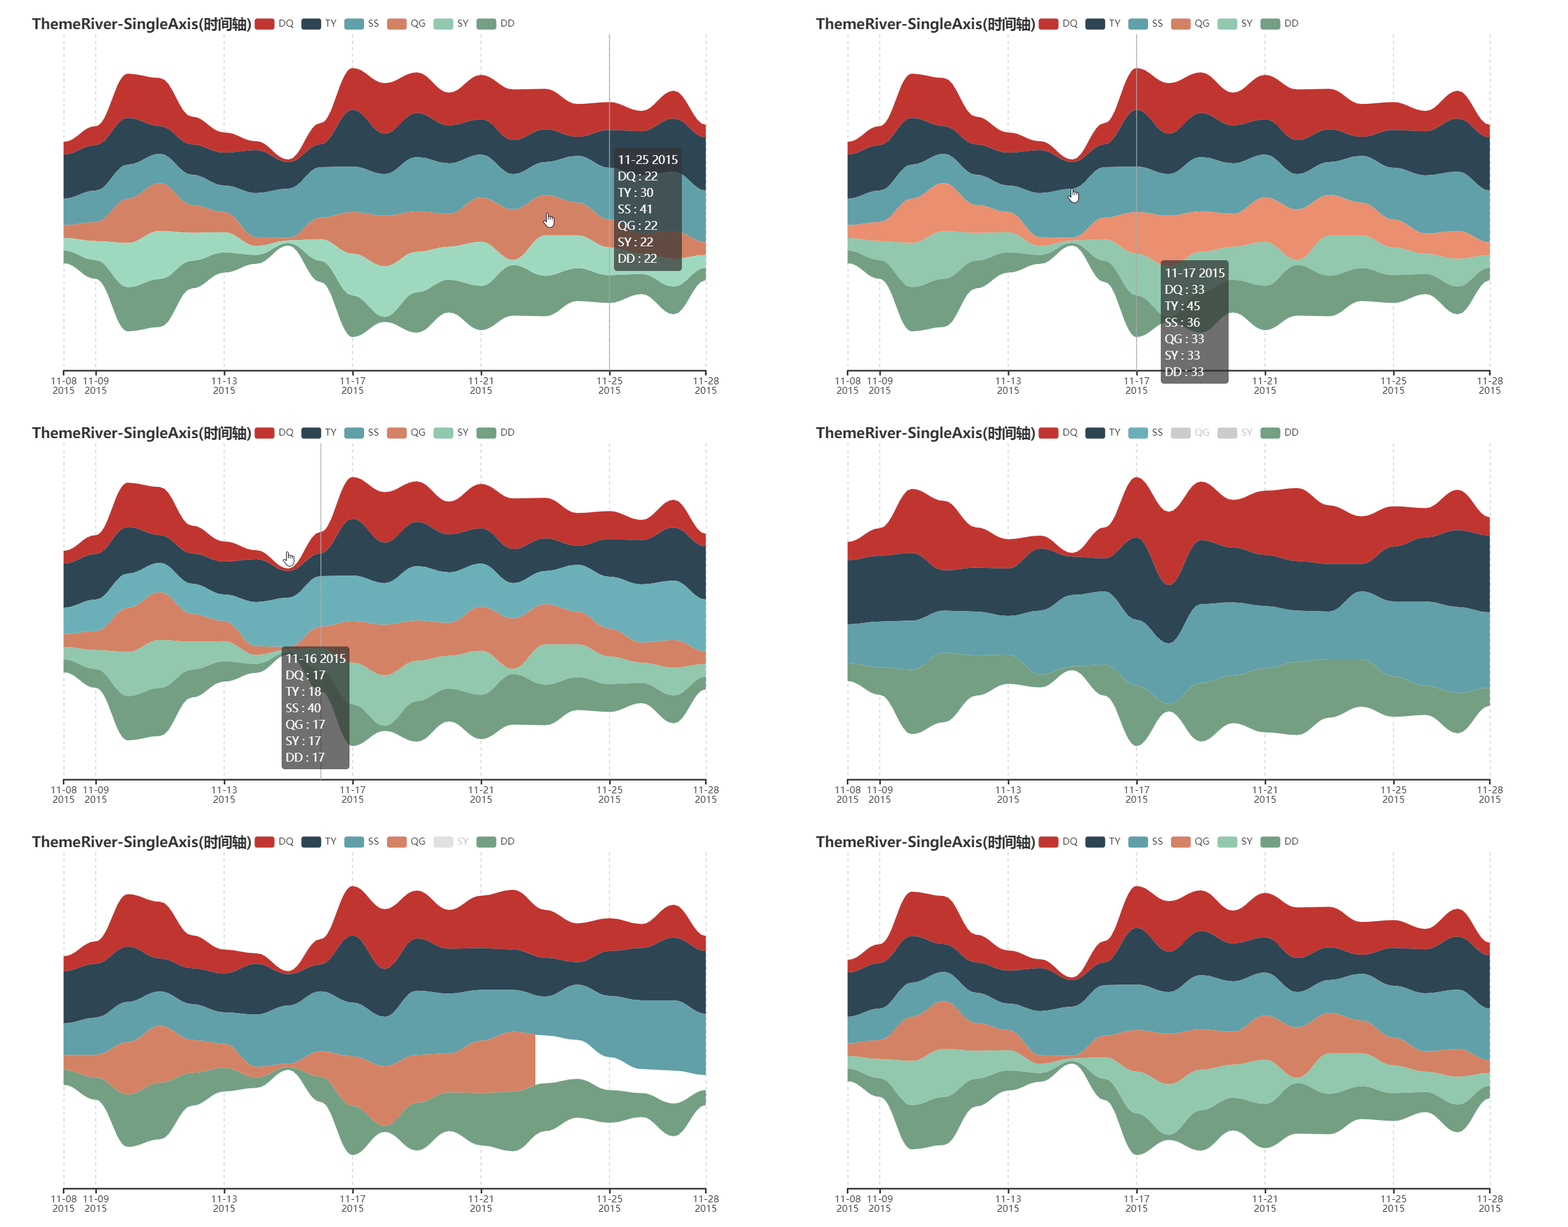
bar boxplot effectScatter funnel gague geo geo graph heatmap kline line liquid map bmap parallel pie ploar radar scatter tree treemap wordCloud bar3D line3D sankey scatter3D surface3D themeRiver sunburst overlap grid grid timeline

更多详细文档,请访问

⛏ 代码质量

单元测试

$ pip install -r test/requirements.txt
$ make

集成测试

使用 Travis CIAppVeyor 持续集成环境。

代码规范

使用 flake8, Codecov 以及 pylint 提升代码质量。

😉 Author

pyecharts 主要由以下几位开发者开发维护

更多贡献者信息可以访问 pyecharts/graphs/contributors

💡 贡献

期待能有更多的开发者参与到 pyecharts 的开发中来,我们会保证尽快 Reivew PR 并且及时回复。但提交 PR 请确保

  1. 通过所有单元测试,如若是新功能,请为其新增单元测试
  2. 遵守开发规范,使用 black 以及 isort 格式化代码($ pip install -r requirements-dev.txt)
  3. 如若需要,请更新相对应的文档

我们也非常欢迎开发者能为 pyecharts 提供更多的示例,共同来完善文档,文档项目位于 pyecharts/website

📃 License

MIT ©chenjiandongx
pyecharts-snapshot's People

Contributors

chenjiandongx avatar chfw avatar leon332157 avatar
Stargazers

 avatar  avatar  avatar  avatar  avatar  avatar  avatar  avatar  avatar  avatar  avatar  avatar  avatar  avatar  avatar  avatar  avatar  avatar  avatar  avatar  avatar  avatar  avatar  avatar  avatar  avatar  avatar  avatar  avatar  avatar  avatar  avatar  avatar  avatar  avatar  avatar  avatar  avatar  avatar  avatar  avatar  avatar  avatar  avatar  avatar  avatar  avatar  avatar  avatar  avatar  avatar  avatar  avatar  avatar  avatar  avatar  avatar  avatar  avatar  avatar  avatar  avatar  avatar  avatar  avatar  avatar  avatar  avatar  avatar  avatar  avatar  avatar  avatar  avatar  avatar  avatar  avatar  avatar  avatar  avatar  avatar  avatar  avatar  avatar  avatar  avatar  avatar  avatar  avatar  avatar  avatar  avatar  avatar  avatar  avatar  avatar  avatar  avatar  avatar  avatar

Watchers

 avatar  avatar  avatar  avatar  avatar  avatar  avatar  avatar  avatar  avatar  avatar

pyecharts-snapshot's Issues

生成gif时,报错

Generating file ...
Traceback (most recent call last):
  File "d:\anaconda3\envs\venv37\lib\runpy.py", line 193, in _run_module_as_main
    "__main__", mod_spec)
  File "d:\anaconda3\envs\venv37\lib\runpy.py", line 85, in _run_code
    exec(code, run_globals)
  File "D:\Anaconda3\envs\venv37\Scripts\snapshot.exe\__main__.py", line 7, in <module>
  File "d:\anaconda3\envs\venv37\lib\site-packages\pyecharts_snapshot\main.py", line 86, in main
    asyncio.get_event_loop().run_until_complete(_main())
  File "d:\anaconda3\envs\venv37\lib\asyncio\base_events.py", line 583, in run_until_complete
    return future.result()
  File "d:\anaconda3\envs\venv37\lib\site-packages\pyecharts_snapshot\main.py", line 109, in _main
    file_name, output, delay=delay, pixel_ratio=pixel_ratio
  File "d:\anaconda3\envs\venv37\lib\site-packages\pyecharts_snapshot\main.py", line 130, in make_a_snapshot
    file_name, file_type, pixel_ratio, delay
  File "d:\anaconda3\envs\venv37\lib\site-packages\pyecharts_snapshot\main.py", line 169, in async_make_snapshot
    return await get_echarts(to_file_uri(html_path), snapshot_js)
  File "d:\anaconda3\envs\venv37\lib\site-packages\pyecharts_snapshot\main.py", line 175, in get_echarts
    await page.goto(url)
  File "d:\anaconda3\envs\venv37\lib\site-packages\pyppeteer\page.py", line 862, in goto
    raise error
pyppeteer.errors.TimeoutError: Navigation Timeout Exceeded: 30000 ms exceeded.

OSError: [Errno 2] No such file or directory

zxjd@zxjd-OptiPlex-7040:~$ snapshot render.html
Traceback (most recent call last):
File "/usr/local/bin/snapshot", line 11, in
sys.exit(main())
File "/usr/local/lib/python2.7/dist-packages/pyecharts_snapshot/main.py", line 35, in main
make_a_snapshot(file_name, output, delay=delay)
File "/usr/local/lib/python2.7/dist-packages/pyecharts_snapshot/main.py", line 54, in make_a_snapshot
proc_params, stdout=subprocess.PIPE, shell=shell_flag)
File "/usr/lib/python2.7/subprocess.py", line 711, in init
errread, errwrite)
File "/usr/lib/python2.7/subprocess.py", line 1343, in _execute_child
raise child_exception
OSError: [Errno 2] No such file or directory

同一个ipynb中,前面的cell利用make_a_snapshot能成功截图,后面开始报错

我的一个ipynb中,多次利用了make_a_snapshot,前面的十几个图片可以截图成功,到13张图片的时候,就开始报错No phantomjs found in your PATH. Please install it!

An exception has occurred, use %tb to see the full traceback.

SystemExit: 1

我的phantomjs已经安装好了,前面的截图也已经成功了,不知道为什么中途就出问题了

no snapshot saved on Windows

C:\python3\python "1.py" (在目录 C:\Users\85422\Desktop 中)
phantomjs version: 2.1.1
Generating file ...
Traceback (most recent call last):
File "1.py", line 11, in
bar.render(path='snapshot.png')
File "C:\python3\lib\site-packages\pyecharts\base.py", line 132, in render
**kwargs
File "C:\python3\lib\site-packages\pyecharts_snapshot\environment.py", line 35, in render_chart_to_file
make_a_snapshot(tmp_file_path, path, delay=delay, verbose=verbose)
File "C:\python3\lib\site-packages\pyecharts_snapshot\main.py", line 100, in make_a_snapshot
raise OSError(content_array)
OSError: ["ReferenceError: Can't find variable: echarts\n\n undefined:1\nnull\n"]
编译失败。

no legend in the png

hello,every friends, I have a problem now, who can help me? thanks very much~
when I create a html file the legend is intact, but when I use the snapshot to create a png/gif, the title、the lables and the legend are all disappear.
ps: the operating system is Red Hat 4.4.7-16; node version is v10.4.0; phantomjs version is 2.1.1.

Windows html and snapshot filename path problems

Windows 7 with Python 2.7, with the latest pyecharts and pyecharts-snapshot from github.

  1. Using forward slash in path or any path generated with os.path module won't work. Change it to back slash works.
  2. Chinses name in the full absolute file path won't work.
radar.render("pics\\index.html")
make_a_snapshot("pics\\index.html", "pics\\echarts_radar3.png")

Result:

\lib\site-packages\pyecharts_snapshot\main.py", line 64, in make_a_snapshot
    base64_imagedata = content.split(',')[1]
IndexError: list index out of range
OSError: ["ReferenceError: Can't find variable: echarts\n\n undefined:1\nnull\n"]

测试代码

from pyecharts import options as opts
from pyecharts.charts import Bar
from pyecharts.render import make_snapshot

from snapshot_phantomjs import snapshot

def bar_chart() -> Bar:
    c = (
        Bar()
        .add_xaxis(["衬衫", "毛衣", "领带", "裤子", "风衣", "高跟鞋", "袜子"])
        .add_yaxis("商家A", [114, 55, 27, 101, 125, 27, 105])
        .add_yaxis("商家B", [57, 134, 137, 129, 145, 60, 49])
        .reversal_axis()
        .set_series_opts(label_opts=opts.LabelOpts(position="right"))
        .set_global_opts(title_opts=opts.TitleOpts(title="Bar-测试渲染图片"))
    )
    return c

make_snapshot(snapshot, bar_chart().render(), "bar0.png")

错误栈


OSError Traceback (most recent call last)
in ()
17 return c
18
---> 19 make_snapshot(snapshot, bar_chart().render(), "bar0.png")

~\Program File\Anaconda3\lib\site-packages\pyecharts\render\snapshot.py in make_snapshot(engine, file_name, output_name, delay, pixel_ratio, is_remove_html, **kwargs)
37 content_array = content.split(",")
38 if len(content_array) != 2:
---> 39 raise OSError(content_array)
40
41 image_data = decode_base64(content_array[1])

OSError: ["ReferenceError: Can't find variable: echarts\n\n undefined:1\nnull\n"]

版本信息

Python 3.6
pyecharts == 1.5.1
pyecharts-javascripthon==0.0.6
pyecharts-jupyter-installer==0.0.3
pyecharts-snapshot==0.1.7

About the parameter delay

In my python, it seems that the delay wouldn't work. No matter what kinds of number I type in, it just wouldn't work. And the pic it generates is damaged. I can't open it. But the html file is ok. Weird.

Covid-19(1).zip

Scatter3D 生成png和pdf失败

你好,

输入数据为data_scatter:
[('TRBV10-3', 'TRBD1', 'TRBJ1-1', 1, 1), ('TRBV10-3', 'TRBD1', 'TRBJ1-5', 1, 9), ('TRBV10-3', 'TRBD1', 'TRBJ2-7', 1, 2), ('TRBV11-2', 'TRBD1', 'TRBJ1-3', 1, 5), ('TRBV11-2', 'TRBD1', 'TRBJ1-4', 1, 6), ('TRBV12-3', 'TRBD1', 'TRBJ2-1', 1, 7), ('TRBV12-4', 'TRBD2', 'TRBJ2-1', 1, 3), ('TRBV13', 'TRBD1', 'TRBJ2-3', 3, 45), ('TRBV15', 'TRBD1', 'TRBJ1-4', 2, 4), ('TRBV18', 'TRBD1', 'TRBJ1-5', 1, 12), ('TRBV18', 'TRBD1', 'TRBJ2-4', 1, 6), ('TRBV2', 'TRBD1', 'TRBJ1-4', 1, 3), ('TRBV2', 'TRBD1', 'TRBJ2-5', 1, 5), ('TRBV20-1', 'TRBD1', 'TRBJ1-4', 1, 10), ('TRBV20-1', 'TRBD1', 'TRBJ2-2', 1, 5), ('TRBV20-1', 'TRBD1', 'TRBJ2-3', 1, 11), ('TRBV25-1', 'TRBD1', 'TRBJ1-2', 1, 3), ('TRBV29-1', 'TRBD1', 'TRBJ2-5', 3, 21), ('TRBV5-1', 'TRBD1', 'TRBJ1-2', 1, 10), ('TRBV5-1', 'TRBD1', 'TRBJ2-1', 1, 4), ('TRBV5-1', 'TRBD1', 'TRBJ2-4', 1, 7), ('TRBV5-4', 'TRBD1', 'TRBJ1-4', 1, 3), ('TRBV5-4', 'TRBD1', 'TRBJ2-7', 1, 12), ('TRBV5-5', 'TRBD1', 'TRBJ2-1', 1, 7), ('TRBV5-6', 'TRBD2', 'TRBJ2-1', 1, 2), ('TRBV6-1', 'TRBD2', 'TRBJ2-7', 1, 5), ('TRBV6-5', 'TRBD1', 'TRBJ1-1', 1, 1), ('TRBV6-5', 'TRBD1', 'TRBJ1-3', 1, 9), ('TRBV6-5', 'TRBD1', 'TRBJ2-2', 1, 16), ('TRBV6-5', 'TRBD1', 'TRBJ2-7', 1, 7), ('TRBV6-6', 'TRBD1','TRBJ1-5', 1, 3), ('TRBV6-6', 'TRBD1', 'TRBJ1-6', 1, 8), ('TRBV6-6', 'TRBD2', 'TRBJ2-7', 1, 5), ('TRBV6-9', 'TRBD1', 'TRBJ1-4', 1, 5), ('TRBV7-2', 'TRBD1', 'TRBJ1-2', 1, 7), ('TRBV7-2', 'TRBD1', 'TRBJ2-5', 1, 5), ('TRBV7-8', 'TRBD1', 'TRBJ1-2', 1, 2), ('TRBV7-8', 'TRBD1', 'TRBJ2-1', 1, 6), ('TRBV7-8', 'TRBD1', 'TRBJ2-6', 1, 13), ('TRBV9', 'TRBD2', 'TRBJ2-1', 2, 8)]

画图代码为:
file_path="{}/".format(os.path.dirname(os.path.abspath("./echarts.min.js")))
def scatter3d() -> Scatter3D:
c = (
Scatter3D(init_opts = opts.InitOpts(width='900px',height='700px', js_host=file_path))
.add("",
data_scatter,
xaxis3d_opts=opts.Axis3DOpts(
name="v-gene",
type_="category",
),
yaxis3d_opts=opts.Axis3DOpts(
name="d-gene",
type_="category",
),
zaxis3d_opts=opts.Axis3DOpts(
name="j-gene",
type_="category",
),
grid3d_opts = opts.Grid3DOpts(width=100, depth=90, rotate_speed = 90, is_rotate=False)
)
.set_global_opts(title_opts=opts.TitleOpts(title="Scatter3D of VDJ-pairs"),
visualmap_opts=[
opts.VisualMapOpts(type_="color", dimension=4, pos_top="40", max_= max(data_filter['umis'].tolist())),
opts.VisualMapOpts(type_="size", dimension=3, pos_bottom="40", max_= max(data_filter['barcodes'].tolist()), range_size=[1, max(data_filter['barcodes'].tolist())*5],
),
]
)
)
return c

scatter3d_png = os.path.join(od_path, "Scatter3D_vdj_pairs.png")
make_snapshot(snapshot, scatter3d().render(), scatter3d_png)
生成的PNG是空的。

我把echarts.min.js下载到linux,Sankey图按照这个模式是可以生成PNG 和PDF的,但是Scatter3D不知道为什么不行

盼复

pyppeteer.errors.BrowserError: Browser closed unexpectedly:

When I run a html file using "snapshot render.html svg", what are the some errors ? How to resovle it?

Generating file ...
Traceback (most recent call last):
File "/usr/local/bin/snapshot", line 8, in
sys.exit(main())
File "/usr/local/lib/python3.7/site-packages/pyecharts_snapshot/main.py", line 86, in main
asyncio.get_event_loop().run_until_complete(_main())
File "/usr/local/Cellar/python/3.7.6_1/Frameworks/Python.framework/Versions/3.7/lib/python3.7/asyncio/base_events.py", line 583, in run_until_complete
return future.result()
File "/usr/local/lib/python3.7/site-packages/pyecharts_snapshot/main.py", line 109, in _main
file_name, output, delay=delay, pixel_ratio=pixel_ratio
File "/usr/local/lib/python3.7/site-packages/pyecharts_snapshot/main.py", line 130, in make_a_snapshot
file_name, file_type, pixel_ratio, delay
File "/usr/local/lib/python3.7/site-packages/pyecharts_snapshot/main.py", line 169, in async_make_snapshot
return await get_echarts(to_file_uri(html_path), snapshot_js)
File "/usr/local/lib/python3.7/site-packages/pyecharts_snapshot/main.py", line 173, in get_echarts
browser = await launch()
File "/usr/local/lib/python3.7/site-packages/pyppeteer/launcher.py", line 305, in launch
return await Launcher(options, **kwargs).launch()
File "/usr/local/lib/python3.7/site-packages/pyppeteer/launcher.py", line 166, in launch
self.browserWSEndpoint = get_ws_endpoint(self.url)
File "/usr/local/lib/python3.7/site-packages/pyppeteer/launcher.py", line 225, in get_ws_endpoint
raise BrowserError('Browser closed unexpectedly:\n')
pyppeteer.errors.BrowserError: Browser closed unexpectedly:

无法生成png图片

在issue 23看到跟我同样报错的信息,看到作者提交了commit和终止了问题后
我把作者的回复操作试了一遍
但是发现还是没有成功解决我的 问题
这是我的错误信息
phantomjs version: 2.1.1

Generating file ...
Traceback (most recent call last):
File "E:\学习作业\毕业设计\爬虫\数据分析\output_jinjiang.py", line 10, in
bar.render(path='snapshot.png', pixel_ratio=3)
File "D:\Program Files\python\lib\site-packages\pyecharts\base.py", line 146, in render
**kwargs
File "D:\Program Files\python\lib\site-packages\pyecharts_snapshot\environment.py", line 35, in render_chart_to_file
make_a_snapshot(tmp_file_path, path, delay=delay, verbose=verbose)
File "D:\Program Files\python\lib\site-packages\pyecharts_snapshot\main.py", line 99, in make_a_snapshot
raise OSError(content_array)
OSError: ["ReferenceError: Can't find variable: echarts\n\n undefined:1\nnull\n"]
[Finished in 6.0s]

使用的是有我自己的代码和作者的案例代码,还有尝试了作者说的引擎方式,但都是同样的错误
无论是这个案例
r 5pdsi l_saecr_ wl7t s
还是这个案例
`from pyecharts import Bar, Line
from pyecharts.engine import create_default_environment

bar = Bar("我的第一个图表", "这里是副标题")
bar.add("服装", ["衬衫", "羊毛衫", "雪纺衫", "裤子", "高跟鞋", "袜子"], [5, 20, 36, 10, 75, 90])

line = Line("我的第一个图表", "这里是副标题")
line.add("服装", ["衬衫", "羊毛衫", "雪纺衫", "裤子", "高跟鞋", "袜子"], [5, 20, 36, 10, 75, 90])

env = create_default_environment("html")

为渲染创建一个默认配置环境

create_default_environment(filet_ype)

file_type: 'html', 'svg', 'png', 'jpeg', 'gif' or 'pdf'

env.render_chart_to_file(bar, path='bar.html')
env.render_chart_to_file(line, path='line.html')`
都是报了同一个错误
我的尝试结果是,如果不用引擎的方式,我可以生成html文件,但是png文件始终无法生成

我的python版本是3.6
使用的是sublime text编辑器
版本信息有
pyecharts==0.5.11
pyecharts-javascripthon==0.0.6
pyecharts-jupyter-installer==0.0.3
pyecharts-snapshot==0.1.7
PyInstaller==3.3.1

以上是我的问题详细内容,跪求作者翻牌,谢谢大佬

gif do not work

when I run snapshot test.html gif in command line , It gives me a static picture, not a gif, How can I got a dynamic gif file?

win10 下面官方栗子会报错

'phantomjs' �����ڲ����ⲿ���Ҳ���ǿ����еij���
���������ļ���
Traceback (most recent call last):
File "H:/project/python/web/xmshop/test/2.py", line 13, in
make_a_snapshot('render2.html', 'snapshot.png')
File "D:\Program Files (x86)\python\pythonenv\lib\site-packages\pyecharts_snapshot\main.py", line 60, in make_a_snapshot
base64_imagedata = content.split(',')[1]
IndexError: list index out of range

svg的图表生成后不能交互

我生成了一个动态图表,在以html为格式时可交互也可以动态,但是输出成gif或者svg就不能动态和交互,而且README中的svg示例已经挂了...

html转为svg格式后,svg文件打开不是图片,是一段代码

问题

您好,我希望利用pyecharts生成svg格式,但转换后的svg文件无法显示图片,请问这个是因为没有加入渲染,还是什么问题嘛

Code

from pyecharts import options as opts
from pyecharts import render
from pyecharts.charts import Bar
from pyecharts.globals import RenderType
from pyecharts.render import make_snapshot

from snapshot_phantomjs import snapshot
//from snapshot_selenium import snapshot

def bar_chart() -> Bar:
c = (
Bar()
.add_xaxis(["衬衫", "毛衣", "领带", "裤子", "风衣", "高跟鞋", "袜子"])
.add_yaxis("商家A", [114, 55, 27, 101, 125, 27, 105])
.add_yaxis("商家B", [57, 134, 137, 129, 145, 60, 49])
.reversal_axis()
.set_series_opts(label_opts=opts.LabelOpts(position="right"))
.set_global_opts(title_opts=opts.TitleOpts(title="Bar-测试渲染图片"))
)
return c

make_snapshot(snapshot, bar_chart().render(), "bar0.svg")

bar_chart().render('bar0.html')
make_snapshot(snapshot, 'bar0.html', "bar0.svg")

命令行

通过命令行 snapshot bar0.html svg 方式获取,同样打开是如下格式

SVG打开后:

This XML file does not appear to have any style information associated with it. The document tree is shown below.

<canvas data-zr-dom-id="zr_0" width="900" height="500" style="position: absolute; left: 0px; top: 0px; width: 900px; height: 500px; user-select: none; -webkit-tap-highlight-color: rgba(0, 0, 0, 0); padding: 0px; margin: 0px; border-width: 0px;"/>

默认白色背景,保存成jpeg图片的时候,背景色变成黑色

描述:
pyecharts将图片保存成jpeg的时候,背景色变成黑色。
保存成png则没有问题,但是图片没有压缩,9M太大了。

版本:
pyecharts 0.5.11
pyecharts-snapshot 0.1.10

图片:
jp_5y_cci long-short histogram

代码:
bar_image = pyecharts.Bar(”title‘’, width=1200, height=700)
bar_image.add(‘long’, long_interval_array,
long_frequency_array)
bar_image.add('short', short_interval_array,
short_frequency_array)

bar_image.render(path='test.jpeg')

python3.6 Example programs报错

运行Example programs报错“IndexError: list index out of range”

`IndexError Traceback (most recent call last)
in ()
11 bar.add("商家B", attr, v2, is_stack=True)
12 bar.render()
---> 13 make_a_snapshot('render.html', 'snapshot.png')

D:\ProgramData\lib\site-packages\pyecharts_snapshot\main.py in make_a_snapshot(file_name, output_name)
53 else:
54 content = io.TextIOWrapper(proc.stdout, encoding="utf-8").read()
---> 55 base64_imagedata = content.split(',')[1]
56 imagedata = decode_base64(base64_imagedata.encode('utf-8'))
57 if file_type == 'pdf':

IndexError: list index out of range`

在不连网的情况下,在win10系统下,无法将html图片保存为本地图片,怎么正确添加js_host可以正常运行

from pyecharts import options as opts
from pyecharts.charts import Gauge
from pyecharts.render import make_snapshot
from snapshot_phantomjs import snapshot
import os

def bar_chart():
c = (
Gauge(init_opts=opts.InitOpts(bg_color="white"))
.add(
"",
[("AA", 40.4)], title_label_opts=opts.LabelOpts(
font_size=22, font_weight='700', color="#00BEE6", font_family="Microsoft YaHei"),
split_number=10,
axisline_opts=opts.AxisLineOpts(
linestyle_opts=opts.LineStyleOpts(
color=[[0.2, "#67e0e3"], [0.8, "#37a2da"], [1, "#fd666d"]], width=30
)
),
detail_label_opts=opts.LabelOpts(formatter="{value}%"),
)
.set_global_opts(
title_opts=opts.TitleOpts(),
legend_opts=opts.LegendOpts(is_show=False),
)
)
make_snapshot(snapshot, c.render(), "TEST.png",is_remove_html=False)

if name == 'main':
bar_chart()
在不连网的情况下,在win10系统下上述代码会报错
_### _File "C:\software\anaconda\lib\site-packages\pyecharts\render\snapshot.py", line 45, in make_snapshot
raise OSError(content_array)

OSError: ["ReferenceError: Can't find variable: echarts\n\n file:///H:/Python/python/render.html:12 in global code\nReferenceError: Can't find variable: echarts\n\n undefined:1\nnull\n"]__

怎么正确在Gauge(init_opts=opts.InitOpts(bg_color="white"))中opts_InitOpts添加js_host使得代码能运行?

Recommend Projects

  • React photo React

    A declarative, efficient, and flexible JavaScript library for building user interfaces.

  • Vue.js photo Vue.js

    🖖 Vue.js is a progressive, incrementally-adoptable JavaScript framework for building UI on the web.

  • Typescript photo Typescript

    TypeScript is a superset of JavaScript that compiles to clean JavaScript output.

  • TensorFlow photo TensorFlow

    An Open Source Machine Learning Framework for Everyone

  • Django photo Django

    The Web framework for perfectionists with deadlines.

  • D3 photo D3

    Bring data to life with SVG, Canvas and HTML. 📊📈🎉

Recommend Topics

  • javascript

    JavaScript (JS) is a lightweight interpreted programming language with first-class functions.

  • web

    Some thing interesting about web. New door for the world.

  • server

    A server is a program made to process requests and deliver data to clients.

  • Machine learning

    Machine learning is a way of modeling and interpreting data that allows a piece of software to respond intelligently.

  • Game

    Some thing interesting about game, make everyone happy.

Recommend Org

  • Facebook photo Facebook

    We are working to build community through open source technology. NB: members must have two-factor auth.

  • Microsoft photo Microsoft

    Open source projects and samples from Microsoft.

  • Google photo Google

    Google ❤️ Open Source for everyone.

  • D3 photo D3

    Data-Driven Documents codes.