Code Monkey home page Code Monkey logo

codemirror-promql's Introduction

Prometheus
Prometheus

Visit prometheus.io for the full documentation, examples and guides.

CI Docker Repository on Quay Docker Pulls Go Report Card CII Best Practices Gitpod ready-to-code Fuzzing Status OpenSSF Scorecard

Prometheus, a Cloud Native Computing Foundation project, is a systems and service monitoring system. It collects metrics from configured targets at given intervals, evaluates rule expressions, displays the results, and can trigger alerts when specified conditions are observed.

The features that distinguish Prometheus from other metrics and monitoring systems are:

  • A multi-dimensional data model (time series defined by metric name and set of key/value dimensions)
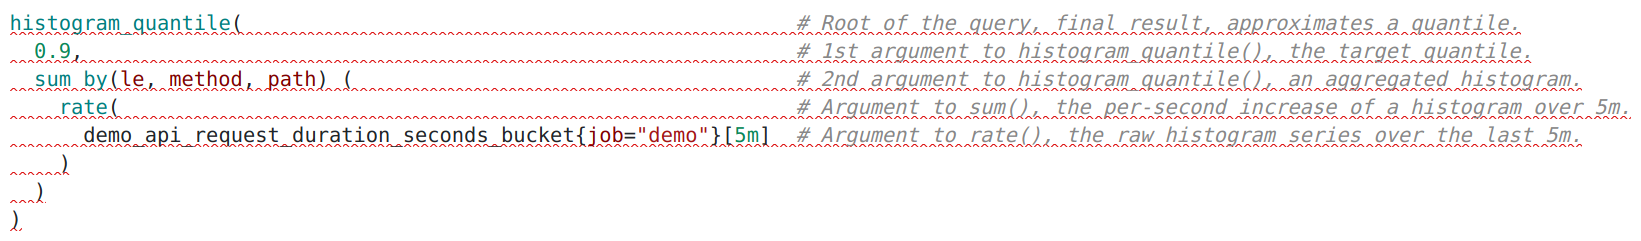
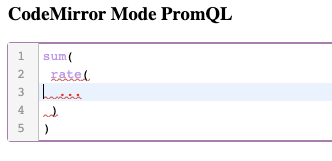
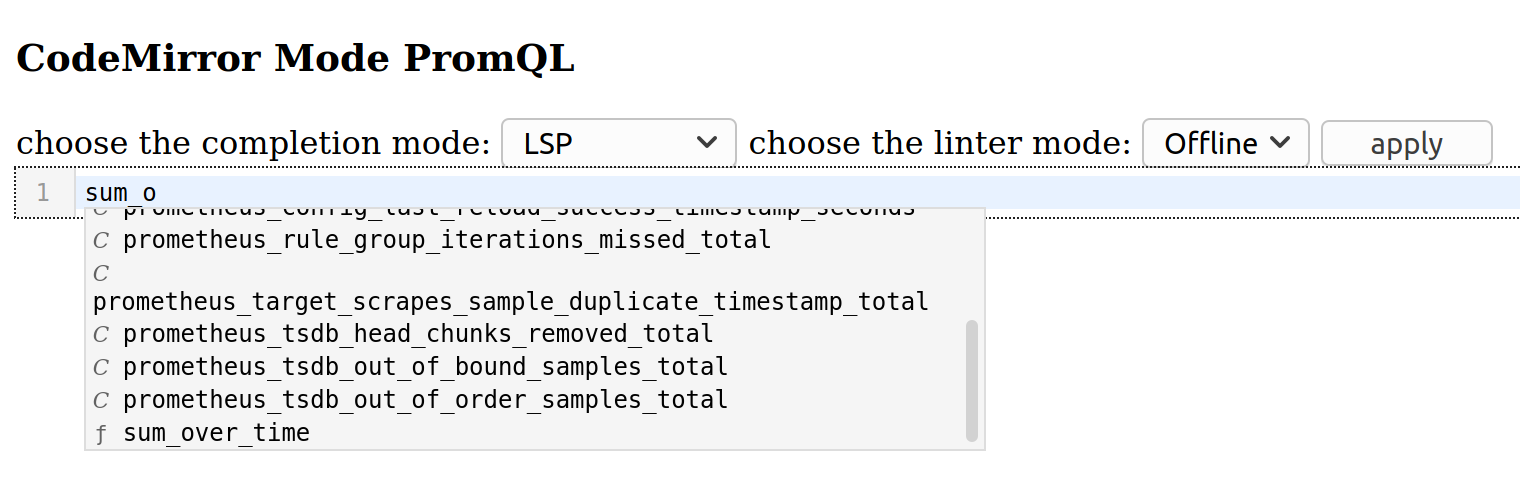
  • PromQL, a powerful and flexible query language to leverage this dimensionality
  • No dependency on distributed storage; single server nodes are autonomous
  • An HTTP pull model for time series collection
  • Pushing time series is supported via an intermediary gateway for batch jobs
  • Targets are discovered via service discovery or static configuration
  • Multiple modes of graphing and dashboarding support
  • Support for hierarchical and horizontal federation

Architecture overview

Architecture overview

Install

There are various ways of installing Prometheus.

Precompiled binaries

Precompiled binaries for released versions are available in the download section on prometheus.io. Using the latest production release binary is the recommended way of installing Prometheus. See the Installing chapter in the documentation for all the details.

Docker images

Docker images are available on Quay.io or Docker Hub.

You can launch a Prometheus container for trying it out with

docker run --name prometheus -d -p 127.0.0.1:9090:9090 prom/prometheus

Prometheus will now be reachable at http://localhost:9090/.

Building from source

To build Prometheus from source code, You need:

Start by cloning the repository:

git clone https://github.com/prometheus/prometheus.git
cd prometheus

You can use the go tool to build and install the prometheus and promtool binaries into your GOPATH:

GO111MODULE=on go install github.com/prometheus/prometheus/cmd/...
prometheus --config.file=your_config.yml

However, when using go install to build Prometheus, Prometheus will expect to be able to read its web assets from local filesystem directories under web/ui/static and web/ui/templates. In order for these assets to be found, you will have to run Prometheus from the root of the cloned repository. Note also that these directories do not include the React UI unless it has been built explicitly using make assets or make build.

An example of the above configuration file can be found here.

You can also build using make build, which will compile in the web assets so that Prometheus can be run from anywhere:

make build
./prometheus --config.file=your_config.yml

The Makefile provides several targets:

  • build: build the prometheus and promtool binaries (includes building and compiling in web assets)
  • test: run the tests
  • test-short: run the short tests
  • format: format the source code
  • vet: check the source code for common errors
  • assets: build the React UI

Service discovery plugins

Prometheus is bundled with many service discovery plugins. When building Prometheus from source, you can edit the plugins.yml file to disable some service discoveries. The file is a yaml-formated list of go import path that will be built into the Prometheus binary.

After you have changed the file, you need to run make build again.

If you are using another method to compile Prometheus, make plugins will generate the plugins file accordingly.

If you add out-of-tree plugins, which we do not endorse at the moment, additional steps might be needed to adjust the go.mod and go.sum files. As always, be extra careful when loading third party code.

Building the Docker image

The make docker target is designed for use in our CI system. You can build a docker image locally with the following commands:

make promu
promu crossbuild -p linux/amd64
make npm_licenses
make common-docker-amd64

Using Prometheus as a Go Library

Remote Write

We are publishing our Remote Write protobuf independently at buf.build.

You can use that as a library:

go get buf.build/gen/go/prometheus/prometheus/protocolbuffers/go@latest

This is experimental.

Prometheus code base

In order to comply with go mod rules, Prometheus release number do not exactly match Go module releases. For the Prometheus v2.y.z releases, we are publishing equivalent v0.y.z tags.

Therefore, a user that would want to use Prometheus v2.35.0 as a library could do:

go get github.com/prometheus/[email protected]

This solution makes it clear that we might break our internal Go APIs between minor user-facing releases, as breaking changes are allowed in major version zero.

React UI Development

For more information on building, running, and developing on the React-based UI, see the React app's README.md.

More information

  • Godoc documentation is available via pkg.go.dev. Due to peculiarities of Go Modules, v2.x.y will be displayed as v0.x.y.
  • See the Community page for how to reach the Prometheus developers and users on various communication channels.

Contributing

Refer to CONTRIBUTING.md

License

Apache License 2.0, see LICENSE.

codemirror-promql's People

Contributors

dependabot[bot] avatar dsmith3197 avatar faceair avatar juliusv avatar nexucis avatar piotaixr avatar prombot avatar

Stargazers

 avatar  avatar  avatar  avatar  avatar  avatar  avatar  avatar  avatar  avatar  avatar  avatar  avatar  avatar  avatar  avatar  avatar  avatar  avatar  avatar  avatar  avatar  avatar  avatar  avatar  avatar  avatar  avatar  avatar  avatar  avatar  avatar  avatar  avatar  avatar  avatar  avatar

Watchers

 avatar  avatar  avatar  avatar  avatar  avatar  avatar  avatar

codemirror-promql's Issues

Replace lib fuzzy by fuse.js

  • fuzzy looks like it's abandoned and doesn't support ES5
  • fuse.js can return the indices of matched characters. Useful for enhance the highlight and the escape of the HTML characters.

Have a way to warm the cache

When the autocompletion is contacting a huge Thanos, then when you are starting to type a PromQL expression, nothing is proposed until the request to get a list of metric is returned.

It's a bit annoyed since it is blocking the autocompletion of the PromQL keyword such as the function/aggregation.

A way to avoid that would be to warm the cache embedded into the PrometheusClient used by the lib by performing the query to get the list of the metric before it is actually using.

The problem is there is no way to get the instance of the PrometheusClient used by lib.

  1. First option is to simply provide a getter that would return the PrometheusClient instance used. But I don't really want to change the interface CompleteStrategy. Having a PrometheusClient is more related to the implementation of the interface than to the interface itself.
  2. Another option would be to provide a option cache.warm, if set, then it will warm the cache when the PromQLExtension is instanciated. But I don't have a really good feeling ether for this solution.

How to override the `apiPrefix`

This is not an issue but a question, sorry if it's not the right place to post, I couldn't find anywhere else to ask.
I'm having some issue setting up the autocompletion.

First I want to change the default endpoints for /series and /labels.
Readme specified by default it is calling /api/v1/labels and /api/v1/series

I have 2 endpoints for labels and series
https://mysite.com/siteapi/v1/prom/labels
https://mysite.com/siteapi/v1/prom/series

Also I'm seeing this got mentioned in the read me file
const promQL = new PromQLExtension().setComplete({ remote: { fetchFn: myHTTPClient } })

How do I include both of these in the fetchFn for setComplete? Or is there another way to let setComplete knows about the labels and the series endpoints?

Another question, when I tried this from the Readme, all auto suggestion seems to stop working, did I miss any config?

const promQL = new PromQLExtension().setComplete({
    remote: {
        cache: {
            initialMetricList: [
                'ALERTS',
                'ALERTS_FOR_STATE',
                'alertmanager_alerts',
                'alertmanager_alerts_invalid_total',
                'alertmanager_alerts_received_total',
            ]
        }
    }
})

Remove strict node requirement

Hey Julius and Augustin,

Would it be possible to remove the node version requirement in package.json or to decrement it to 12?

  "engines": {
    "node": ">=14.0.0"
  }

I'm attempting to consume codemirror-promql in a yarn monorepo and am running into issues due to conflicting node versions.

I know codemirror.next says that it requires node 14 in the README, but I believe that is only necessary for the development server. In particular, you can see in the change log that the library works on node 12 and 13 as well.

The packages are no longer available as CommonJS files. To run the code on node.js, you'll need node 13 or pass --experimental-modules to node 12.

Roadmap to go to the v1

The goal of this issue is to list the different feature we would like to implement in order to provide a nice v1.
The different issues are normally listed by priority

In order to achieve that, we are going to move directly to CodeMirror 6 which provides much more interesting feature than the previous version such as:

  • a grammar syntax called lezer
  • everything is a module (or an extension as it is the internal term) which makes CodeMirror much more flexible
  • CodeMirror in typescript

Replace Monaco

Goal: be able to provide same feature than provided by monaco-promql

  • Provide the npm package lezer-promql that will provide the PromQL grammar in the lezer syntax. On @juliusv side
  • Create a language extension that takes the package lezer-promql in order to have a proper syntax highlightning
  • Create an auto-completion extension in order to suggest all PromQL keyword
  • In the meantime try to fix the issue codemirror/dev#236 in order to have an accurate autocomplete list
  • In the meantime try to fix the issue codemirror/dev#234

Documentations

  • Document how to integrate codemirror-mode with Angular
  • Document how to ingegrate codemirror-mode with ReactJS

Improvement

Goal: improve the different feature provided in the previous section while still staying offline

  • Provides a way to highlight some syntax error (if not already provided) ==> use the linter.
  • Improve the auto-completion list with PromQL snippets
  • Propose different theme to be used to replace the current one.
  • Hybrid Autocompletion should be deeply reviewed to be more flexible / testable / precise

Test

  • Implement unit test to cover and improve potentially the autocompletion

LSP

Goal: Integrate some feature coming from LSP (Language Server Protocol)

  • Improve the auto-completion list by getting the metric/labelName /labelValue when it's accurate. Or by using the endpoint /completion on Prometheus side, or by using the standard endpoint in prometheus. on @Nexucis side
  • Find a way to display the PromQL documentation using the endpoint /hover on Prometheus side. ===> Should use the tooltips. Feature is blocked until codemirror/dev#226 is resolved.
  • Use the endpoint /diagnostics for the linter

The craziness

Goal: everything that sounds cool and crazy

  • be compatible with CodeMirror 5.
  • propose to Prometheus to use codemirror-mode.
  • propose to Thanos to use codemirror-mode.
  • propose to Grafana to use codemirror-mode.

Note: this page will be edited with new feature in case it appears to be important.

Extend PrometheusClient interface to pass label matchers as arguments

Hi @Nexucis and @juliusv ,

Can we extend the PrometheusClient interface to pass in the label matchers for the associated vector selector? I want to implement a custom PrometheusClient that behaves in the same way as the Grafana M3 plugin. However, the current interface does not pass enough information to make the more refined series queries that the Grafana plugin makes. This is an issue when a metric name has high enough of a cardinality that will cause the series endpoint to fail when only the metric name is given w/o additional label matchers. It is also an issue when a user selects a label matcher that then limits the remaining label matchers that can be chosen. As such, this package as it is now is unusable for my use case. However, with a slight modification, it will support implementing a PrometheusClient with the same functionality as the Grafrana M3 plugin.

A proposed extended interface is as follows:

export interface PrometheusClient {
  labelNames(metricName?: string, matchers?: Matcher[]): Promise<string[]>;

  // labelValues return a list of the value associated to the given labelName.
  // In case a metric is provided, then the list of values is then associated to the couple <MetricName, LabelName>
  labelValues(labelName: string, metricName?: string, matchers?: Matcher[]): Promise<string[]>;

  metricMetadata(): Promise<Record<string, MetricMetadata[]>>;

  series(metricName: string, matchers?: Matcher[]): Promise<Map<string, string>[]>;
}
export interface Context {
  kind: ContextKind;
  metricName?: string;
  labelName?: string;
  matchers?: Matcher[];
}

Here are a few examples where this is necessary.

  • Suppose the expression is some_metric{job="my_job", instance="my_instance", |} (where the | is the cursor position, not a character in the expression).

    • In this case, codemirror-promql with send the following API request /api/v1/series?start={}&end={}&matcher[]=some_metric. However, I would instead like to make the following API request: /api/v1/series?start={}&end={}&matcher[]=some_metric{job="my_job", instance="my_instance"} (this is what the Grafana M3 plugin does). In order to so, I propose that the matchers passed as an argument to labelValues(...) is a list of 2 label matchers (i.e., the equivalent of job="my_job and instance="my_instance").
  • Suppose the expression is some_metric{job="my_job", instance="|"} (where the | is the cursor position, not a character in the expression, so the instance label matcher currently has an empty string value).

    • In this case, codemirror-promql with send the following API request /api/v1/series?start={}&end={}&matcher[]=some_metric. However, I would instead like to make the following API request: /api/v1/series?start={}&end={}&matcher[]=some_metric{job="my_job"} (this is what the Grafana M3 plugin does). In order to so, I propose that the matchers passed as an argument to labelValues(...) is a list of 2 label matchers (i.e., the equivalent of job="my_job and instance="") and the client can determine which label matcher to omit from the query.
  • Finally, I have an additional endpoint I use to search for metric names given a metric prefix. In order to handle this case, could we have metricName be defined when labelValues("__name__") is called. For instance, suppose the expression is some_metric_prefix. Currently, labelValues("__name__") is called in this case. Instead, I wish for labelValues("__name__", "some_metric_prefix") to be called. This one does not require extending the interface at all, so I really hope we can implement this one. This one in particular is blocking me from using this library.

I've implemented a proof of concept of this that works. I believe that this extension of the interface will allow for much more sophisticated clients, so I hope you do consider. Also, I'm willing to implement these changes myself along with tests.

Linter should ignore comments

Comments seem to influence linting behavior and introduce linter warnings where there should be none.

Example: https://promlens.com/?l=E7B5fVU6KQ3

Which looks like this:

comments-linter-error

The linter error in this case is "expected 2 argument(s) in call to histogram_quantile, got 0".

When removing the comments, everything is fine.

Allow consumers to use a custom CompleteStrategy

Hi,

I would like to use a custom CompleteStrategy because I've extended the prometheus API to support additional autocomplete features for my own use cases, but the package does not currently allow for such a customization. Can you extend the CompleteConfiguration interface to allow for that? For instance, you could do something like the following.

// CompleteConfiguration should be used to customize the autocompletion.
export interface CompleteConfiguration {
  // Provide these settings when not using a custom PrometheusClient.
  url?: string;
  lookbackInterval?: number;
  httpErrorHandler?: (error: any) => void;
  fetchFn?: FetchFn;

  // maxMetricsMetadata is the maximum limit of the number of metrics in Prometheus.
  // Under this limit, it allows the completion to get the metadata of the metrics.
  maxMetricsMetadata?: number;

  // When providing this custom PrometheusClient, the settings above will not be used.
  prometheusClient?: PrometheusClient;

  // When providing this custom CompleteStrategy, the settings above will not be used.
  completeStrategy: CompleteStrategy;
}

export function newCompleteStrategy(conf?: CompleteConfiguration): CompleteStrategy {
  if (conf?.completeStrategy) {
    return conf?.completeStrategy;
  }
  if (conf?.prometheusClient) {
    return new HybridComplete(conf.prometheusClient, conf.maxMetricsMetadata);
  }
  if (conf?.url) {
    return new HybridComplete(
      new CachedPrometheusClient(new HTTPPrometheusClient(conf.url, conf.httpErrorHandler, conf.lookbackInterval, conf.fetchFn)),
      conf.maxMetricsMetadata
    );
  }
  return new HybridComplete();
}

PromQL autocomplete: impossible to get full labels list after comma

Hello

I found a bug in the prometheus UI implementation,
When I start to type a promQL, after brackets, the full list is proposed automatically (or by hitting ctrl+space), but this is not the case starting second label filtering, the labels autocompletion is not proposed.

I tried to record this in the GIF below, at the very end I am trying to hit ctrl+space as well without success...
I would expect the labels completion dropdown

Apr-02-2021 15-59-46

Clarify the difference between Prometheus and LSP mode

I mean this :D (and the linter too)

Note: The auto-completion feature has 3 different modes, each requiring a different setup

My wild guess is that the LSP is better than the Prometheus mode? But honestly I can't find an example (my queries are pretty basic so I see no difference between them). I understand that setting up LSP is more difficult than Prometheus mode though.

Actually now I think that Prometheus mode is better... in LSP I can't get the function (e.g. "rate", "sum") suggestions but I do in Premetheus mode Actually the function is still suggested but with lower score in the case of LSP

Related PRs I found:

Weird behavior when using enricher to autocomplete query history

It appears that the enricher (introduced with #82 ) does't fit really well when it is used to autocomplete an history of PromQL expression.

The issue is that when autocompleting the query proposed, it will replace the current metric typed and not the whole expression.
It is completely expected as long as the enricher was used with the context used to autocomplete metrics.

It's just it has a wrong user feeling when doing like that:

test-2021-03-22_10.11.36.mp4

Probably enricher should support another kind of context that would be used when you want to replace the whole expression and not just a part of it.

No idea if it's the best idea to handle that.

How to make the editor read only?

Is there a way to make the editor read only?

I can see the readOnly option in code mirror but not sure about how to use it using this library.

Limit amount of cached autocomplete data

Currently the Prometheus client never forgets any cached autocomplete data. The amount of series data that can be cached is potentially huge, so keeping all of it forever is basically like a memory leak and can make the browser slow when using the same PromLens tab for a while. It would be good to find a way to expire old items, like an LRU cache method or something like that.

autocompletion is calling /metadata instead of /labels and /series

Hello,
I'm trying to use the autocomplete feature, this is how I'm setting up my promQL extention:

const promQL = new PromQLExtension().setComplete({ remote: { apiPrefix: '/v1/prom', httpMethod: 'GET' } });

From the Readme file, it's saying by default it is calling /api/v1/labels and /api/v1/series. But i don't see these calls being triggered, I'm only seeing /v1/prom/metadata being triggered.

Reason why I can't use the metadata endpoint being, it is sending back all of the metrics from all of the instances, and I'm not able to pass in a query to the metadata endpoint. On the other hand, labels and metrics allow me to send in a query so i can setup a proxy and send in a query to filter the response by instances.

So is there a way i can set the autocomplete feature to make GET requests to the labels and the series endpoints instead of the metadata endpoint?

Update codemirror dependencies to v0.19

Can we update the codemirror dependencies to v0.19? It looks like v0.19 fixes a bug that can put the editor into a corrupted state.

In particular, with v0.18, I'm experiencing a bug that makes the editor completely unusable. It occurs when both linting and syntax highlighting are enabled.

See changelog for the bug fix.

@codemirror/view 0.19.3 (2021-08-25)
Bug fixes
Fix a view corruption that could happen in situations involving overlapping mark decorations.

autocomplete stops working after setting initial metric list

Hello,
I'm trying to follow the read me to setup the cached metric list.
If I set something like this

const promQL = new PromQLExtension().setComplete({ remote: { cache: { initialMetricList: [ 'metric1', 'metric2' ] } } }

the autocomplete won't work anymore, for example if I type in ra, it doesn't auto suggest the rate function.
And if I remove the remote block completely, then I see the autocomplete is working again.

const promQL = new PromQLExtension().setComplete({ maxMetricsMetadata: 10000, });

Any idea on what I'm missing in my setup?
Thank you

Support variable format

It would be cool if this plugin can support a variable format. Like $MyVariable.

Like that it would be possible to use it in a software like Grafana where you can have variables.
Autocompletion should be able to autocomplete the variable and linter should not raise an error in case a variable is used.

I believe lezer-promql need to be updated as well even if I have no idea how it can support such kind of things. Maybe like an extension that you can activate or not ?

Support autocompleting NaN and Inf

Currently when I start typing NaN or Inf in positions where they are allowed (anywhere where scalar values are allowed, which could be positions where vectors are also allowed), I only get metric names as autocompletion results. It would be great if we could autocomplete NaN and Inf as well (capitalized or not).

Text can become hidden behind tooltip

The current positions of the diagnostic tooltips seem to be set relative to start.

I've noticed that as a result of this, when I have some issue spanning multiple lines, e.g.:
image

The resulting tooltip makes it very difficult to edit the PromQL, as it completely covers part of the query and makes it impossible to click on the areas it covers. (Screenshot is after hovering over "...")
image

Example GIF from PromLens:
output

I think ideally this tooltip should either move with the cursor, or be set relative to end rather than start. On first glance, I'm not sure if there's any way to do this easily without making changes to codemirror.next, however.

Problems with LSP mode

Following #46 , I created this issue to list the problems currently in the LSP mode (at least compare with the Prometheus mode).

Good: Prometheus
Screenshot from 2020-09-20 03-57-25

Current bugs in LSP mode:
Screenshot from 2020-09-20 03-57-44

  1. Matched text is not highlight
  2. Function's score is lower than metrics (actually I think the problem here is fuzzy score is not used?)
  3. No snippet

Set operators don't autocomplete after aggregations

This autocompletes and correctly:

foo an<cursor>

This as well:

rate(foo[5m]) an<cursor>

But this does not:

sum(rate(foo[5m])) an<cursor>

However, other binops complete correctly in the same position after an aggregation.

Processing of fetched autocomplete results blocks browser

When I autocomplete something like this for a metric with many series:

container_cpu_usage_seconds_total{inst<cursor>}

...the typing is fast initially, but once the autocomplete fetch request has completed, the processing of the huge result in JS takes multiple seconds (like ~5s or so in my case) and hangs the whole browser for that period of time since JS is single-threaded. I wonder if there's something to make that better a) in this specific case by optimizing it, b) in general, by changing the processing architecture in some way.

Recommend Projects

  • React photo React

    A declarative, efficient, and flexible JavaScript library for building user interfaces.

  • Vue.js photo Vue.js

    🖖 Vue.js is a progressive, incrementally-adoptable JavaScript framework for building UI on the web.

  • Typescript photo Typescript

    TypeScript is a superset of JavaScript that compiles to clean JavaScript output.

  • TensorFlow photo TensorFlow

    An Open Source Machine Learning Framework for Everyone

  • Django photo Django

    The Web framework for perfectionists with deadlines.

  • D3 photo D3

    Bring data to life with SVG, Canvas and HTML. 📊📈🎉

Recommend Topics

  • javascript

    JavaScript (JS) is a lightweight interpreted programming language with first-class functions.

  • web

    Some thing interesting about web. New door for the world.

  • server

    A server is a program made to process requests and deliver data to clients.

  • Machine learning

    Machine learning is a way of modeling and interpreting data that allows a piece of software to respond intelligently.

  • Game

    Some thing interesting about game, make everyone happy.

Recommend Org

  • Facebook photo Facebook

    We are working to build community through open source technology. NB: members must have two-factor auth.

  • Microsoft photo Microsoft

    Open source projects and samples from Microsoft.

  • Google photo Google

    Google ❤️ Open Source for everyone.

  • D3 photo D3

    Data-Driven Documents codes.