![]()

OpenTelemetry module for Nest.
For questions and support please use the official Discord channel.
Setting up observability metrics with nestjs requires multiple libraries and patterns. OpenTelemetry has support for multiple exporters and types of metrics such as Prometheus Metrics.
Please read this comprehensive whitepaper if that's your first time working with metrics, tracing, and logs.

npm i nestjs-otel @opentelemetry/sdk-node --saveSome peers dependencies are required when some configurations are enabled.
@opentelemetry/exporter-prometheus
- Create tracing file (
tracing.ts):
import {
CompositePropagator,
W3CTraceContextPropagator,
W3CBaggagePropagator,
} from '@opentelemetry/core';
import { BatchSpanProcessor } from '@opentelemetry/sdk-trace-base';
import { JaegerExporter } from '@opentelemetry/exporter-jaeger';
import { getNodeAutoInstrumentations } from '@opentelemetry/auto-instrumentations-node';
import { JaegerPropagator } from '@opentelemetry/propagator-jaeger';
import { B3InjectEncoding, B3Propagator } from '@opentelemetry/propagator-b3';
import { PrometheusExporter } from '@opentelemetry/exporter-prometheus';
import { NodeSDK } from '@opentelemetry/sdk-node';
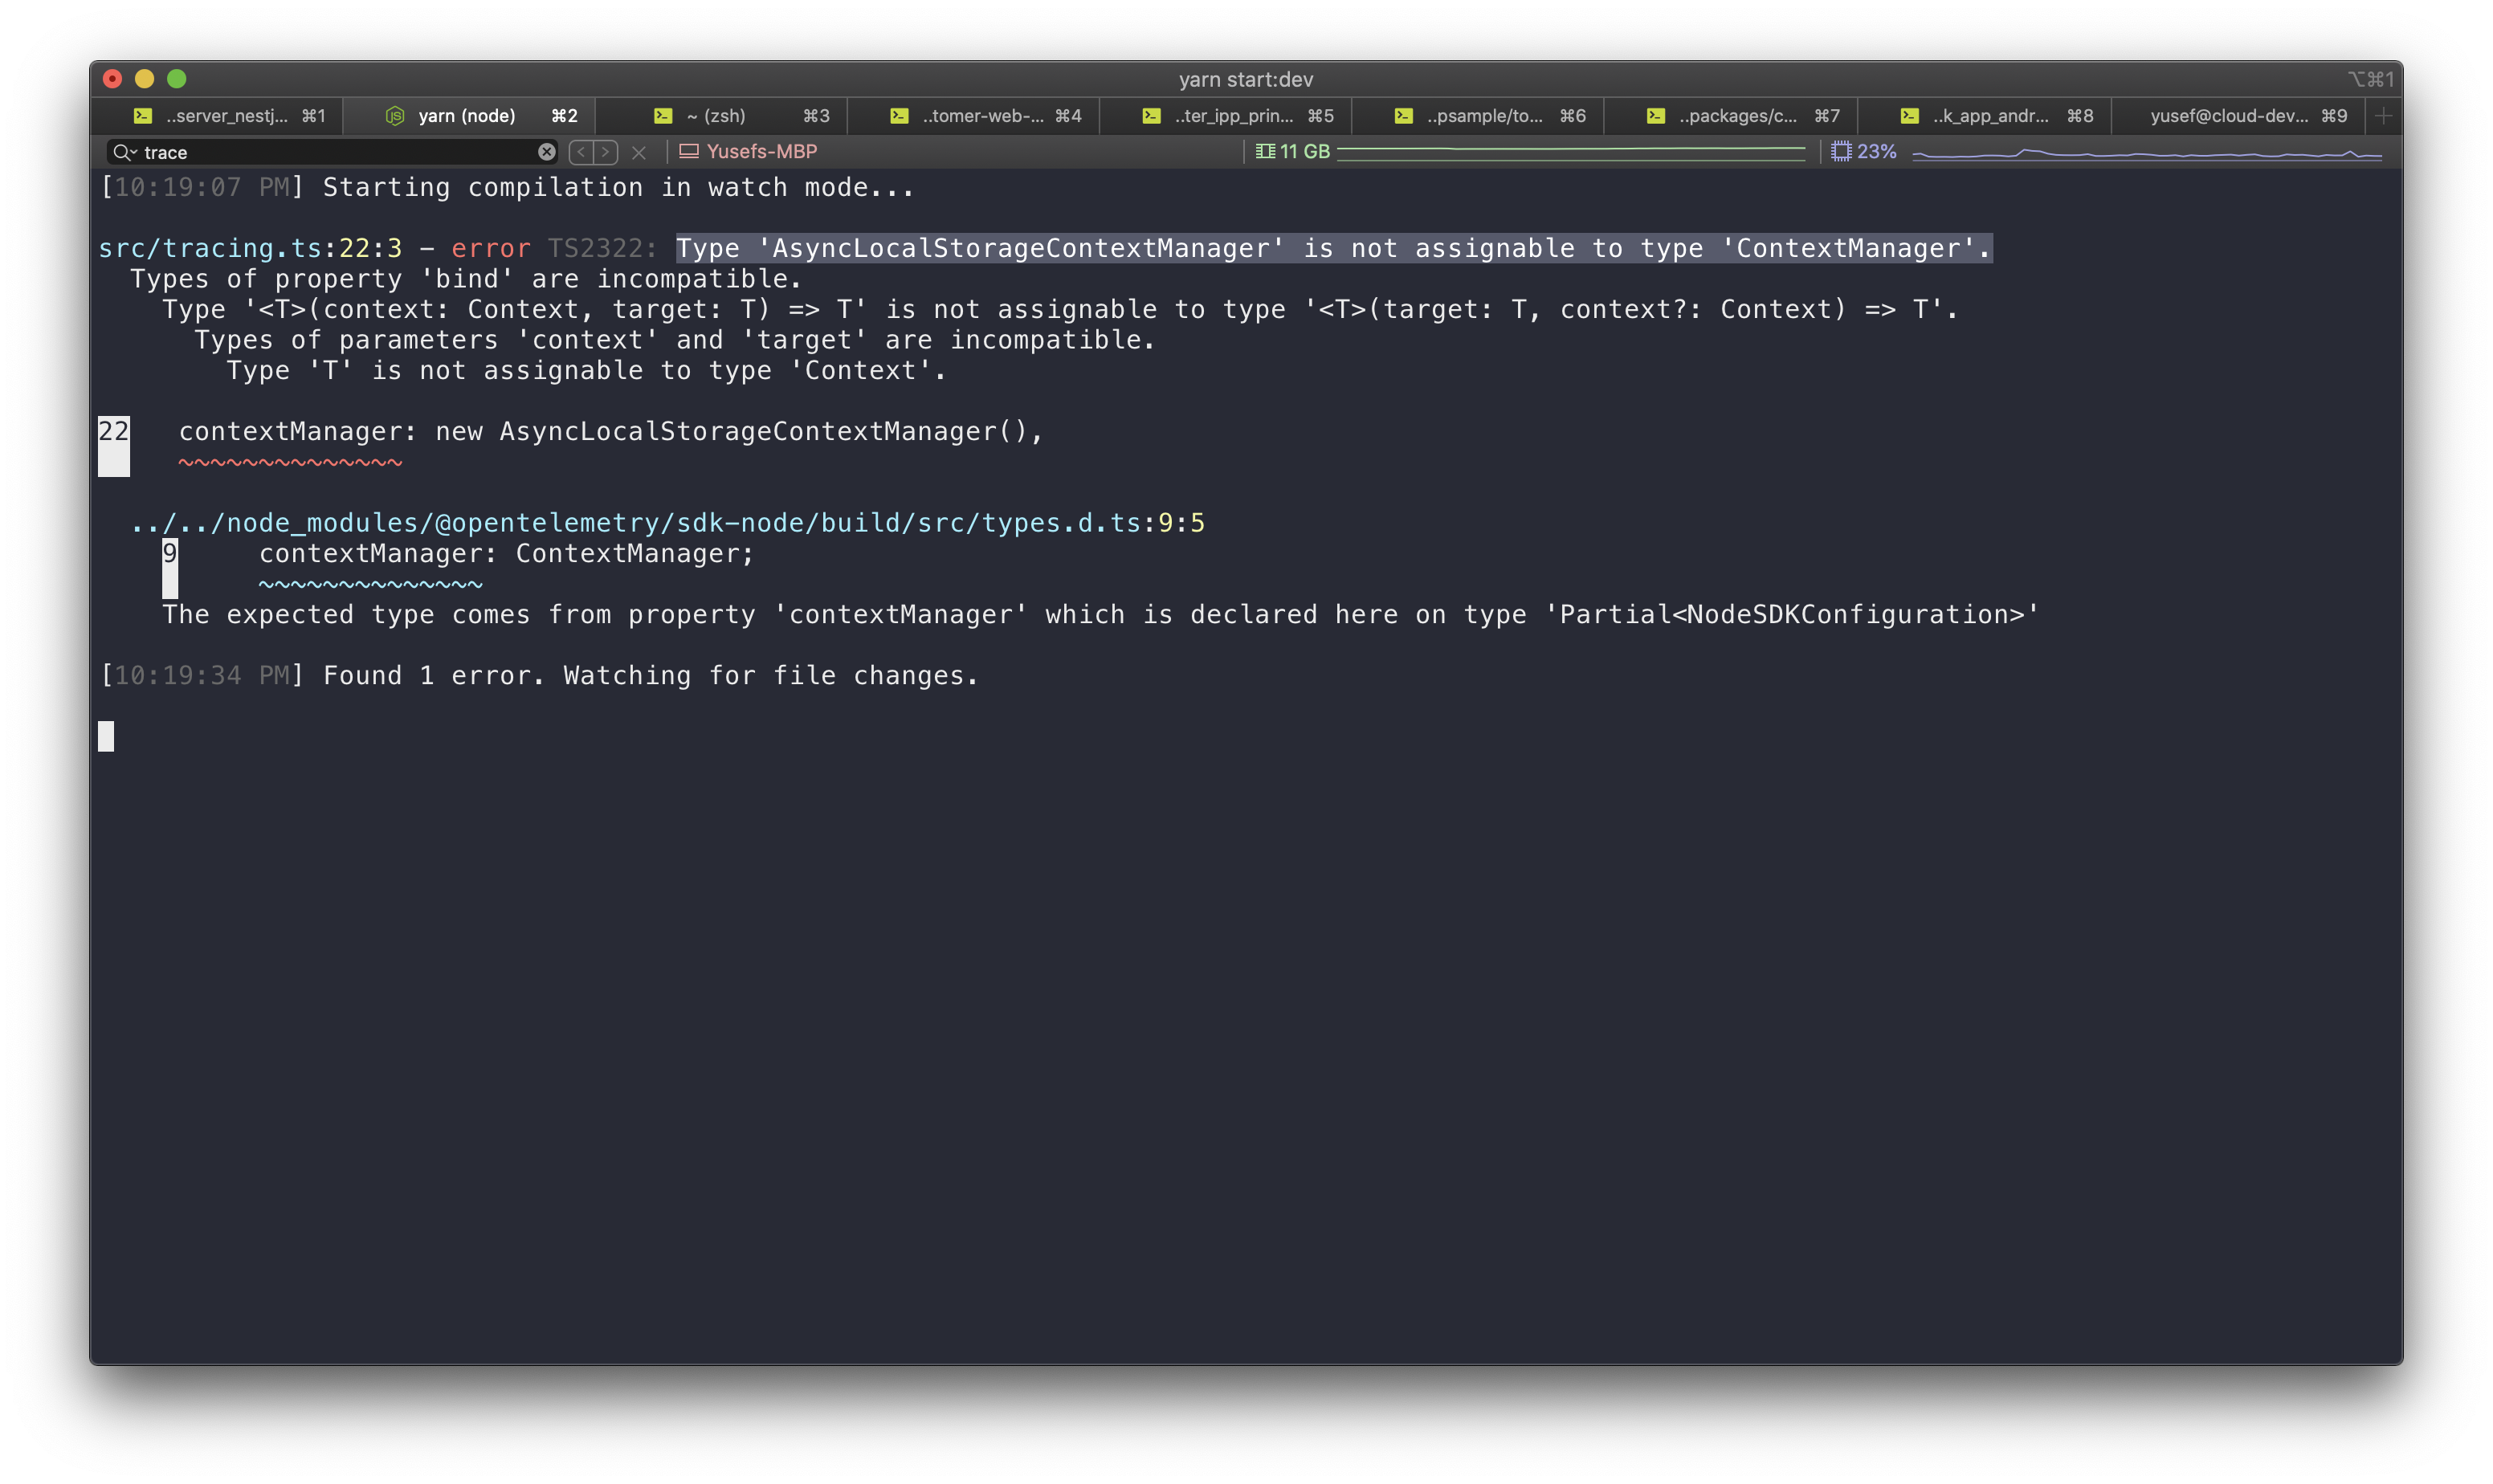
import { AsyncLocalStorageContextManager } from '@opentelemetry/context-async-hooks';
import * as process from 'process';
const otelSDK = new NodeSDK({
metricReader: new PrometheusExporter({
port: 8081,
}),
spanProcessor: new BatchSpanProcessor(new JaegerExporter()),
contextManager: new AsyncLocalStorageContextManager(),
textMapPropagator: new CompositePropagator({
propagators: [
new JaegerPropagator(),
new W3CTraceContextPropagator(),
new W3CBaggagePropagator(),
new B3Propagator(),
new B3Propagator({
injectEncoding: B3InjectEncoding.MULTI_HEADER,
}),
],
}),
instrumentations: [getNodeAutoInstrumentations()],
});
export default otelSDK;
// You can also use the shutdown method to gracefully shut down the SDK before process shutdown
// or on some operating system signal.
process.on('SIGTERM', () => {
otelSDK
.shutdown()
.then(
() => console.log('SDK shut down successfully'),
err => console.log('Error shutting down SDK', err)
)
.finally(() => process.exit(0));
});- Import the metric file and start otel node SDK:
import otelSDK from './tracing';
import { NestFactory } from '@nestjs/core';
import { AppModule } from './app.module';
import { Logger } from 'nestjs-pino';

async function bootstrap() {
  // Start SDK before nestjs factory create
  await otelSDK.start();

  const app = await NestFactory.create(AppModule);
  app.useLogger(app.get(Logger));
  await app.listen(3000);
}
bootstrap();- Configure nest-otel:
const OpenTelemetryModuleConfig = OpenTelemetryModule.forRoot({
  metrics: {
    hostMetrics: true, // Includes Host Metrics
    apiMetrics: {
      enable: true, // Includes api metrics
      defaultAttributes: {
        // You can set default labels for api metrics
        custom: 'label',
      },
      ignoreRoutes: ['/favicon.ico'], // You can ignore specific routes (See https://docs.nestjs.com/middleware#excluding-routes for options)
      ignoreUndefinedRoutes: false, //Records metrics for all URLs, even undefined ones
    },
  },
});

@Module({
  imports: [OpenTelemetryModuleConfig],
})
export class AppModule {}If you need, you can define a custom Tracing Span for a method. It works async or sync. Span takes its name from the parameter; but by default, it is the same as the method's name
import { Span } from 'nestjs-otel';

@Span('CRITICAL_SECTION')
async getBooks() {
    return [`Harry Potter and the Philosopher's Stone`];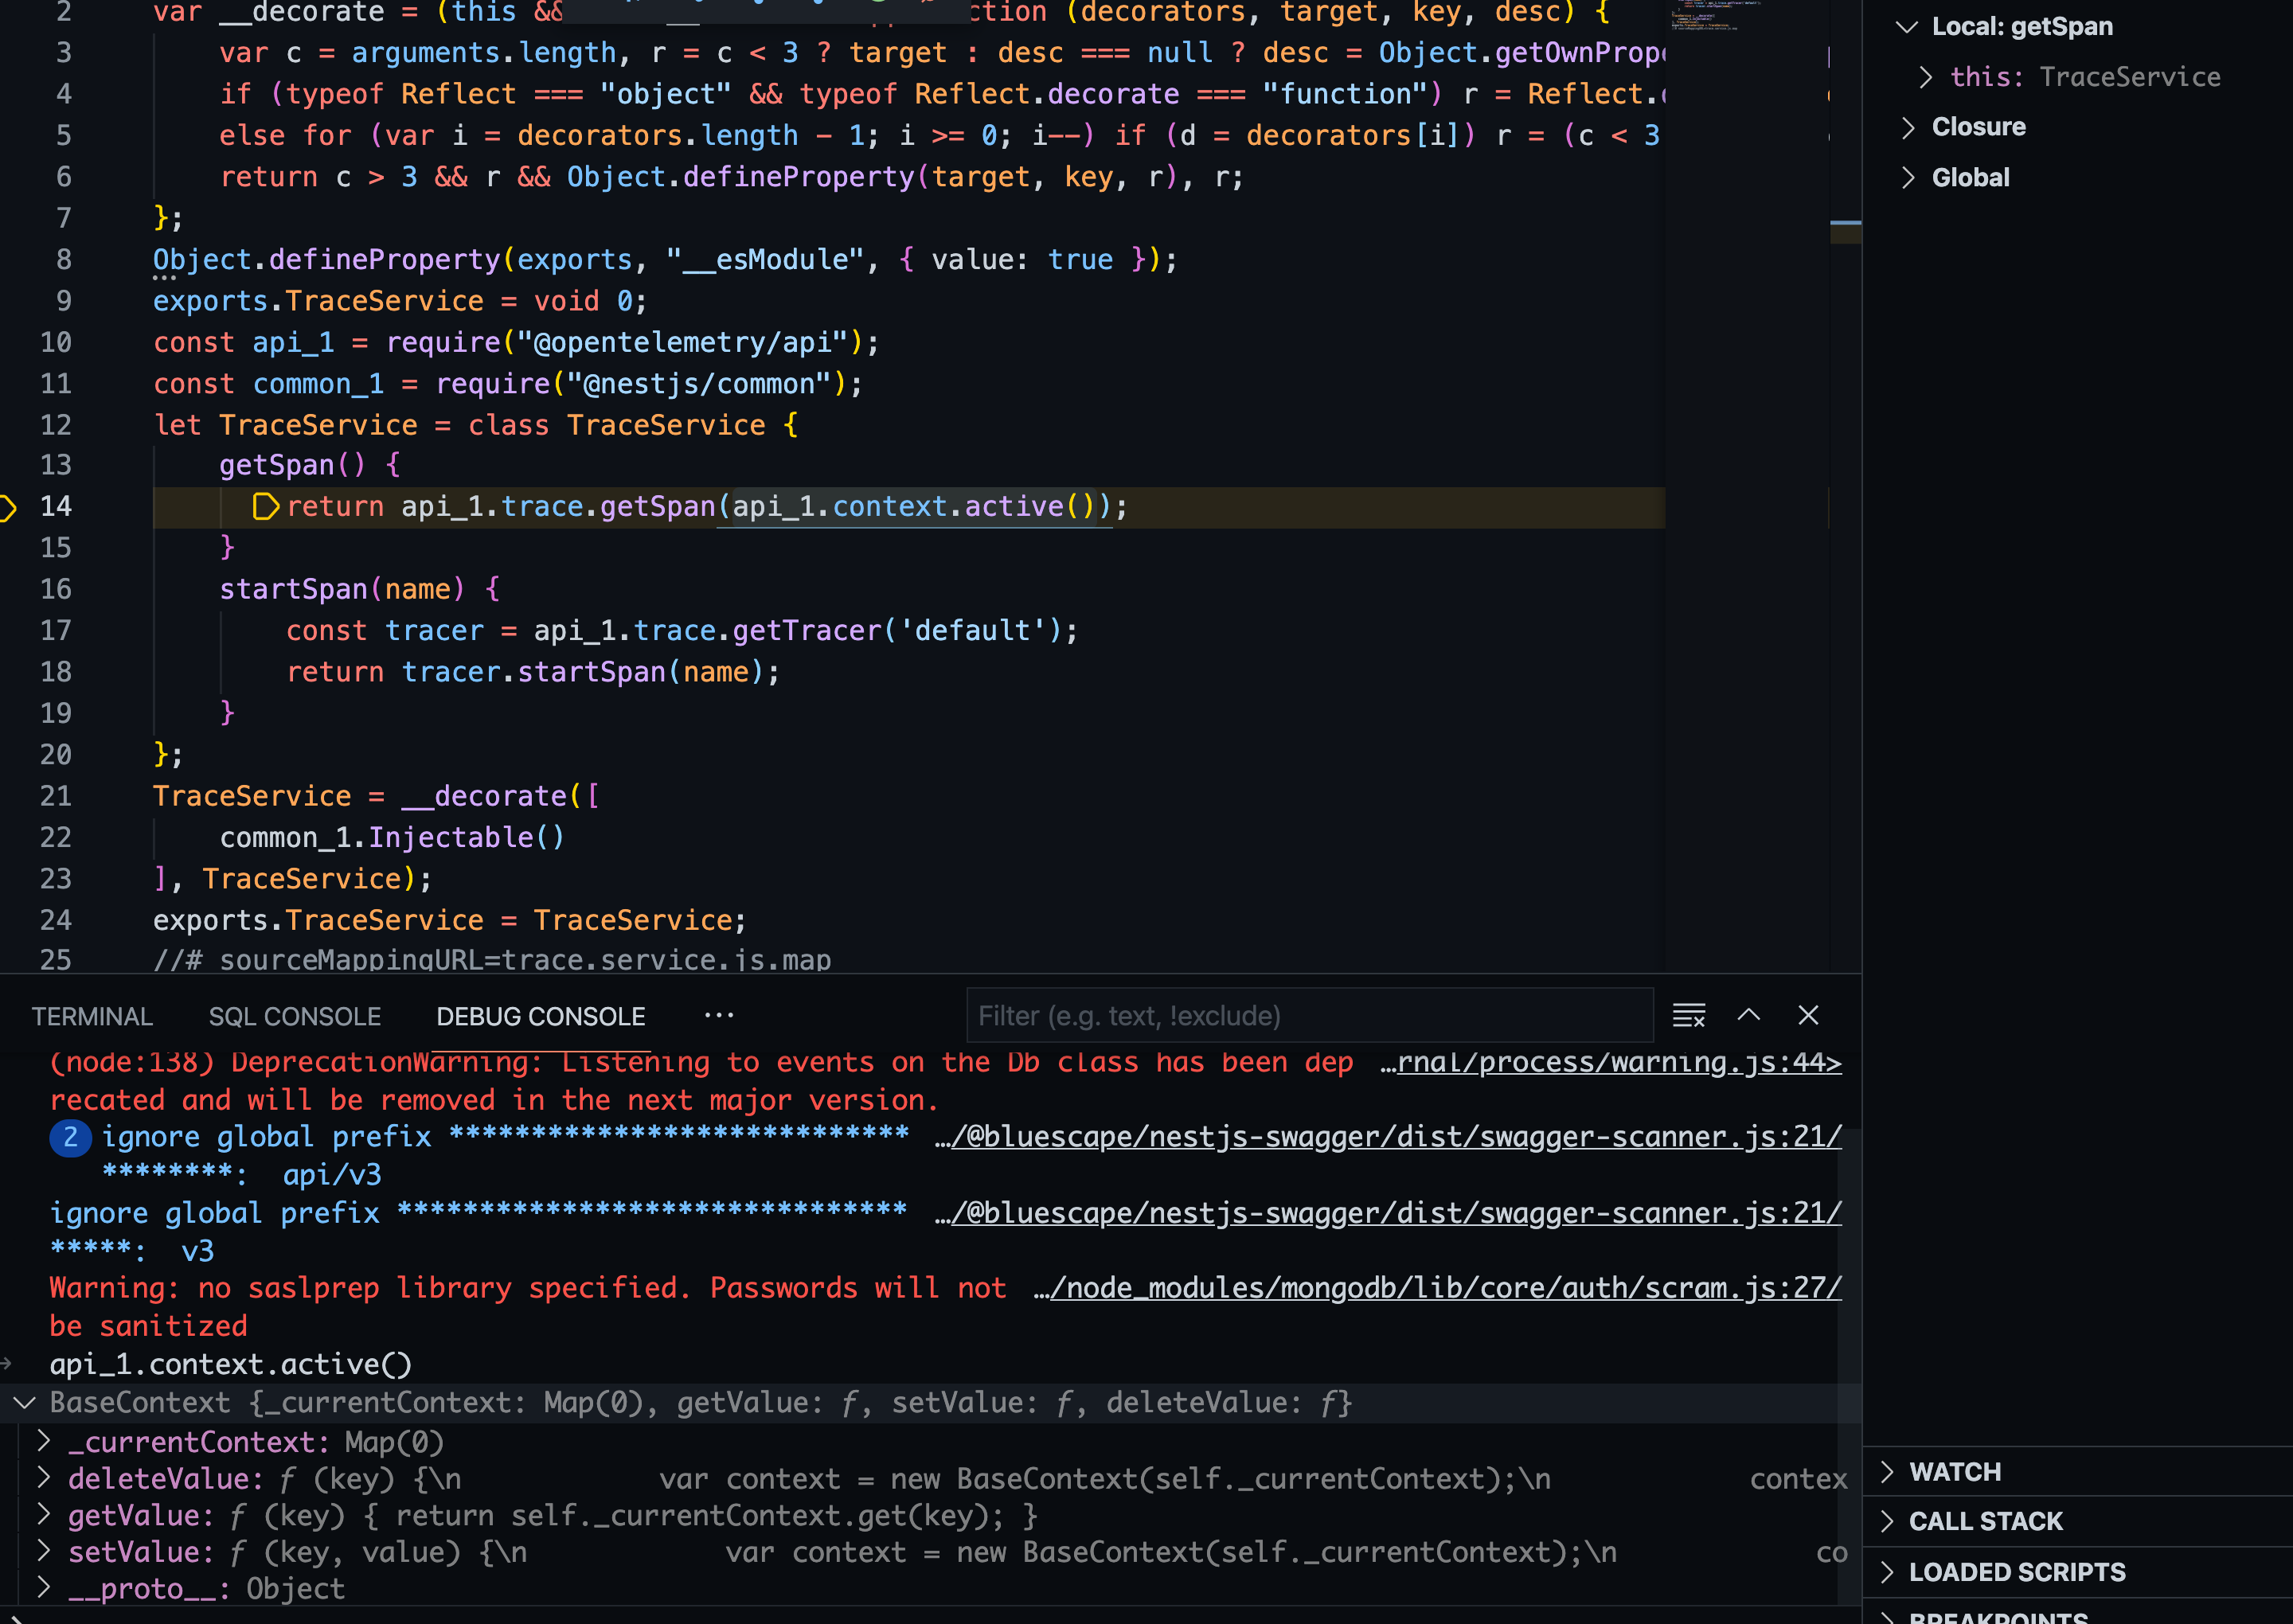
}In case you need to access native span methods for special logics in the method block:
import { TraceService } from 'nestjs-otel';

@Injectable()
export class BookService {
  constructor(private readonly traceService: TraceService) {}

  @Span()
  async getBooks() {
    const currentSpan = this.traceService.getSpan(); // --> retrives current span, comes from http or @Span
    await this.doSomething();
    currentSpan.addEvent('event 1');
    currentSpan.end(); // current span end

    const span = this.traceService.startSpan('sub_span'); // start new span
    span.setAttributes({ userId: 1 });
    await this.doSomethingElse();
    span.end(); // new span ends
    return [`Harry Potter and the Philosopher's Stone`];
  }
}OpenTelemetry Metrics allow a user to collect data and export it to metrics backend like Prometheus.
import { MetricService } from 'nestjs-otel';
import { Counter } from '@opentelemetry/api';

@Injectable()
export class BookService {
  private customMetricCounter: Counter;

  constructor(private readonly metricService: MetricService) {
    this.customMetricCounter = this.metricService.getCounter('custom_counter', {
      description: 'Description for counter',
    });
  }

  async getBooks() {
    this.customMetricCounter.add(1);
    return [`Harry Potter and the Philosopher's Stone`];
  }
}If you want to count how many instance of a specific class has been created:
@OtelInstanceCounter() // It will generate a counter called: app_MyClass_instances_total.
export class MyClass {}If you want to increment a counter on each call of a specific method:
@Injectable()
export class MyService {
  @OtelMethodCounter()
  doSomething() {}
}
@Controller()
export class AppController {
  @Get()
  @OtelMethodCounter() // It will generate `app_AppController_doSomething_calls_total` counter.
  doSomething() {
    // do your stuff
  }
}You have the following decorators:
@OtelCounter()@OtelUpDownCounter()@OtelHistogram()@OtelObservableGauge()@OtelObservableCounter()@OtelObservableUpDownCounter()
Example of usage:
import { OtelCounter } from 'nestjs-otel';
import { Counter } from '@opentelemetry/api';

@Controller()
export class AppController {
  @Get('/home')
  home(
    @OtelCounter('app_counter_1_inc', { description: 'counter 1 description' }) counter1: Counter
  ) {
    counter1.add(1);
  }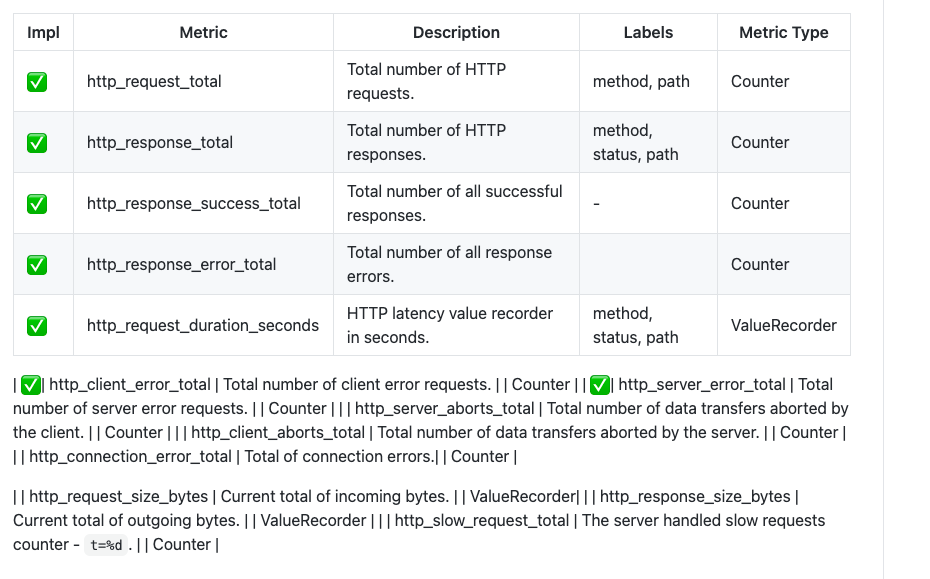
}| Impl | Otel Metric | Prometheus Metric | Description | Metric Type |
|---|---|---|---|---|
| ✅ | http.server.request.count | http_server_request_count_total | Total number of HTTP requests. | Counter |
| ✅ | http.server.response.count | http_server_response_count_total | Total number of HTTP responses. | Counter |
| ✅ | http.server.abort.count | http_server_abort_count_total | Total number of data transfers aborted. | Counter |
| ✅ | http.server.duration | http_server_duration | The duration of the inbound HTTP request. | Histogram |
| ✅ | http.server.request.size | http_server_request_size | Size of incoming bytes. | Histogram |
| ✅ | http.server.response.size | http_server_response_size | Size of outgoing bytes. | Histogram |
| ✅ | http.server.response.success.count | http_server_response_success_count_total | Total number of all successful responses. | Counter |
| ✅ | http.server.response.error.count | http_server_response_error_count_total | Total number of server error responses. | Counter |
| ✅ | http.client.request.error.count | http_client_request_error_count_total | Total number of client error requests. | Counter |
When metricExporter is defined in otel SDK with a PrometheusExporterit will start a new process on port 8081 (default port) and metrics will be available at http://localhost:8081/metrics.
This approach uses otel instrumentation to automatically inject spanId and traceId.
import { PinoInstrumentation } from '@opentelemetry/instrumentation-pino';

const otelSDK = new NodeSDK({
  instrumentations: [new PinoInstrumentation()],
});This approach uses the global trace context for injecting SpanId and traceId as a property of your structured log.
import Pino, { Logger } from 'pino';
import { LoggerOptions } from 'pino';
import { trace, context } from '@opentelemetry/api';

export const loggerOptions: LoggerOptions = {
  formatters: {
    log(object) {
      const span = trace.getSpan(context.active());
      if (!span) return { ...object };
      const { spanId, traceId } = trace.getSpan(context.active())?.spanContext();
      return { ...object, spanId, traceId };
    },
  },
};

export const logger: Logger = Pino(loggerOptions);A full working examples are available. This includes a nestjs application fully integrated with prometheus, grafana, loki and tempo:

![dependabot[bot] avatar](https://avatars.githubusercontent.com/in/29110?v=4 "dependabot[bot]")

![github-actions[bot] avatar](https://avatars.githubusercontent.com/in/15368?v=4 "github-actions[bot]")