plotly / dash Goto Github PK
View Code? Open in Web Editor NEWData Apps & Dashboards for Python. No JavaScript Required.
Home Page: https://plotly.com/dash
License: MIT License
Data Apps & Dashboards for Python. No JavaScript Required.
Home Page: https://plotly.com/dash
License: MIT License
For current tutorial, error when importing dash. Seems to be a dependency issue associated version updates. Mac OSX 10.10.5, Anaconda Distribution.
dash_core_components/__init__.py", line 8, in <module>
    _components = _dash.development.component_loader.load_components(
        AttributeError: 'module' object has no attribute 'development'
From Current Tutorial (6/29/2017):
dash==0.17.7  # The core dash backend
dash-renderer==0.7.3  # The dash front-end
dash-html-components==0.6.2  # HTML components
dash-core-components==0.5.1  # Supercharged components
plotly==2.0.11  # Plotly graphing library used in examples
Colleague's Working Versions from some time last week:
dash==0.17.5  # The core dash backend
dash-renderer==0.7.3  # The dash front-end
dash-html-components==0.6.1  # HTML components
dash-core-components==0.5.0  # Supercharged components
plotly==2.0.10  # Plotly graphing library used in examples
Hi @chriddyp,
I saw the PLOTCON talk recently and I cannot wait to start building with/contributing to the new Dash! Will you be releasing soon?
Thanks!
Hi, thanks for the project seems a nice way to get started with plotly. I ran into some issues with example 5, looks like a missing file? Full stack omitted for privacy purposes, but that file seems to be missing from the repo:
    raise TemplateNotFound(template)
TemplateNotFound: layouts/layout_full_screen.html
by standard dash is getting uploaded to the port 8050
how can i change the port i am using // is there an easy function/module within the python library?
After a couple of runs, I get this error
socket.error: [Errno 48] Address already in use
I'll look into a fix, but simply flagging it out there.
I cannot get any data to display for any of the examples in either Chrome or Safari on OSX. The browser comes up, shows the graphs, but they are empty.

Heads up! Edited on October 24, 2018
This issue comes up on google searches when folks haven't installed the necessary packages to run Dash.
If you find yourself here, then please visit the official installation instructions here: https://dash.plot.ly/installation
Thank you 🙇
In particular, I had to pip install each of dash_core_components, dash_html_components and dash_renderer to make examples work.
Hello, I am very excited to use dash!
I'm following (gist) the Your First Dash App tutorial and am running into an AttributeError:

I've restarted the kernel and reinstalled dash. Can you advise on how to proceed?
Thank you!
Olga
Hello,
is it possible to add support for the GeoJSON format, used for geocoding including Point, MultiPoint, LineString, MultiLineString, Polygon, MultiPolygon, GeometryCollection, Feature, FeatureCollection.
What is the advised way to submit form data through a button click?
app.layout = html.Div(
    [
        dcc.Input(
            disabled=True,
            type='int'
        )
    ]
)
produces this hmtl code:
<input type="int" id="rendering-frequency-input" placeholder="50">
Most of the examples I have seen rely on building the entire HTML front end via the python interface. Is there a way to use a pre-defined HTML5 template and substitute the graphs in there?
This way one can prototype the interface independently of the dash logic.
How can I handle asynchronous logic?
For instance, how can I create a button 'sleep' which writes to a div 'sleeping' for a given amount of time, and when the process is finished, writes 'awake'?
I can create a callback launching the asynchronous process with an event on the button, and write 'sleeping' to the div, but how can I change to 'awake' when the process finishes?
I created a virtualenv, then did pip install dash. This worked fine
:
:
Successfully built dash flask-compress flask-seasurf plotly
Installing collected packages: itsdangerous, click, Werkzeug, MarkupSafe, Jinja2, Flask, flask-compress, flask-seasurf, decorator, enum34, six, ipython-genutils, traitlets, jupyter-core, functools32, jsonschema, nbformat, pytz, idna, urllib3, chardet, certifi, requests, plotly, dash
Successfully installed Flask-0.12.2 Jinja2-2.9.6 MarkupSafe-1.0 Werkzeug-0.12.2 certifi-2017.4.17 chardet-3.0.4 click-6.7 dash-0.17.5 decorator-4.0.11 enum34-1.1.6 flask-compress-1.4.0 flask-seasurf-0.2.2 functools32-3.2.3.post2 idna-2.5 ipython-genutils-0.2.0 itsdangerous-0.24 jsonschema-2.6.0 jupyter-core-4.3.0 nbformat-4.3.0 plotly-2.0.11 pytz-2017.2 requests-2.18.1 six-1.10.0 traitlets-4.3.2 urllib3-1.21.1
However
(venv) gavin@gbws ~/work/uncle/graphs/plotly_dash $ python
Python 2.7.12 (default, Nov 19 2016, 06:48:10)
[GCC 5.4.0 20160609] on linux2
Type "help", "copyright", "credits" or "license" for more information.
>>> from dash.react import Dash
Traceback (most recent call last):
  File "<stdin>", line 1, in <module>
  File "/home/gavin/work/uncle/graphs/plotly_dash/venv/local/lib/python2.7/site-packages/dash/__init__.py", line 1, in <module>
    from .dash import Dash
  File "/home/gavin/work/uncle/graphs/plotly_dash/venv/local/lib/python2.7/site-packages/dash/dash.py", line 15, in <module>
    import dash_renderer
ImportError: No module named dash_renderer
Fixed by pip install dash_renderer, but should dash_renderer not be added as a dependency?
Outstanding work Chris. Exploring this still.
One question. Is it possible to launch a routing mechanism with different single page apps from a single server instance?
What I am looking for is different web pages with the same functionality.
Say xxx.yyy.com/dash1, xxx.yyy.com/dash2. xxx.yyy.com/dash3 etc?
Hi,
I'm seeing an error when installing 0.17.5 on Python 3.6.1:
pip install --no-cache-dir dash==0.17.5
Collecting dash==0.17.5
  Downloading dash-0.17.5.tar.gz
    Complete output from command python setup.py egg_info:
    Traceback (most recent call last):
      File "<string>", line 1, in <module>
      File "/private/var/folders/p9/_xrpxf9n5bzbvxzyj664fhvh0000gn/T/pip-build-vk_d_t2m/dash/setup.py", line 13, in <module>
        long_description=open('README.md').read(),
      File "/Users/paul.stevens/.virtualenv/dash/bin/../lib/python3.6/encodings/ascii.py", line 26, in decode
        return codecs.ascii_decode(input, self.errors)[0]
    UnicodeDecodeError: 'ascii' codec can't decode byte 0xe2 in position 711: ordinal not in range(128)
System specifics:
virtualenv -p python3 ~/.virtualenv/bin/dash)This is being triggered by line 13 in setup.py:
long_description=open('README.md').read(),
Locally, I fixed it to work by adding:
import io
...
long_description=io.open('README.md', encoding='utf-8').read(),
Not sure if its something odd with my environment, or something that may affect other users.
I submitted pull request #23, but I can be a bit thick, so treat with suspicion. More testing is likely required, because I may have missed something painfully obvious to others.
Note: this may be more of a plotly API question. Please let me know if I should post there instead.
I'm running through the dash tutorial and an API design question popped into my mind: Why are most parameters dictionaries? It seems that many things could be made easier to write via a class.
For example, the style item is currently defined like so:
go.Layout(margin={'l': 40, 'b': 40, 't': 10, 'r': 0})Personally I find dicts a pain to write because of all the quotes and alternating between colon and comma. With my naive understanding of the (admittedly awesome) dash package is that it should be possible to do:
go.Layout(margin=Margin(40, 40, 10, 0))Another example are the axis values:
go.Layout(xaxis={'type': 'log', 'title': 'GDP Per Capita'})

# vs
go.Layout(xaxis=Axis('GDP Per Capita', 'log'))
In my opinion, the primary advantage of doing class-based things is auto-completion and discovery. I find it much harder to determine which keys are available in a dict than it is to find what args a class initializer takes.
Of course, I can always write the Margin class and others myself and use that (and I plan to do so), but I was just curious as to why this wasn't a design choice from the beginning.
Thanks,
Hi,
Based on a suggestion in #53, I am calling out a couple of components that are very useful in the Shiny world.
It would be really useful to have a table component that can take a pandas data frame ( I believe that is the closest to the R data frame concept) or something similar and display its contents in a rich table that allows column filtering and row selection.
The DT package achieves this in Shiny - https://rstudio.github.io/DT/shiny.html
Perhaps we could wrap this as a component: https://react-table.js.org - the filtering options look great, https://react-table.js.org/#/story/custom-filtering
Thanks
Iain
pandas table not rendering properly on firefox browser (linux machine)

Heads up! Edited on October 24, 2018
This issue comes up on google searches when folks haven't installed the necessary packages to run Dash.
If you find yourself here, then please visit the official installation instructions here: https://dash.plot.ly/installation
Thank you 🙇
Was able to successfully install using pip install plotly && pip install dash
Platform: OSX
Getting following error:
File "/Users/@@/.virtualenvs/dash2.0/lib/python3.5/site-packages/dash/dash.py", line 15, in <module> import dash_renderer ImportError: No module named 'dash_renderer'
Generated by first line of code here:
import dash app = dash.Dash('Hello World') if __name__ == '__main__': app.run_server()
Does pip installation for the Dash frontend is bundled in separately? https://github.com/plotly/dash-renderer?
Hello,
Thanks for the library, it's great ! The live update callbacks work perfectly, it's an awesome feature.
The only thing thats seems to be missing when comparing to Shiny is the possibility to have different Tabs to build a proper dashboard. I guess this could be done with html and css, but it could be nice to have an object made for that.
Theo
Hi,
Building from an earlier issue, #53, I am calling out a few components that would be really useful based on the R/Shiny world.
It would be great to have an upload button component. I find it is a very common workflow to build dashboards that allow a user to upload a csv file and then display the contents in a table.
Thanks
Iaian
Hello,
I just went through the installation and that seemed fine.
https://plot.ly/dash/getting-started
Then I copied the code into a dash.py file and tried to run it (Python 2.7) and I got this:
python dash.py Traceback (most recent call last): File "dash.py", line 2, in <module> import dash File "/home/automater/Dokumente/Work/Projekte/Scrapy/fabrics/data_automate/dash.py", line 3, in <module> import dash_core_components as dcc File "/usr/local/lib/python2.7/dist-packages/dash_core_components/__init__.py", line 8, in <module> _components = _dash.development.component_loader.load_components( AttributeError: 'module' object has no attribute 'development'
Are there any other requirements or similar?
Thanks,
Chris
Can I use Dash application in offline environment?
My application can't access CDN servers and the loading page doesn't change.
cc: @Miserlou
So I ran the app locally for the first tutorial example here:
https://plot.ly/dash/getting-started
I tried deploying via zappa and got the following error:
(venv) rich@vbox:~/repos/explore_dash$ zappa deploy test
Calling deploy for stage test..
Creating zappa-permissions policy on ZappaLambdaExecution IAM Role.
Oh no! An error occurred! :(

==============

Traceback (most recent call last):
  File "/home/rich/.pyenv/versions/3.6.1/lib/python3.6/distutils/dir_util.py", line 70, in mkpath
    os.mkdir(head, mode)
FileExistsError: [Errno 17] File exists: '/tmp/user/1000/1498073842/dash'

During handling of the above exception, another exception occurred:

Traceback (most recent call last):
  File "/home/rich/repos/explore_dash/venv/lib/python3.6/site-packages/zappa/cli.py", line 2351, in handle
    sys.exit(cli.handle())
  File "/home/rich/repos/explore_dash/venv/lib/python3.6/site-packages/zappa/cli.py", line 456, in handle
    self.dispatch_command(self.command, stage)
  File "/home/rich/repos/explore_dash/venv/lib/python3.6/site-packages/zappa/cli.py", line 490, in dispatch_command
    self.deploy()
  File "/home/rich/repos/explore_dash/venv/lib/python3.6/site-packages/zappa/cli.py", line 650, in deploy
    self.create_package()
  File "/home/rich/repos/explore_dash/venv/lib/python3.6/site-packages/zappa/cli.py", line 1943, in create_package
    output=output
  File "/home/rich/repos/explore_dash/venv/lib/python3.6/site-packages/zappa/core.py", line 488, in create_lambda_zip
    copy_tree(temp_package_path, temp_project_path, update=True)
  File "/home/rich/.pyenv/versions/3.6.1/lib/python3.6/distutils/dir_util.py", line 159, in copy_tree
    verbose=verbose, dry_run=dry_run))
  File "/home/rich/.pyenv/versions/3.6.1/lib/python3.6/distutils/dir_util.py", line 135, in copy_tree
    mkpath(dst, verbose=verbose)
  File "/home/rich/.pyenv/versions/3.6.1/lib/python3.6/distutils/dir_util.py", line 74, in mkpath
    "could not create '%s': %s" % (head, exc.args[-1]))
distutils.errors.DistutilsFileError: could not create '/tmp/user/1000/1498073842/dash': File exists

==============
I removed the dash and dcc local files and it deployed fine. However, when I go to the AWS URL, I get the following error:
"{'message': 'An uncaught exception happened while servicing this request. You can investigate this with the `zappa tail` command.', 'traceback': ['Traceback (most recent call last):\\n', ' File \"/var/task/handler.py\", line 433, in handler\\n response = Response.from_app(self.wsgi_app, environ)\\n', ' File \"/var/task/werkzeug/wrappers.py\", line 903, in from_app\\n return cls(*_run_wsgi_app(app, environ, buffered))\\n', ' File \"/var/task/werkzeug/test.py\", line 884, in run_wsgi_app\\n app_rv = app(environ, start_response)\\n', ' File \"/var/task/zappa/middleware.py\", line 66, in __call__\\n response = self.application(environ, encode_response)\\n', \"TypeError: 'Dash' object is not callable\\n\"]}"I get the following when tailing the logs:
[1498077793326] /var/task/plotly/tools.py:103: UserWarning:
[1498077793326] Looks like you don't have 'read-write' permission to your 'home' ('~') directory or to our '~/.plotly' directory. That means plotly's python api can't setup local configuration files. No problem though! You'll just have to sign-in using 'plotly.plotly.sign_in()'. For help with that: 'help(plotly.plotly.sign_in)'.
'Dash' object is not callable
If the dash and dcc files are necessary, is there a way I can rename them and reference them separately?
Also is there a way I can run the first tutorial in offline mode?
thanks!
Since only a single Output is allowed in a callback, and all Inputs must feed into it, how can we determine which input is being triggered during a callback? I have three time-series line plots that I want to cross-filter, and update, any time a range is selected in any of the other plots. For example, the range of Plot A should update when either the range of Plot B or Plot C is updated. But the callback collects the ranges from all plots simultaneously. Is there a way to get the id of which input was triggered during a callback?
Here is my code but it only updates with data from plotB, when it is triggered. When I update Plot C the datac variable is indeed updated but the data from plotB is also passed in again, so the callback function has no knowledge of which plot is actually triggering new input.
@app.callback(
    Output('plotA', 'figure'),
    [Input('plotB', 'relayoutData'),
     Input('plotC', 'relayoutData')])
def display_selected_data(data, datac):

    print('data', data)
    print('datac', datac)

    startx = 'xaxis.range[0]' in data if data else None
    endx = 'xaxis.range[1]' in data if data else None

   # define the new xrange
    if startx and endx:
        xrange = [data['xaxis.range[0]'], data['xaxis.range[1]']]
    elif startx and not endx:
        xrange = [data['xaxis.range[0]'], thedates.max()]
    elif not startx and endx:
        xrange = [thedates.min(), data['xaxis.range[1]']]
    else:
        xrange = None

    traces = [go.Scatter(
        x=thedates,
        y=mdf['uniqvisits'])]
    return {
        'data': traces,
        'layout': get_layout('Unique Visits', 'Date', 'Unique Visits', xrange=xrange)
    }
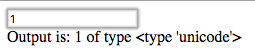
It seems that the type option of the Input class is not doing anything.
Code:
import dash
import dash_core_components as dcc
import dash_html_components as html
app = dash.Dash(__name__)
app.layout = html.Div(
    [
        dcc.Input(id='input', type='int'),
        html.Div(id='output')
    ]
)
@app.callback(
    dash.dependencies.Output('output', 'children'),
    [dash.dependencies.Input('input', 'value')]
)
def callback(value):
    return ['Output is: {} of type {}'.format(value, type(value))]
app.run_server(debug=True)
Is there any way to add a page with a link to various pages/plots I can redirect to? couldn't find it in the examples, may be some snippet would help.
Chris & Community,
Thanks for the earlier reply.
As I explore this more possibilities come to mind. This kind of mirrors some of the suggestions made earlier by some people about totally pythonic-react and highly reusable components without writing a line of javascript, which I think was your aim to start with.
I have made an attempt here. So I am trying to create an encapsulated panel (div) that has its own bundle of controls. So I am able to replicate the divisions within the app using a "parent" child node and naming convention.
The component is a class called custom_div and on initialization attaches itself to the main app layout.
A central callback function tied to a button that then adds a button.
This all seems to work.
my_div = custom_div(app, 'my_div')
However the key is to encapsulate the callback function within the new division. So that each new division has its own callback.
Do you think this is possible?
EXAMPLE CODE
# coding=utf-8
from pprint import pprint

import dash
import dash_core_components as dcc
import dash_html_components as html
from dash.dependencies import Event, State, Input, Output

app = dash.Dash()
app.config.supress_callback_exceptions = True

class custom_div:
    def __init__(self, dash_app, div_name):
        self.app = dash_app
        self.parent_name = div_name
        self.div = html.Div(id=div_name,
                            style={'background-color': 'yellow',
                                   'resize': 'both',
                                   'width': 500
                                   },
                            children=[
                                dcc.Input(id=self.gen_id('id_width'), value=200, type="number"),
                                html.Button('Set Width', id=self.gen_id('width-butt'), type='submit'),
                                html.P('mint', id=self.gen_id('mint'))
                            ])
        self.app.layout['root'].children.append(self.div)

    def gen_id(self, comp_name):
        return ''.join([self.parent_name, '.', comp_name])

app.layout = html.Div([
    html.Button('Add Div', id='add-div', type='submit'),
    html.Div(id='root', children=[]),
    html.P('INFO', id='info'),
])

@app.callback(
    Output('root', 'children'),
    events=[Event('add-div', 'click')],
)
def add_new_div():
    my_div = custom_div(app, 'new_div')
    return app.layout['root'].children

my_div = custom_div(app, 'my_div')

if __name__ == '__main__':
    app.run_server(debug=True)
Hello!
Is it possible to use Blueprint for instancing Dash app? not flask app itself.
this give easy integration to existing apps.
Extensions such as flask_sqlalchemy or whatever?
So right now, usage is,
import dash_core_components as dcc
import dash_html_components as html
Why not this?
import dash.core.components as dcc
import dash.html.components as html
And as optional dependencies,
pip install dash[core_components]
pip install dash[html_components]
Hi, I'm using Scatter to plot ~300K data points and finding slow rendering performance. Is this directly related to Plotly.js #741 or is this independent?
I will fork the project and rewrite it using only offline plots.
I am wondering if you want me to merge it somehow here.
One of the best features in shiny is the ability to make reactive expression tying together a number of different tasks so that multiple outputs could depend on the same intermediate step. This is particularly useful for example below when having a table and a plot depend on the same input which is being filtered/transformed using some of the reactive components. It also allows many of the longer expressions to be rewritten more modularly with fewer inputs
clean_data <- reactive({
       raw_df %>% subset(age>input$min_age) %>% subset(count<input$max_count)
})
output$result_table<-renderDataTable({clean_data()})
output$result_plot<-renderPlot({ggplot(clean_data(), aes(x = age, y = count))+geom_jitter()})
Clearly in dash this is a bit trickier, but presumably something like a new type of Dependency
@app.callback(
    dash.dependencies.ReactiveExpression('clean_data'),
    [dash.dependencies.Input('crossfilter-xaxis-column', 'value')])
def clean_data(xaxis_val):
    return raw_df.query('xaxis=={}'.format(xaxis_val))

@app.callback(
    dash.dependencies.Output('crossfilter-indicator-scatter', 'figure'),
    [dash.dependencies.ReactiveExpression('clean_data')])
def show_plot(in_data):
return dict(data = [], layout = go.Layout()Hello @chriddyp ,
I have executed example 3, but there is no interactivity between the graphics when clicking on a bubble representing a country. The country of the line chart is not updated.
Do you know why it can happen ?.
Thank you
Awesome package - based on the suggestion from I am calling out a couple of components that I have found incredibly useful in the Shiny universe. #53
It would be great to have a download button as a core component. In Shiny, it is a very common pattern to display data in a table and then to provide an option to download the contents of the table as a file
This is a minor issue but I've generated custom hovertext using the following pandas/python code:
df = df.rename(index=str, columns={"latitude": "lat", "longitude": "lon", "start": "Start", "end": "Finish", "merchant_color": "color"})
df['currency'] = df['current_price'].div(100).apply(lambda x: '${:,.2f}'.format(x))
df['Priceline'] = df.pre_price_text.str.cat(df.currency.astype(str), sep='</br><b>Current Price: </b>')
df['text'] = df.subcategory.str.cat(df.merchant.astype(str), sep='</br><b>Merchant: </b>')
df['text'] = df.text.str.cat(df.Priceline.astype(str), sep='</br><b>Pre-Price Text: </b>')
site_lat = list(df['lat'])
site_lon = list(df['lon'])
site_text = list(df['text'])
data = go.Data([
            go.Scattermapbox( lat=site_lat, lon=site_lon, mode='markers',
                marker=go.Marker(
                    size=10,
                    color=colors,
                    opacity=1
                ), legendgroup=locations_name, name=locations_name,
                text=site_text,
                hoverinfo='text' ) ])
layout = go.Layout( width=1000, height=600,
            margin=go.Margin(l=50, r=50, b=50, t=50, pad=4),
            title=map_title, autosize=True, hovermode='closest',
            mapbox=dict(
                accesstoken=mapbox_access_token, bearing=0, center=dict( lat=44, lon=-90 ), pitch=0, zoom=3, style='light' ) )

fig = dict(data=data, layout=layout)
The code works fine for generating custom html hover text for my maps and gantt charts in both plotly online and offline, but shows up as a single unbroken string with html codes in dash. Is there an undocumented string escape parameter I'm supposed to be using or is a byproduct of the react framework?
Here's how it looks in my normal plotly charts:

And here's how it looks in dash:

As I said, not a major issue but I assume I'm just missing something obvious.
the current error msg/log at jupyter notebook isnt really helpful

I'd like to set up multiple time-series plots and cross-filter between and it seems this doesn't work when I set the callback to trigger off selectedData. When I click and drag to select a subset of the time range, I am selecting data so it should propagate. clickData seems to work as normal but my guess is that's not really the common usage for time series.
I'm not entirely clear if this is even meant for deployed applications, since the docs don't get into that. The Werkzeug dev server is not guaranteed to be efficient, stable, or secure. Your guide should mention that Dash.run_server should only be used during development.
Another option would be to use Gunicorn in Dash.run_server instead of Flask.run, and not make your users decide.
If you don't want to write your own deploy docs, you can point at http://flask.pocoo.org/docs/dev/deploying/ and mention that the app instance is Dash.server. Since they have the option to serve static files locally, you should also mention serving them with the web server instead of Flask in that case.
Additionally, it is dangerous to enable debug mode by default, since that enables the interactive debugger. Since that's not mentioned in your docs, users may inadvertently expose themselves by calling run_server and binding to the outside world. Your docs already do run_server(debug=True) in most places, so simply changing the default would be safer.
Hi,
This looks like an incredible package!
Coming from the R/Shiny world, I would love if there was a tutorial for dash that showed how to create a dashboard similar to the shiny dashboard examples (https://rstudio.github.io/shinydashboard/examples.html)
For example, a simple app that showed the following 6 boxes would be incredibly useful
Box 1 - Markdown summary of app
Box 2 - upload a csv file
Box 3 - display contents of file in a DT table
Box 4 - display graph of table
Box 5 - display only rows of table that correspond to selection in graph
Box 6 - download csv file corresponding to table in box 4
Thanks
Iain
Hello !
I have a Dash app streaming twitter, it refreshes live with the interval callback.
However I would like to stop refreshing if I click on a "stop streaming" button. Would to be possible to have a condition as an event for the callbacks as well ?
Thanks,
Theo
Heads up! Edited on October 24, 2018
This issue comes up on google searches when folks haven't installed the necessary packages to run Dash.
If you find yourself here, then please visit the official installation instructions here: https://dash.plot.ly/installation
Thank you 🙇
hi ,
I'm trying to install the requirements.txt and running into functools32 .. I see tox.ini for python3 and python2.7 .. So , I'm assuming it is suppose to work .. any issues here ??
OS : Mac
Python Version: python 3.4
Collecting functools32==3.2.3.post2 (from -r requirements.txt (line 14))
Using cached functools32-3.2.3-2.zip
Complete output from command python setup.py egg_info:
This backport is for Python 2.7 only.
Saw this project on hacker news and was immediately intrigued. What would be really, really cool would be a more generalized project that acts as a front end to react such that we could write python and render react in flask. If such a project already exists, my apologies.
The current interface to specify a reactive function using decorator taking output and inputs as arguments is too verbose and doesn't feel very elegant.
Wouldn't it be better to say:
app['amount'].children = compute_amount(app['hours'].value, app['rate'].value)
instead of:
@app.callback(Output('amount', 'children'),
              [Input('hours', 'value'), Input('rate', 'value')])
def compute_amount(hours, rate):
    ...
The former one feels more natural way to specify the logic. Also, it makes it easy to use the same function in different scenarios. For example:
app['output1'].children = uppercase(app['input1'].value)
app['output2'].children = uppercase(app['input2'].value)
This would be too cumbersome to do with the current approach.
I've implemented a quick proof-of-concept code to demonstrate that such a thing is possible. The code and notes are available at:
https://gist.github.com/anandology/b93fd555215203977301ecb4994efe66
Most of the gallery examples use HTML divs with a CSS class value set. However, some parts have inline CSS. In cases where you have a dash/hyphen in the CSS property name, this won't work:
html.Tr([
                    ...
            ], style = dict(font-weight="bold")),
It gives an error: SyntaxError: keyword can't be an expression. The hyphen (-) is an operator in Python. It might be better in the demos to use the following syntax for dictionary creation which would then allow hyphens:
html.Tr([
                    ...
            ], style = {'font-weight':'bold'}),
Otherwise you have to do something like this:
html.Tr([
                    ...
            ], style = dict([('font-weight','bold')])),
I don't think this is as easy to read.
As an aside, it would be great to have a little more detail or an example into including local CSS files.
Thank you for all the hard work and this great project!
Thanks!
See #46 (comment) for more context
A declarative, efficient, and flexible JavaScript library for building user interfaces.
🖖 Vue.js is a progressive, incrementally-adoptable JavaScript framework for building UI on the web.
TypeScript is a superset of JavaScript that compiles to clean JavaScript output.
An Open Source Machine Learning Framework for Everyone
The Web framework for perfectionists with deadlines.
A PHP framework for web artisans
Bring data to life with SVG, Canvas and HTML. 📊📈🎉
JavaScript (JS) is a lightweight interpreted programming language with first-class functions.
Some thing interesting about web. New door for the world.
A server is a program made to process requests and deliver data to clients.
Machine learning is a way of modeling and interpreting data that allows a piece of software to respond intelligently.
Some thing interesting about visualization, use data art
Some thing interesting about game, make everyone happy.
We are working to build community through open source technology. NB: members must have two-factor auth.
Open source projects and samples from Microsoft.
Google ❤️ Open Source for everyone.
Alibaba Open Source for everyone
Data-Driven Documents codes.
China tencent open source team.