Code Monkey home page Code Monkey logo

devdash's Introduction

travis CLI Codacy Badge Go Report Card Hits-of-Code License Documentation logo of devdash with a gopher Tweet

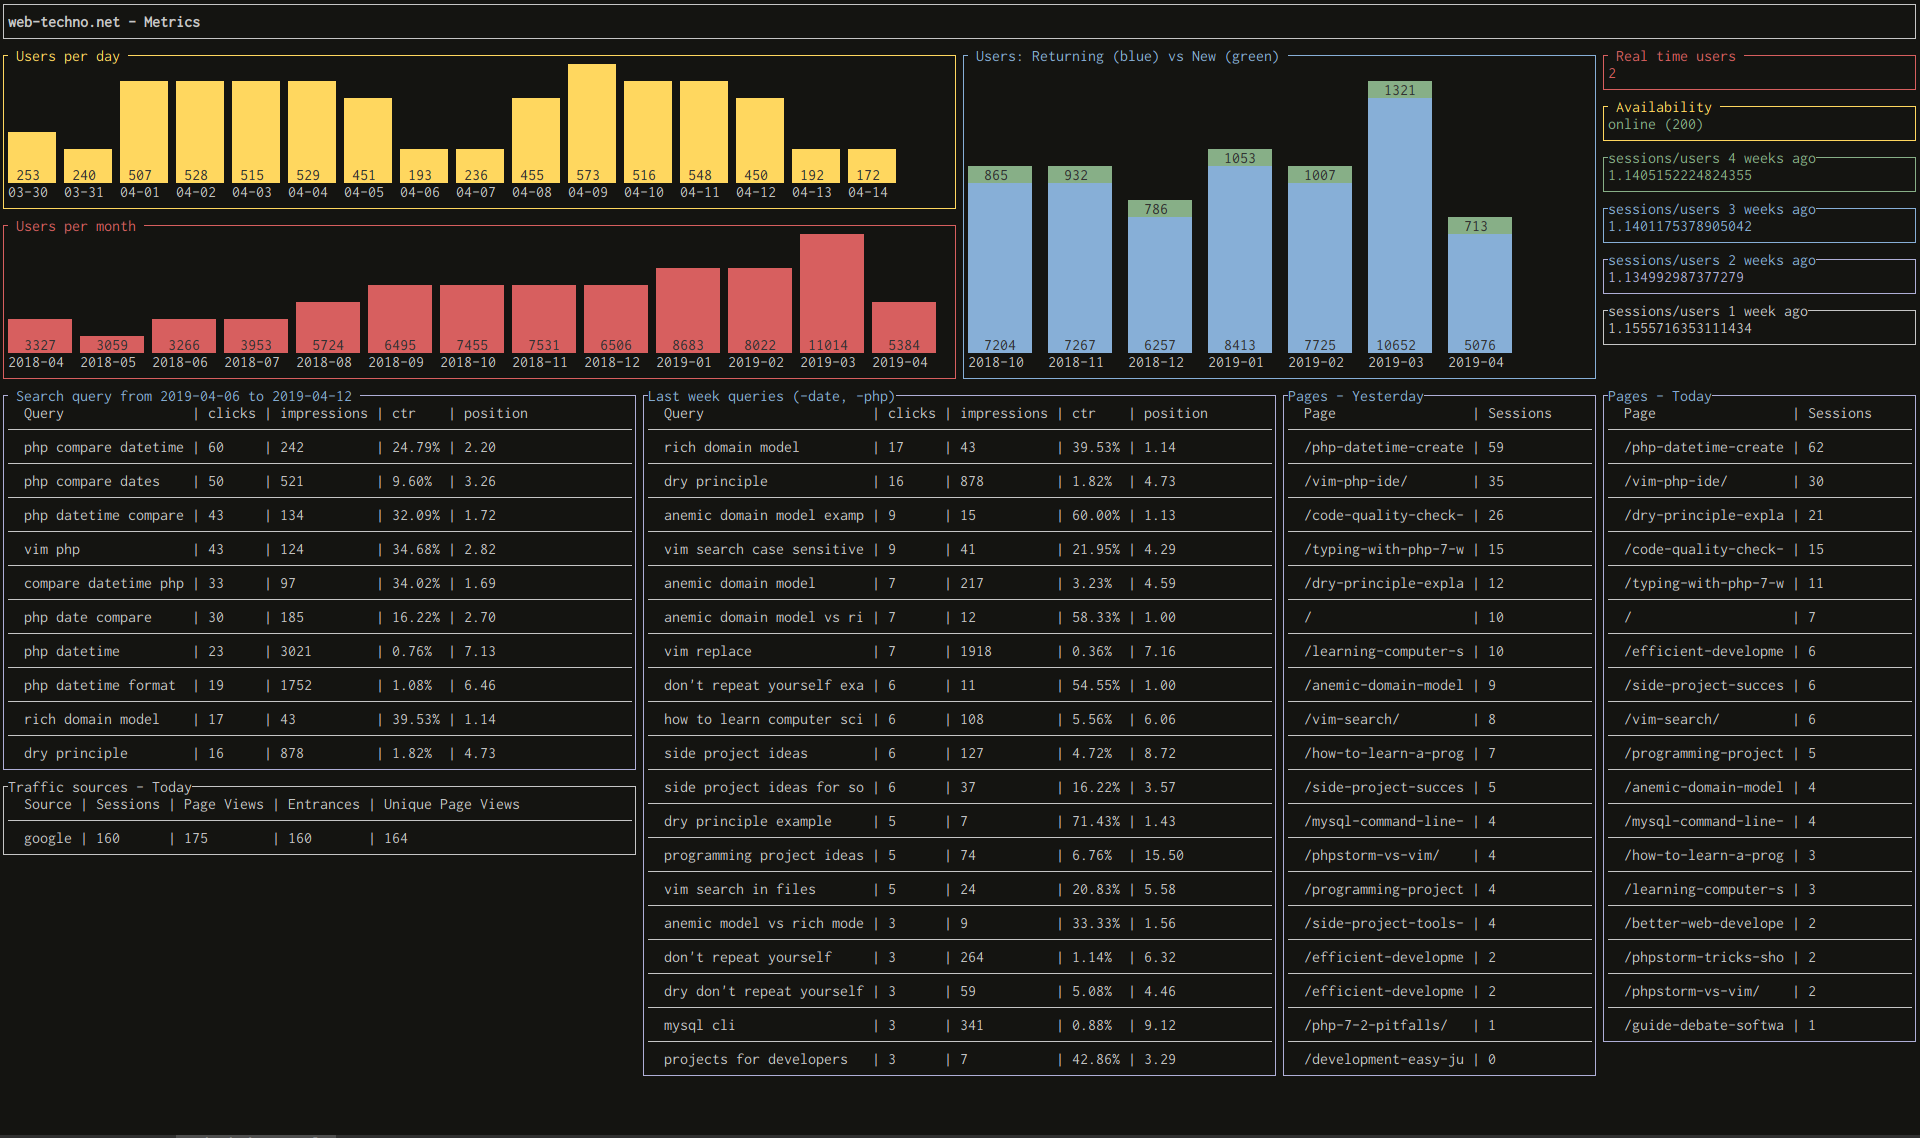
DevDash is a highly configurable terminal dashboard for developers and creators who want to choose and display the most up-to-date metrics they need, at one place.

google analytics example DevDash configuration

Why using DevDash?

  • Pull and display the data in nice widgets using YAML (or JSON) config files, from:

    • Your own computer. From your own scripts and command lines too!
    • A remote computer via SSH.
    • Github.
    • Travis.
    • Google Analytics.
    • Google Search Console.
    • Feedly.
  • A lot of flexibility compared to other terminal dashboards:

    • Choose the widgets you want.
    • Place your widgets where you want.
    • Choose the data you want to display, the colors you want to use, and a lot of other things for each widget.
    • Don't want to personalize everything? Don't overwrite the defaults, then.
  • Unlimited amount of different dashboards with different configurations.

  • Data refreshed automatically via time ticks, or via a keyboard shortcut (Ctrl + r by default).

Video

You can watch a quick demo on Youtube.

Menu

Installation

You can simply grab the latest released binary file and download the version you need, depending on your OS.

Linux script

To download DevDash in /usr/local/bin, run the following in a terminal:

curl -LO https://raw.githubusercontent.com/Phantas0s/devdash/master/install/linux.sh | bash

macOS

On macOS, DevDash can also be installed via MacPorts:

sudo port install devdash

More information here.

Manual installation

You need to:

  1. Clone this repository
  2. In your terminal, run in the root directory of the project go build devdash.go

Getting started

  • If you run devdash without giving a dashboard configuration, it will:
    • Create a config for the default dashboard (default.yml) in $XDG_CONFIG_HOME/devdash.
    • Display this default dashboard.
  • You have many examples here to modify this default dashboard or create your own from scratch.
  • Each dashboard need a config file. To pass this config file to DevDash, you need to use the option -c. For example: devdash -c default.
    • If you only pass the filename of the dashboard's config, it needs to be in the working directory or in $XDG_CONFIG_HOME/devdash.
    • You can also pass a relative or absolute path to the config.
    • The dashboard's config can be written in YAML, JSON, or TOML.

The value of $XDG_CONFIG_HOME depends of your OS. Here are the defaults (if you didn't modify it):

  • Unix systems: ~/.config
  • macOS: ~/Library/Application Support
  • Windows: %LOCALAPPDATA%

Documentation

The complete DevDash documentation is here

You'll find in there:

If you want to see even more real life examples, I've all of them in my dotfiles.

Acknowledgement

Thanks to MariaLetta for the awesome and beautiful Gopher pack! I used it for my logo on top.

DevDash was inspired from other open source projects:

Bugs and Ideas

If you have any idea to improve DevDash or if you see any bug, please open an issue.

Contribute

Thanks a lot if you want to contribute to DevDash!

If you want to implement a new feature, let's speak about it first (by opening an issue) and decide if it fits DevDash scope.

Making Of

For anybody interested how I managed to develop DevDash on side of a full time job, and how I organized my time and kept my motivation, I wrote an article about that on my blog.

Licence

Apache Licence 2.0

Showcase

google analytics example DevDash configuration

google analytics example DevDash configuration

google analytics example DevDash configuration

github example DevDash configuration

devdash's People

Contributors

chenrui333 avatar dependabot[bot] avatar herbygillot avatar kandros avatar phantas0s avatar

Stargazers

 avatar  avatar  avatar  avatar  avatar  avatar  avatar  avatar  avatar  avatar  avatar  avatar  avatar  avatar  avatar  avatar  avatar  avatar  avatar  avatar  avatar  avatar  avatar  avatar  avatar  avatar  avatar  avatar  avatar  avatar  avatar  avatar  avatar  avatar  avatar  avatar  avatar  avatar  avatar  avatar  avatar  avatar  avatar  avatar  avatar  avatar  avatar  avatar  avatar  avatar  avatar  avatar  avatar  avatar  avatar  avatar  avatar  avatar  avatar  avatar  avatar  avatar  avatar  avatar  avatar  avatar  avatar  avatar  avatar  avatar  avatar  avatar  avatar  avatar  avatar  avatar  avatar  avatar  avatar  avatar  avatar  avatar  avatar  avatar  avatar  avatar  avatar  avatar  avatar  avatar  avatar  avatar  avatar  avatar  avatar  avatar  avatar  avatar  avatar  avatar

Watchers

 avatar  avatar  avatar  avatar  avatar  avatar  avatar  avatar  avatar  avatar  avatar  avatar  avatar  avatar  avatar

devdash's Issues

gsc.table_pages not working?

version 0.5.0 / MacOS via homebrew

It seems widget elements for gsc.table_pages only show data from gsc.table_queries. What may be the reason?

Here the relevant YAML config, copied from the official example:

    services:
      google_search_console:
        keyfile: "/path/to/file.json"
        address: 'https://example.com'
    widgets:
      - row:
          - col:
              size: 12
              elements:
                - name: gsc.table_queries
                  options:
                    title: " Last month queries "
                    start_date: "last_month"
                    end_date: "last_month"
                    character_limit: 25
                    row_limit: 10
                    metrics: "clicks,impressions"
                    border_color: green
                    title_color: green
                    text_color: green
      - row:
          - col:
              size: 12
              elements:
                - name: gsc.table_pages
                  options:
                    title: " Last month pages "
                    start_date: "last_month"
                    end_date: "last_month"
                    character_limit: 25
                    row_limit: 10
                    border_color: yellow
                    title_color: yellow
                    text_color: yellow

and the console output:
grafik

Disclaimer: I am new in this Google-Cloud-Service-Account-Credentials-Key-Json-stuff hell and feel a bit overwhelmed – so, if the reason is to be located there, any hints are appreciated.

Is it possible on box widgets to show multiple lines on command output?

Hello @Phantas0s ! Thank you for devdash, it is an awesome tool I am incorporating to my daily routine.

I have a question regarding showing in a box the output of a command that expands to multiple lines.The box only outputs the first line, and I cannot find other way in the documentation to solve that. I thought the height option would be enough, but it is not.

I am attaching here an image with an example showing my devdash yaml configuration, the multilines output I am waiting (directly from the scripts) and what I am getting from running on devdash using my configuration.

Is that possible? If not, I would guess that as a new implementation you could do something similar to the table widget and name it to lh.multilines_box, e.g.

That is the only feature I miss from devdash now, and I think it limits its' potential to not be there.

Here is the image.

Count on me if you need more information and someone to help you with testing that.

Thank you!

Crash on `devdash edit`

Hey, I just installed devdash on Manjaro linux using the devdash-bin AUR package. (https://aur.archlinux.org/packages/devdash-bin) Upon running devdash edit I get the following crash:

panic: runtime error: index out of range [0] with length 0

goroutine 1 [running]:
github.com/Phantas0s/devdash/cmd.edit(0x13afc40, 0x0, 0x0)
	/home/hypnos/workspace/devdash/cmd/edit.go:29 +0x27c
github.com/Phantas0s/devdash/cmd.editCmd.func1(0xc00032e500, 0x13afc40, 0x0, 0x0)
	/home/hypnos/workspace/devdash/cmd/edit.go:19 +0x3f
github.com/spf13/cobra.(*Command).execute(0xc00032e500, 0x13afc40, 0x0, 0x0, 0xc00032e500, 0x13afc40)
	/home/hypnos/workspace/go/pkg/mod/github.com/spf13/[email protected]/command.go:856 +0x2c2
github.com/spf13/cobra.(*Command).ExecuteC(0x1375180, 0x13819c0, 0x0, 0xc000062778)
	/home/hypnos/workspace/go/pkg/mod/github.com/spf13/[email protected]/command.go:960 +0x375
github.com/spf13/cobra.(*Command).Execute(...)
	/home/hypnos/workspace/go/pkg/mod/github.com/spf13/[email protected]/command.go:897
github.com/Phantas0s/devdash/cmd.Execute()
	/home/hypnos/workspace/devdash/cmd/root.go:44 +0x31
main.main()
	/home/hypnos/workspace/devdash/devdash.go:6 +0x25

Trying to build cmd/devdash.go -> undefined: mapConfig/debug

I've been trying to build devdash from the current master branch with go 1.14.4

devdash$ GOOS=linux GOARCH=amd64 go build -o devdash cmd/devdash.go
# command-line-arguments
cmd/devdash.go:22:9: undefined: mapConfig
cmd/devdash.go:53:9: undefined: mapConfig
cmd/devdash.go:137:7: undefined: debug

Track pull requests of interest

This may be out of the purview of what you're intending to tackle with this project, but for a while now I've been hunting for a dashboard that can track pull requests that I'm involved in. The functionality I'd most hope for is that I could add a PR to the dashboard, and whenever there's a delta (added comments, resolved issues, etc...) it would become highlighted on the dashboard until I've "recognized" the update. I frequently deal with BitBucket and Github repositories, so it'd be really nice to have an aggregate view from these different source.

Issue on running windows (both x86 x64) precompiled binary

Hi when I try run on windows I endup with this error message:

panic: runtime error: slice bounds out of range [:-1]

goroutine 1 [running]:
github.com/spf13/viper.absPathify(0xd3f94e, 0x19, 0x0, 0x0)
/home/hypnos/workspace/go/pkg/mod/github.com/spf13/[email protected]/util.go:100 +0x44f
github.com/spf13/viper.(*Viper).AddConfigPath(0xc000294300, 0xd3f94e, 0x19)
/home/hypnos/workspace/go/pkg/mod/github.com/spf13/[email protected]/viper.go:415 +0x69
github.com/spf13/viper.AddConfigPath(...)
/home/hypnos/workspace/go/pkg/mod/github.com/spf13/[email protected]/viper.go:412
github.com/Phantas0s/devdash/cmd.mapConfig(0xc00001cd40, 0x35, 0x0, 0x0, 0x0, 0x0, 0x0)
/home/hypnos/workspace/devdash/cmd/config.go:181 +0x12d
github.com/Phantas0s/devdash/cmd.begin(0x0, 0x0, 0x0)
/home/hypnos/workspace/devdash/cmd/devdash.go:22 +0x137
github.com/Phantas0s/devdash/cmd.run(...)
/home/hypnos/workspace/devdash/cmd/root.go:40
github.com/Phantas0s/devdash/cmd.glob..func1(0x1389820, 0x13c1e78, 0x0, 0x0)
/home/hypnos/workspace/devdash/cmd/root.go:21 +0x4b
github.com/spf13/cobra.(*Command).execute(0x1389820, 0xc00003c1f0, 0x0, 0x0, 0x1389820, 0xc00003c1f0)
/home/hypnos/workspace/go/pkg/mod/github.com/spf13/[email protected]/command.go:846 +0x2a4
github.com/spf13/cobra.(*Command).ExecuteC(0x1389820, 0x445061, 0x13411a0, 0xc000037f78)
/home/hypnos/workspace/go/pkg/mod/github.com/spf13/[email protected]/command.go:950 +0x350
github.com/spf13/cobra.(*Command).Execute(...)
/home/hypnos/workspace/go/pkg/mod/github.com/spf13/[email protected]/command.go:887
github.com/Phantas0s/devdash/cmd.Execute()
/home/hypnos/workspace/devdash/cmd/root.go:33 +0x38
main.main()
/home/hypnos/workspace/devdash/devdash.go:6 +0x27

Config example to monitor multiple resources

Currently the docs show how to monitor one resource.

projects:
  - name: Default dashboard located at $HOME/.config/devdash/default.yml
    services:
      monitor:
        address: "https://example.org"
    widgets:
      - row:
          - col:
              size: "M"
              elements:
                - name: mon.box_availability
                  options:
                    title: " thevaluable.dev status "
                    color: yellow

I would like to add multiple addresses, so maybe make monitor take a list of dicts (each dict with name, address fields?)?

Devdash doesn't render

Description

I've just discovered DevDash and love the idea, so I'm trying to get it running. However, it doesn't seem to want to render. If I run it without a config I do get the message that I should use a config, but when I run with a config, I just get an empty terminal.

I'm running this inside of a tmux pane, but I've had the same experience running from the standard terminal.

OS
macOS Catalina 10.15

Install method
GoFish

Config

---
projects:
  - name: Fuelrats.com
    services:
      monitor:
        address: "https://fuelrats.com"
      widgets:
        - row:
          - col:
              size: "M"
              elements:
                - name: mon.box_availability
                  options:
                    border_color: green

Remaining copypaste from gocket

cmd/version seems to think that the current project is gocket. I believe the fix is just a simple rename

devdash/cmd/version.go

Lines 16 to 39 in e33bd83

func versionCmd() *cobra.Command {
versionCmd := &cobra.Command{
Use: "version",
Short: "Display gocket version",
Run: func(cmd *cobra.Command, args []string) {
fmt.Fprintln(os.Stdout, version())
},
}
return versionCmd
}
func version() string {
program := "gocket"
osArch := runtime.GOOS + "/" + runtime.GOARCH
date := buildDate
if date == "" {
date = "unknown"
}
return fmt.Sprintf("%s %s %s BuildDate=%s", program, current, osArch, date)
}

typo: ~plateform~ platform

additionally, compile error

opt := &github.BranchListOptions{
	ListOptions: github.ListOptions{PerPage: limit},
}
bs, _, err := g.client.Repositories.ListBranches(context.Background(), g.owner, repo, opt)

go get install fails with cannot use &opt (type *github.ListOptions) as type *github.BranchListOptions

First of all thanks for this excellent project.

Some details about my environment

OS: Ubuntu 18.04
Go version: 1.13(managed using asdf)

Tried to do the following,

go get -u github.com/Phantas0s/devdash/cmd/devdash

And ended up with this

# github.com/Phantas0s/devdash/internal/platform
/home/sam/.asdf/installs/golang/1.13/packages/src/github.com/Phantas0s/devdash/internal/platform/github.go:547:88: cannot use &opt (type *github.ListOptions) as type *github.BranchListOptions in argument to g.client.Repositories.ListBranches

Recommend Projects

  • React photo React

    A declarative, efficient, and flexible JavaScript library for building user interfaces.

  • Vue.js photo Vue.js

    🖖 Vue.js is a progressive, incrementally-adoptable JavaScript framework for building UI on the web.

  • Typescript photo Typescript

    TypeScript is a superset of JavaScript that compiles to clean JavaScript output.

  • TensorFlow photo TensorFlow

    An Open Source Machine Learning Framework for Everyone

  • Django photo Django

    The Web framework for perfectionists with deadlines.

  • D3 photo D3

    Bring data to life with SVG, Canvas and HTML. 📊📈🎉

Recommend Topics

  • javascript

    JavaScript (JS) is a lightweight interpreted programming language with first-class functions.

  • web

    Some thing interesting about web. New door for the world.

  • server

    A server is a program made to process requests and deliver data to clients.

  • Machine learning

    Machine learning is a way of modeling and interpreting data that allows a piece of software to respond intelligently.

  • Game

    Some thing interesting about game, make everyone happy.

Recommend Org

  • Facebook photo Facebook

    We are working to build community through open source technology. NB: members must have two-factor auth.

  • Microsoft photo Microsoft

    Open source projects and samples from Microsoft.

  • Google photo Google

    Google ❤️ Open Source for everyone.

  • D3 photo D3

    Data-Driven Documents codes.