Code Monkey home page Code Monkey logo

grafana-pcp's Introduction

Performance Co-Pilot Grafana Plugin

Build Status Documentation Status

Performance Co-Pilot (PCP) provides a framework and services to support system-level performance monitoring and management. It presents a unifying abstraction for all of the performance data in a system, and many tools for interrogating, retrieving and processing that data.

Vector Overview Vector Containers bpftrace Flame Graph Vector metrics autocompletion more screenshots

Features

  • analysis of historical PCP metrics using pmseries query language
  • analysis of real-time PCP metrics using pmwebapi live services
  • enhanced Berkeley Packet Filter (eBPF) tracing using bpftrace scripts
  • dashboards for detecting potential performance issues and showing possible solutions using the Utilization Saturation and Errors (USE) method [2]
  • full-text search in metric names, descriptions, instances [1]
  • support for Grafana Alerting [1]
  • support for derived metrics (allows the usage of arithmetic operators and statistical functions inside a query) [2]
  • automated configuration of metric units [1,2,3]
  • automatic rate and time utilization conversion
  • heatmap, table [2,3] and flame graph [3] support
  • auto completion of metric names [1,2], qualifier keys and values [1], and bpftrace probes, builtin variables and functions [3]
  • display of semantics, units and help texts of metrics [2] and bpftrace builtins [3]
  • legend templating support with $metric, $metric0, $instance, $some_label, $some_dashboard_variable
  • container support [1,2]
  • support for custom endpoint and hostspec per panel [2,3]
  • support for repeated panels
  • sample dashboards for all data sources

[1] PCP Redis [2] PCP Vector [3] PCP bpftrace

grafana-pcp's People

Contributors

akira-kurogane avatar andreasgerstmayr avatar arzoo14 avatar b-m-f avatar dependabot[bot] avatar erbenos avatar goodwinos avatar haoweiqiu avatar jasonk000 avatar natoscott avatar sfeifer avatar

Stargazers

 avatar  avatar  avatar  avatar  avatar  avatar  avatar  avatar  avatar  avatar  avatar  avatar  avatar  avatar  avatar  avatar  avatar  avatar  avatar  avatar  avatar  avatar  avatar  avatar  avatar  avatar  avatar  avatar  avatar  avatar  avatar  avatar  avatar  avatar  avatar  avatar  avatar  avatar  avatar  avatar  avatar  avatar  avatar  avatar  avatar  avatar  avatar  avatar  avatar  avatar  avatar  avatar  avatar  avatar  avatar  avatar  avatar  avatar  avatar  avatar  avatar  avatar  avatar  avatar  avatar  avatar  avatar  avatar  avatar  avatar  avatar  avatar  avatar  avatar  avatar  avatar  avatar  avatar  avatar  avatar  avatar  avatar  avatar  avatar  avatar  avatar  avatar  avatar  avatar  avatar  avatar  avatar  avatar  avatar  avatar  avatar  avatar  avatar  avatar  avatar

Watchers

 avatar  avatar  avatar  avatar  avatar  avatar  avatar  avatar  avatar  avatar  avatar  avatar  avatar  avatar  avatar  avatar

grafana-pcp's Issues

problem to install grafana-pcp plugin

Hi,
I am newbie to grafana and grafana-pcp plugin.

I am in trouble to install grafana-pcp plugin.

I installed grafana latest version using rpm.
$ rpm -qa | grep grafana
grafana-6.6.1-1.x86_64

I built grafana-pcp from the source. Here is the logs:
$ git clone https://github.com/performancecopilot/grafana-pcp.git
$ cd grafana-pcp
$ make
yarn install
yarn install v1.22.0
[1/4] Resolving packages...
[2/4] Fetching packages...
info [email protected]: The platform "linux" is incompatible with this module.
info "[email protected]" is an optional dependency and failed compatibility check. Excluding it from installation.
[3/4] Linking dependencies...
warning "@grafana/ui > @grafana/slate-react > [email protected]" has unmet peer dependency "slate-react@>=0.22.0".
[4/4] Building fresh packages...
Done in 6.14s.
yarn run build
yarn run v1.22.0
$ webpack --config webpack.config.prod.js
clean-webpack-plugin: /root/grafana-pcp-src/grafana-pcp/dist has been removed.
Hash: a02d25235442068f3faa
Version: webpack 4.41.5
Child
Hash: a02d25235442068f3faa
Time: 14138ms
Built at: 2020-02-13 11:31:07
Asset Size Chunks Chunk Names
./datasources/bpftrace/module.js 77.7 KiB 0 [emitted] ./datasources/bpftrace/module
./datasources/redis/module.js 45 KiB 1 [emitted] ./datasources/redis/module
./datasources/vector/module.js 61.3 KiB 2 [emitted] ./datasources/vector/module
./module.js 7.57 KiB 3 [emitted] ./module
./panels/flamegraph/module.js 91.2 KiB 4 [emitted] ./panels/flamegraph/module
LICENSE 11.1 KiB [emitted]
NOTICE 423 bytes [emitted]
README.md 2.16 KiB [emitted]
components/config/config.html 630 bytes [emitted]
components/config/css/config.css 202 bytes [emitted]
dashboards/pcp-bpftrace-flame-graphs.json 5.68 KiB [emitted]
dashboards/pcp-bpftrace-system-analysis.json 29.6 KiB [emitted]
dashboards/pcp-redis-host-overview.json 48.2 KiB [emitted]
dashboards/pcp-vector-container-overview.json 10.4 KiB [emitted]
dashboards/pcp-vector-host-overview.json 63.8 KiB [emitted]
datasources/bpftrace/README.md 121 bytes [emitted]
datasources/bpftrace/css/query-editor.css 38 bytes [emitted]
datasources/bpftrace/img/eBPF.png 155 KiB [emitted]
datasources/bpftrace/partials/annotations.editor.html 212 bytes [emitted]
datasources/bpftrace/partials/config.html 1.68 KiB [emitted]
datasources/bpftrace/partials/query.editor.html 1.75 KiB [emitted]
datasources/bpftrace/plugin.json 569 bytes [emitted]
datasources/redis/README.md 115 bytes [emitted]
datasources/redis/img/redis.png 27.3 KiB [emitted]
datasources/redis/img/redis.svg 5.22 KiB [emitted]
datasources/redis/partials/annotations.editor.html 212 bytes [emitted]
datasources/redis/partials/config.html 115 bytes [emitted]
datasources/redis/partials/query.editor.html 1.4 KiB [emitted]
datasources/redis/plugin.json 699 bytes [emitted]
datasources/vector/README.md 117 bytes [emitted]
datasources/vector/css/query-editor.css 63 bytes [emitted]
datasources/vector/img/vector.png 42.8 KiB [emitted]
datasources/vector/img/vector.svg 12.2 KiB [emitted]
datasources/vector/partials/annotations.editor.html 212 bytes [emitted]
datasources/vector/partials/config.html 1.68 KiB [emitted]
datasources/vector/partials/query.editor.html 2.05 KiB [emitted]
datasources/vector/plugin.json 580 bytes [emitted]
img/pcp-logo.svg 3 KiB [emitted]
panels/flamegraph/css/flamegraph.css 560 bytes [emitted]
panels/flamegraph/img/flamegraph.svg 21.1 KiB [emitted]
panels/flamegraph/plugin.json 455 bytes [emitted]
plugin.json 2.36 KiB [emitted]
Entrypoint ./module = ./module.js
Entrypoint ./datasources/redis/module = ./datasources/redis/module.js
Entrypoint ./datasources/vector/module = ./datasources/vector/module.js
Entrypoint ./datasources/bpftrace/module = ./datasources/bpftrace/module.js
Entrypoint ./panels/flamegraph/module = ./panels/flamegraph/module.js
[0] external "lodash" 42 bytes {0} {1} {2} {4} [built]
[1] ./datasources/lib/models/datasource.ts 315 bytes {0} {1} {2} [built]
[2] ./datasources/lib/utils.ts 1.99 KiB {0} {1} {2} [built]
[3] external "react" 42 bytes {4} [built]
[19] external "@grafana/data" 42 bytes {4} [built]
[46] ./datasources/lib/services/panel_transformation_srv.ts 13 KiB {0} {1} {2} [built]
[47] ./datasources/lib/services/value_transformation_srv.ts 2.6 KiB {0} {1} {2} [built]
[48] ./datasources/lib/models/errors.ts 1.45 KiB {0} {1} {2} [built]
[49] ./datasources/lib/pcp_query_ctrl.ts 3.44 KiB {0} {1} {2} [built]
[51] external "@grafana/ui" 42 bytes {4} [built]
[95] ./panels/flamegraph/module.tsx + 49 modules 40.2 KiB {4} [built]
| ./panels/flamegraph/module.tsx 307 bytes [built]
| ./panels/flamegraph/FlameGraphPanel.tsx 2.07 KiB [built]
| ./panels/flamegraph/FlameGraphPanelEditor.tsx 2.94 KiB [built]
| ./panels/flamegraph/types.ts 103 bytes [built]
| ./panels/flamegraph/FlameGraphChart.tsx 4.83 KiB [built]
| ./panels/flamegraph/model.ts 3.93 KiB [built]
| + 44 hidden modules
[96] ./datasources/bpftrace/module.ts + 6 modules 36 KiB {0} [built]
| ./datasources/bpftrace/module.ts 788 bytes [built]
| ./datasources/bpftrace/datasource.ts 7.56 KiB [built]
| ./datasources/bpftrace/query_ctrl.ts 2.36 KiB [built]
| ./datasources/bpftrace/script.ts 469 bytes [built]
| ./datasources/bpftrace/script_registry.ts 11.3 KiB [built]
| ./datasources/bpftrace/completer.ts 9.21 KiB [built]
| ./datasources/bpftrace/mode-bpftrace.ts 4.32 KiB [built]
[97] ./datasources/redis/module.ts + 6 modules 54.3 KiB {1} [built]
| ./datasources/redis/module.ts 740 bytes [built]
| ./datasources/redis/datasource.ts 16 KiB [built]
| ./datasources/redis/query_ctrl.ts 2.33 KiB [built]
| ./datasources/redis/pmseries_srv.ts 23.6 KiB [built]
| ./datasources/redis/completer.ts 9.51 KiB [built]
| ./datasources/redis/mode-pmseries.ts 2.14 KiB [built]
| ./datasources/redis/models/pmseries.ts 34 bytes [built]
[98] ./datasources/vector/module.ts + 4 modules 22.9 KiB {2} [built]
| ./datasources/vector/module.ts 756 bytes [built]
| ./datasources/vector/datasource.ts 6.17 KiB [built]
| ./datasources/vector/query_ctrl.ts 7.35 KiB [built]
| ./datasources/vector/completer.ts 7.15 KiB [built]
| ./datasources/vector/mode-pcp.ts 1.45 KiB [built]
[99] ./module.ts + 1 modules 350 bytes {3} [built]
| ./module.ts 105 bytes [built]
| + 1 hidden module
+ 94 hidden modules
Done in 14.85s.
$ cd ..
$ mv grafana-pcp performancecopilot-pcp-app
$ grafana-cli plugins install performancecopilot-pcp-app

Error: โœ— Failed to find requested plugin, check if the plugin_id is correct: 404 not found error

NAME:
Grafana cli plugins install - install <plugin version (optional)>

USAGE:
Grafana cli plugins install [arguments...]
$

I tried to copy grafana-pcp plugin to /var/lib/grafana/plugins,
but I could not find grafana-pcp plugin from the web.

Bad gateway

Sorry, this is probably a silly question but your documentation is extremely short.

I have configured everything I could in grafana, but when adding the PCP datasource I get "Error: Bad Gateway. To use this data source, please configure the URL in the query editor."

I have no idea what I should configure instead of the default:
image

From what I have understood, this is where the data comes from. (Grafana server and pmproxy running on the same host). I've check with netstat that pmproxy is listening on this port.

Print substrings or portions of legend metrics name

Data source: PCP-Redis

Is your feature request related to a problem? Please describe.
The problem is that there are some metrics like the metrics related to procs, like hotproc.memory.rss (or similar) that prints the rss of some processes, but sometimes this processes can have a very very long name (like java processes), that doesn't give useful information, and the graphic that results has very long legend name and is unreadable if there are a high number of processes, and i want to only select a portion of this long name, for example i can have:

server.hotproc.memory.rss.056363 java -Xmx8G -Xms512M -Djava 2Esecurity2Eegd 3Dfile 3A///dev/2E/urandom -Djava2Esecurity -Djava 2Esecurity 2Emanager SCM PARAMS 2020 2E062E16

And i only want the legend have one of the last fields, like SCM

Describe the solution you'd like

Would be useful in the legend field of grafana-pcp, to enter some regular expression to only show the field in the legend that you are interested, like a substring of the full legend original name, or some portion of that

Describe alternatives you've considered

An alternative for example would be to replace some values to another shorter, for example in the previous:

server.hotproc.memory.rss.056363 java -Xmx8G -Xms512M -Djava2Esecurity 2Eegd 3Dfile3A///dev/2E/urandom -Djava 2Esecurity 2Emanager SCM PARAMS 2020 2E06 2E16

If all the processes start with the same process name can substitute:

server.hotproc.memory.rss.056363 java -Xmx8G -Xms512M -Djava 2Esecurity2Eegd 3Dfile 3A///dev/ 2E/urandom -Djava 2Esecurity 2Emanager -> To some name like "Memory", and this would give a shorter legend much more readable

Additional context

Release 2.0.0 breaks plugin page with JS error

Navigating to the plugin page of grafana-pcp (to activate it) causes a JS error and infinite loading spinner:

Error: define is not a function
  Evaluating https://grafana/public/plugins/performancecopilot-pcp-app/module.js
  Loading plugins/performancecopilot-pcp-app/module

Plugin was installed via docker env GF_INSTALL_PLUGINS: "https://github.com/performancecopilot/grafana-pcp/archive/v2.0.0.zip;grafana-pcp".

Stored data disappear

Describe the bug
The data collected since a date is not displayed. We have been collecting data for more than a week and everything was shown from the dashboard, but suddenly, there is data that is not shown. Depending on the type of metric, it shows more to less data.

To Reproduce
Steps to reproduce the behavior:

  1. Go to '...'
  2. Click on '....'
  3. Scroll down to '....'
  4. See error

Expected behavior
Show all data from the date it started to be collected.
On the other hand, I have to say that I also don't know how to retain data for a specific amount of time.

Screenshots
If applicable, add screenshots to help explain your problem.
Capture

Versions (please complete the following information):

  • Performance Co-Pilot: 5.0.3
  • Grafana: 6.7.2
  • grafana-pcp: 2.0.2
  • Redis (if applicable): 5.0.8

Additional context
Add any other context about the problem here.

Unable to install BCC - Many panels in Grafana BPF trace system analysis dashboard are not working

Installed the following on my linux server with these below versions:

root@sv-debian-02:/home/ranicete/bpftrace# cat /proc/version
Linux version 4.9.0-8-amd64 ([email protected]) (gcc version 6.3.0 20170516 (Debian 6.3.0-18+deb9u1) ) #1 SMP Debian 4.9.130-2 (2018-10-27)

root@sv-debian-02:/home/ranicete/bpftrace# redis-server --version
Redis server v=5.0.3 sha=00000000:0 malloc=jemalloc-5.1.0 bits=64 build=afa0decbb6de285f

root@sv-debian-02:/var/log/pcp/pmlogger/sv-debian-02# python --version
Python 2.7.16

root@sv-debian-02:/home/ranicete/bpftrace# grafana-server --v
Version 6.6.1 (commit: 21bf8b71bc, branch: HEAD)

root@sv-debian-02:/home/ranicete/bpftrace# pcp --version
pcp version 5.0.2

root@sv-debian-02:/home/ranicete/bpftrace# bpftrace --v
bpftrace v0.9.4-17-g471e

Grafana pcp plugin - grafana-pcp-2.0.0-beta1

On Grafana web browser, under Vector dashboard, 2 panels are not working:
BCC Disk latency and Run queue latency.
The error message is :
Cannot find metric bcc.runq.latency. Please check if the PMDA is enabled.

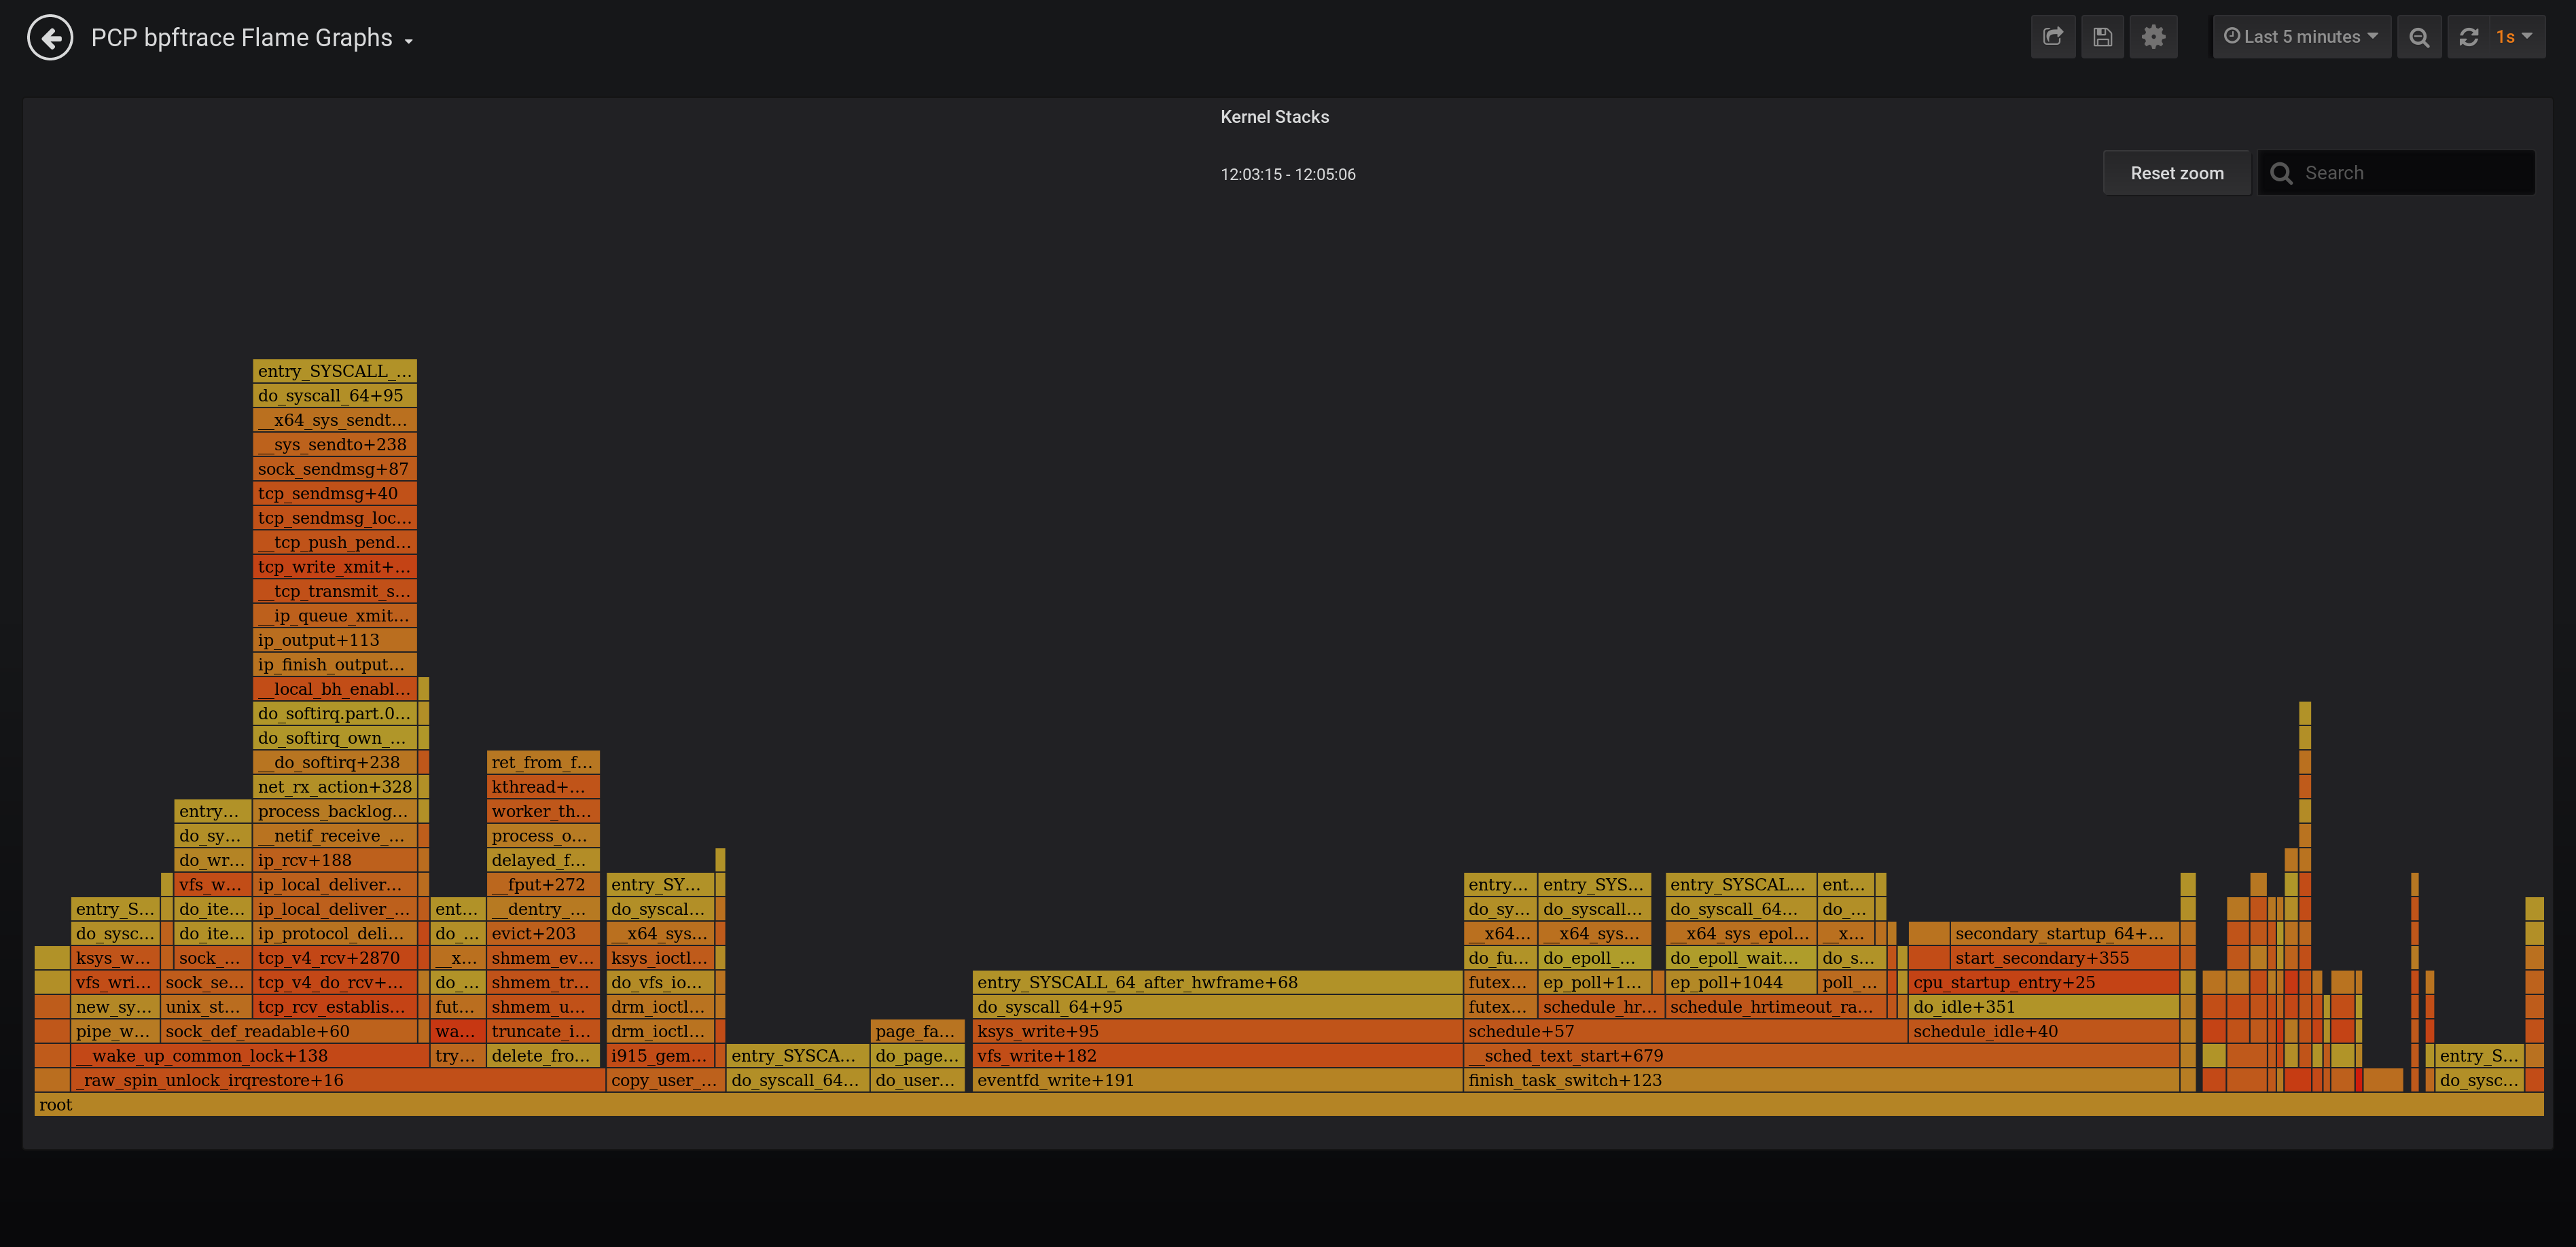
On Grafana web browser, under BPF trace system analysis and flamegraphs, lot of panels are not working:
The error message is :
modprobe : FATAL : Module Kheaders not found in directory /lib/modules/4.9.0-8-amd64 definitions.h : 10.3: error unknown type name "pid_t"

Hence,tried to install BCC, but it failed with below error, can you please let me know how to proceed further?
root@sv-debian-02:/var/lib/pcp/pmdas/bcc# ./Install
[Wed Feb 19 20:25:48] pmdabcc(18427) Info: Initializing, currently in 'notready' state.
[Wed Feb 19 20:25:48] pmdabcc(18427) Info: Enabled modules:
[Wed Feb 19 20:25:48] pmdabcc(18427) Info: ['biolatency', 'sysfork', 'tcpperpid', 'runqlat']
[Wed Feb 19 20:25:48] pmdabcc(18427) Info: Configuring modules:
[Wed Feb 19 20:25:48] pmdabcc(18427) Info: biolatency
[Wed Feb 19 20:25:48] pmdabcc(18427) Info: sysfork
[Wed Feb 19 20:25:48] pmdabcc(18427) Info: tcpperpid
[Wed Feb 19 20:25:48] pmdabcc(18427) Info: runqlat
[Wed Feb 19 20:25:48] pmdabcc(18427) Info: Modules configured.
[Wed Feb 19 20:25:48] pmdabcc(18427) Info: Initializing modules:
[Wed Feb 19 20:25:48] pmdabcc(18427) Info: biolatency
[Wed Feb 19 20:25:48] pmdabcc(18427) Error: No module named 'bcc'
[Wed Feb 19 20:25:48] pmdabcc(18427) Error: Traceback (most recent call last):
File "/var/lib/pcp/pmdas/bcc/pmdabcc.python", line 206, in init_modules
mod = importlib.import_module('modules.%s' % self.modules[module][MODULE])
File "/usr/lib/python3.7/importlib/init.py", line 127, in import_module
return _bootstrap._gcd_import(name[level:], package, level)
File "", line 1006, in _gcd_import
File "", line 983, in _find_and_load
File "", line 967, in _find_and_load_unlocked
File "", line 677, in _load_unlocked
File "", line 728, in exec_module
File "", line 219, in _call_with_frames_removed
File "/var/lib/pcp/pmdas/bcc/modules/biolatency.py", line 20, in
from bcc import BPF
ModuleNotFoundError: No module named 'bcc'

[Wed Feb 19 20:25:48] pmdabcc(18427) Error: Module biolatency not found, aborting.
[Wed Feb 19 20:25:48] pmdabcc(18431) Info: Initializing, currently in 'notready' state.
[Wed Feb 19 20:25:48] pmdabcc(18431) Info: Enabled modules:
[Wed Feb 19 20:25:48] pmdabcc(18431) Info: ['biolatency', 'sysfork', 'tcpperpid', 'runqlat']
[Wed Feb 19 20:25:48] pmdabcc(18431) Info: Configuring modules:
[Wed Feb 19 20:25:48] pmdabcc(18431) Info: biolatency
[Wed Feb 19 20:25:48] pmdabcc(18431) Info: sysfork
[Wed Feb 19 20:25:48] pmdabcc(18431) Info: tcpperpid
[Wed Feb 19 20:25:48] pmdabcc(18431) Info: runqlat
[Wed Feb 19 20:25:48] pmdabcc(18431) Info: Modules configured.
[Wed Feb 19 20:25:48] pmdabcc(18431) Info: Initializing modules:
[Wed Feb 19 20:25:48] pmdabcc(18431) Info: biolatency
[Wed Feb 19 20:25:48] pmdabcc(18431) Error: No module named 'bcc'
[Wed Feb 19 20:25:48] pmdabcc(18431) Error: Traceback (most recent call last):
File "/var/lib/pcp/pmdas/bcc/pmdabcc.python", line 206, in init_modules
mod = importlib.import_module('modules.%s' % self.modules[module][MODULE])
File "/usr/lib/python3.7/importlib/init.py", line 127, in import_module
return _bootstrap._gcd_import(name[level:], package, level)
File "", line 1006, in _gcd_import
File "", line 983, in _find_and_load
File "", line 967, in _find_and_load_unlocked
File "", line 677, in _load_unlocked
File "", line 728, in exec_module
File "", line 219, in _call_with_frames_removed
File "/var/lib/pcp/pmdas/bcc/modules/biolatency.py", line 20, in
from bcc import BPF
ModuleNotFoundError: No module named 'bcc'

[Wed Feb 19 20:25:48] pmdabcc(18431) Error: Module biolatency not found, aborting.
Install: cannot determine the Performance Metrics Domain from domain.h.python

Not able to specify hostspec in grafana

I am using PCP in distributed manner.
There are 4 hosts-

Host1, Host2 : runs only pmcd
Host3: runs only pmproxy
Host4: running only Grafana server with pcp vector plugin.
I am using Grafana pcp-vector to connect to Host1 & Host2 pmcd via pmproxy running on Host3.

But I am not able to specify pmcd hostspec in grafana url.
Please suggest a procedure to define hostspec.

Filter requests by labels

I could not find the information in docs, so I assume the feature is not there. I am trying to get metric for particular instance, but after trying many different ways to write a query, I came a conclustion that this is not yet supported. Is that so?

What I mean in particular is the possibility to write queries like:

cgroup.cpu.stat.usage{instance="xxxxxxx"}

rethink caching strategy

invalidate cache based on number of entries, time, other?
parallel /metric? requests for the same metric (bpftrace scripts_json metric)
store everything in single state object?

redis backfilling

for the vector datasource, we can check if redis is configured and optionally backfill the history with data from redis

support grafana alerting

Grafana comes with alerting [1], which is easy to configure and supports multiple communication channels [2].

In order to support alerting, the datasource query code needs to be implemented as a backend plugin. It's recommended to use Go, but other languages also work (as long as they come with gRPC support) [3].

Additional benefit for the Vector datasource: Caching could happen on the server, so a page reload doesn't clear the metric values cache.

[1] https://grafana.com/docs/grafana/latest/alerting/alerts-overview/
[2] https://grafana.com/docs/grafana/latest/alerting/notifications/
[3] https://grafana.com/docs/grafana/latest/developers/plugins/backend/plugin-protocol/#writing-plugins-without-go

hotproc does not work as I expected and does not show up on grafana dashboard

I have added and loaded one hotproc predicate as:

root@chassis1-gx:/var/lib/pcp/pmdas/proc# pmstore hotproc.control.config cpuburn > 0.5
root@chassis1-gx:/var/lib/pcp/pmdas/proc# pmstore hotproc.control.reload_config "1"
hotproc.control.reload_config old value=0 new value=1

dumped the data pertaining to the metric, instead of one qualified process it shows a bunch:
root@chassis1-gx:/var/lib/pcp/pmdas/proc# pminfo -ft hotproc.predicate.cpuburn

hotproc.predicate.cpuburn [CPU utilization per "interesting" process]
inst [1 or "000001 /usr/bin/qemu-aarch64"] value 0
inst [25641 or "025641 /usr/bin/qemu-aarch64"] value 0.54307693
inst [25736 or "025736 /usr/bin/qemu-aarch64"] value 0
inst [20990 or "020990 /usr/bin/qemu-aarch64"] value 0.00076923077
inst [940 or "000940 /usr/bin/qemu-aarch64"] value 0
inst [946 or "000946 /var/lib/pcp/pmdas/proc/pmdaproc"] value 0
inst [949 or "000949 /usr/bin/qemu-aarch64"] value 0
inst [952 or "000952 /usr/bin/qemu-aarch64"] value 0
inst [955 or "000955 /usr/bin/qemu-aarch64"] value 0

Here is a top

root@chassis1-gx:/var/lib/pcp/pmdas/proc# top
top - 18:18:12 up 15:26, 0 users, load average: 1.00, 1.02, 1.00
Tasks: 13 total, 0 running, 13 sleeping, 0 stopped, 0 zombie
%Cpu(s): 18.2 us, 9.1 sy, 0.0 ni, 51.5 id, 15.2 wa, 0.0 hi, 6.1 si, 0.0 st
MiB Mem : 1966.3 total, 120.5 free, 543.3 used, 1302.5 buff/cache
MiB Swap: 1024.0 total, 1013.4 free, 10.6 used. 1265.0 avail Mem

PID USER PR NI VIRT RES SHR S %CPU %MEM TIME+ COMMAND
25641 root 20 0 125752 12276 3632 D 56.2 0.6 163:28.19 bash
1 root 20 0 125236 10744 4932 S 0.0 0.5 0:00.09 start.sh
935 pcp 20 0 130492 14800 5328 S 0.0 0.7 0:05.23 pmcd
940 root 20 0 128840 11380 5468 S 0.0 0.6 0:00.49 pmdaroot
946 root 20 0 129336 15040 5820 S 0.0 0.7 0:29.87 pmdaproc
949 root 20 0 128228 8736 5120 S 0.0 0.4 0:00.94 pmdaxfs
952 root 20 0 128784 12220 5516 S 0.0 0.6 0:23.02 pmdalinux
955 root 20 0 128204 10844 5060 S 0.0 0.5 0:00.40 pmdakvm
3119 pcp 20 0 129004 14428 5972 S 0.0 0.7 0:00.93 pmie
20867 pcp 20 0 130012 15132 5712 S 0.0 0.8 0:03.23 pmlogger
20990 root 20 0 125624 13792 5224 S 0.0 0.7 0:00.94 bash
25736 root 20 0 123292 5592 3576 S 0.0 0.3 0:00.01 sleep
25748 root 0 0 127068 10960 4996 0 0.0 0.5 0:00.00 /usr/bin/top

First, should not hotproc show only processes that qualifies the predicate ?

Secondly, when I used vector datasource on grafana, if I use a dash board collecting hotproc.predicate.cpuburn, nothing shows up.
I changed it to hotproc.total.cpuburn then it show the total, which means the dashboard is capable of fetching the data. May be hotproc.predicate.cpuburn does not produce valid data for the vector query.

Please help providing me some successful steps of creating hotproc predicates and visualizing them on grafana.

Regards,
Raj

Support for Grafana v6.4?

I noticed that this plugin doesn't work for Grafana v6.4.x. To reproduce:

git clone https://github.com/kleisauke/pcp-preview.git
cd pcp-preview
docker build -t pcp-preview .
docker run -d --privileged -p 3000:3000 pcp-preview

The following errros appear when you try to open a dashboard (for e.g. the PCP Redis Host Overview dashboard):

PCP Redis plugin failed
Error: ace is not defined Evaluating http://localhost:3000/public/plugins/performancecopilot-pcp-app/datasources/redis/module.js Loading plugins/performancecopilot-pcp-app/datasources/redis/module

grafana-pcp

Note that it's working fine when I install Grafana v6.3.6:

diff --git a/Dockerfile b/Dockerfile
index 1111111..2222222 100644
--- a/Dockerfile
+++ b/Dockerfile
@@ -56,7 +56,7 @@ RUN rpmkeys --import file:///etc/pki/rpm-gpg/RPM-GPG-KEY-centosofficial \
 
 # Install PCP, Redis and Grafana
 RUN dnf -y install --setopt=tsflags=nodocs \
-        redis grafana \
+        redis grafana-6.3.6 \
         $(ls /pcp-rpms/pcp-{5,libs-5,conf,selinux}*.x86_64.rpm) \
     && dnf clean all \
     && systemctl enable redis pmcd pmlogger pmproxy grafana-server grafana-configuration

Let me know if you need further information.

Data Sources not appearing

Data source: All

Describe the bug
After installing the grafana-pcp plugin, no new PCP data sources are available.

To Reproduce
Steps to reproduce the behavior:

  • docker create --name grafana-pcp-repro -e GF_INSTALL_PLUGINS="https://github.com/performancecopilot/grafana-pcp/archive/v2.0.2.zip;grafana-pcp" -p 3000:3000 grafana/grafana:7.1.5
  • docker container start grafana-pcp-repro
  • Wait a minute for grafana to start up
  • docker logs grafana-pcp-repro & check last line of output is "HTTP Server Listen", so grafana has started
  • We now restart grafana after installing plugins:
  • docker container stop grafana-pcp-repro
  • docker container start grafana-pcp-repro
  • Connect to grafana via web browser (http://localhost:3000 if running docker locally)
  • Login as admin/admin
  • Go to configuration/data sources & click add data source
  • No PCP options listed

You can cleanup by deleting the docker container with docker container rm -f grafana-pcp-repro

Expected behavior
The PCP data sources are available

Screenshots
If applicable, add screenshots to help explain your problem.

Versions (please complete the following information):

  • Performance Co-Pilot: N/A
  • Grafana: 7.1.5 (also tested with 6.7.2)
  • grafana-pcp: 2.0.2
  • Redis (if applicable): N/A

Additional context
N/A

Dashboard of grafana-pcp does not show data.

Hi,
my settings:
RHEL 7.7
grafana-pcp 2.0.2
grafana-server 6.7.2
pcp 5.1.0-1
Redis server v=3.2.12
I am trying to collect statistics from different machines and be able to see from Grafana, but, the grafana-pcp dashboard does not show anything: it shows word 'services' continuously. In machine it is observed that pmlogger collects data, but, activity is not observed in pmproxy ports or in redis. The pmproxy and redis settings are the default.
Thanks

Roadmap for 3.0

  • replace angular with react #38
  • rethink caching strategy #11
  • automatically set unit by datasource #20
  • support derived metrics #13
  • use web worker to poll in background #3
  • use jsonnet to store grafana dashboards #32
  • update polltimeout according to the current poll interval #51
  • configurable hostspec #52

add help texts and units for PCP Redis auto-completion

each metric can have multiple series (from different hosts with possibly different PCP versions), which may result in multiple different help texts for a single metric. not sure yet how to solve this one.

same for units, which otoh shouldn't change between PCP releases

typing

  • use default typescript settings (tsconfig.json)
  • strict mode
  • create types for API responses
  • typing for REST API clients

Query remote systems from central Grafana?

So I've been experimenting, and as best I can tell if I want to monitor remote systems, I either need to install PCP and Grafana on each system and then connect to grafana on each system as I want to view it's metrics, or I need to create a Vector datasource for each remote system I want to query.

I would really like to be able to build a dashboard on centralized grafana server(s) where I could select a hostname/ip from a list, and then view PCP metrics from that remote host. Is there a better way than having a datasource for each remote system? Something using pmproxy perhaps?

Recommend Projects

  • React photo React

    A declarative, efficient, and flexible JavaScript library for building user interfaces.

  • Vue.js photo Vue.js

    ๐Ÿ–– Vue.js is a progressive, incrementally-adoptable JavaScript framework for building UI on the web.

  • Typescript photo Typescript

    TypeScript is a superset of JavaScript that compiles to clean JavaScript output.

  • TensorFlow photo TensorFlow

    An Open Source Machine Learning Framework for Everyone

  • Django photo Django

    The Web framework for perfectionists with deadlines.

  • D3 photo D3

    Bring data to life with SVG, Canvas and HTML. ๐Ÿ“Š๐Ÿ“ˆ๐ŸŽ‰

Recommend Topics

  • javascript

    JavaScript (JS) is a lightweight interpreted programming language with first-class functions.

  • web

    Some thing interesting about web. New door for the world.

  • server

    A server is a program made to process requests and deliver data to clients.

  • Machine learning

    Machine learning is a way of modeling and interpreting data that allows a piece of software to respond intelligently.

  • Game

    Some thing interesting about game, make everyone happy.

Recommend Org

  • Facebook photo Facebook

    We are working to build community through open source technology. NB: members must have two-factor auth.

  • Microsoft photo Microsoft

    Open source projects and samples from Microsoft.

  • Google photo Google

    Google โค๏ธ Open Source for everyone.

  • D3 photo D3

    Data-Driven Documents codes.