Code Monkey home page Code Monkey logo

wats's Introduction

WATS

Welcome to the Wats Package. This implements the approaches described in Joseph Lee Rodgers, William Howard Beasley, and Matthew Schuelke (2014). Wrap-around Time Series Plots (WATS Plots) for Interrupted Time Series Designs: Applications to Fertility Rates and the Oklahoma City Bombing. Multivariate Behavioral Research.

The figures can be viewed in the vignettes, or in the Handouts document. The release version of Wats is available on CRAN.

Article Abstract

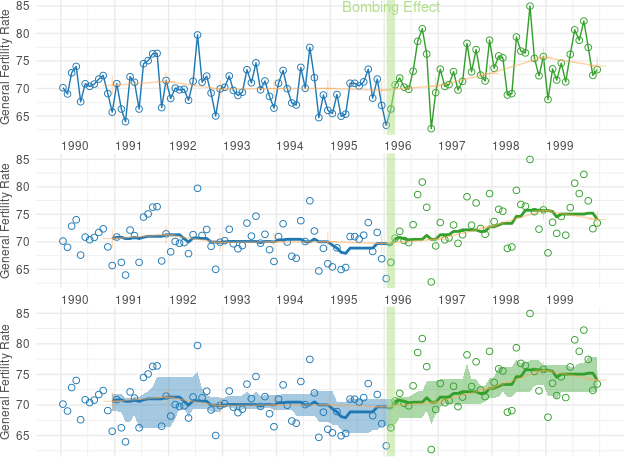
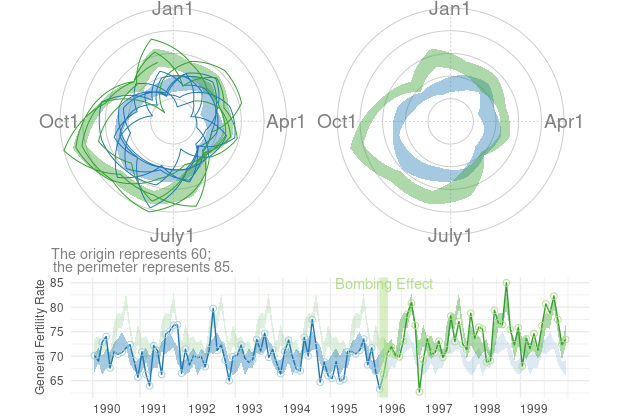
Many data structures, particular time series data, are naturally seasonal, cyclical, or otherwise circular. Past graphical methods for time series have focused on linear plots. In this paper, we move graphical analysis onto the circle. We focus on two methods, one old and one new. Rose diagrams are circular histograms, and can be produced in several different forms using the RRose software system. In addition, we propose, develop, and illustrate a new circular graphical method, called Wrap-Around Time Series Plots (WATS plots) that is useful to support time series analyses in general, but in particular in relation to interrupted time series designs. We illustrate the use of WATS Plots from an interrupted time series design evaluating the effect of the Oklahoma City bombing on birth rates in Oklahoma County during the ten years surrounding the bombing of the Murrah Building in Oklahoma City. We compare WATS Plots to linear time series representations with smoothing. Each method is shown to have advantages in relation to the other; in our example, the WATS Plots more clearly show the existence and effect size of the fertility differential.

Keywords: time series, interrupted time series design, group differences, graphical analysis, circular data, H-spread

Selected Figures

Figure 2

fig-2-stylized

Figure 4

fig-6

Reproducible Research

When the Wats package is installed on your local machine, the reproduce.R script starts with our initial datasets (i.e., the vital statistics birth counts and the US Census population estimates) to create the derivative datasets and resulting graphs and analysis.

Nonstandard Directories

The following directories are not part of the standard R package:

  • datasets/: CSV versions of the *.rda data frames officially included in the package. The incoming/unprocessed files are stored in datasets/raw/. The processed files are stored in datasets/derived/.
  • documentation-for-developers/: Notes and links that should help package developers set up on their computer. Typical package users won't have a need for this.
  • publication-graphs/: A deprecated location that contains loose graphs of older versions of the manuscript.
  • playgrounds/: R snippets to help developers experiment with potential new features.
  • utility/: R scripts that aren't incorporated into the package. They help automate certain tasks, or document how parts of the package were created.

Installing

The released CRAN version of Wats can be installed through R with.

install.packages("Wats")

The latest development version of Wats can be installed from GitHub after installing the remotes package.

install.packages("remotes")
remotes::install_github("OuhscBbmc/Wats")

Code Repository

The software is written primarily in R, under the MIT License. The DOI of this major release of the repository is 10.5281/zenodo.11921. (The DOI of the article is 10.1080/00273171.2014.946589.)

Funding

Continued development and maintenance of this package supported by the Oklahoma Shared Clinical and Translational Resources (OSCTR, U54GM104938) with an Institutional Development Award (IDeA) from NIGMS. The content is solely the responsibility of the authors and does not necessarily represent the official views of the National Institutes of Health.

Build Status and Package Characteristics

Branch GitHub Actions Codecov
Main R-CMD-check codecov
Dev R-CMD-check codecov
Ubuntu Latest Test Coverage
Key Value
License License: MIT
CRAN Version CRAN_Status_Badge
CRAN Rate CRAN Pace
Zenodo Archive DOI
Production Doc RDoc
Development Doc rdoc

wats's People

Contributors

dependabot[bot] avatar katrinleinweber avatar wibeasley avatar

Stargazers

 avatar  avatar  avatar  avatar  avatar  avatar  avatar  avatar

Watchers

 avatar  avatar  avatar  avatar

Forkers

andkov isaac1989

wats's Issues

modernize package

to prep for #8

  • versions
  • start GitHub Actions
  • retire Travis & AppVeyor
  • dependabot
  • update urls
  • pkgdown
  • readme
  • .lintr
  • .markdownlint.json
  • #29
  • #11
  • #24
  • #12
  • #13
  • #16
  • #17
  • #18
  • #19
  • #22
  • #21
  • #27
  • cran-comments.md
  • shrink size of graphs (they were high res for the publication)

Release Wats 1.0.1

First release:

Prepare for release:

  • git pull
  • Check if any deprecation processes should be advanced, as described in Gradual deprecation
  • urlchecker::url_check()
  • devtools::check(remote = TRUE, manual = TRUE)
  • devtools::check_win_devel()
  • rhub::check_for_cran()
  • git push
  • Draft blog post

Submit to CRAN:

  • usethis::use_version('major')
  • devtools::submit_cran()
  • Approve email

Wait for CRAN...

  • Accepted ๐ŸŽ‰
  • git push
  • usethis::use_github_release()
  • usethis::use_dev_version()
  • usethis::use_news_md()
  • git push
  • Finish blog post
  • Tweet
  • Add link to blog post in pkgdown news menu

Resubmit to CRAN

Email July 2:

These Suggests: BayesSingleSub and Suggests: simPop respectively but do not use those packages conditionally as required by 'Writing R Extensions'.

Both of the dependencies have been archived and so your packages now fail their checks. Please correct ASAP and before Jul 16 to safely retain the packages on CRAN.

--
Brian D. Ripley, [email protected]
Emeritus Professor of Applied Statistics, University of Oxford

I asked for a little more time, but it was removed a few days ago.

A few more details at richarddmorey/BayesSingleSub#1

modernize to dplyr

  • internal syntax uses dplyr instead of plyr
  • internal syntax accommodates tibbles
  • examples use dplyr

decrease run time of some examples

On R-hub (but not the local machine or winbuilder), there are examples that run too long. I'm going to use dontrun{} to save some time

Examples with CPU (user + system) or elapsed time > 5s
                         user system elapsed
county_month_birth_rate 2.198  0.023   8.613
annotate_data           1.391  0.027   6.190

Recommend Projects

  • React photo React

    A declarative, efficient, and flexible JavaScript library for building user interfaces.

  • Vue.js photo Vue.js

    ๐Ÿ–– Vue.js is a progressive, incrementally-adoptable JavaScript framework for building UI on the web.

  • Typescript photo Typescript

    TypeScript is a superset of JavaScript that compiles to clean JavaScript output.

  • TensorFlow photo TensorFlow

    An Open Source Machine Learning Framework for Everyone

  • Django photo Django

    The Web framework for perfectionists with deadlines.

  • D3 photo D3

    Bring data to life with SVG, Canvas and HTML. ๐Ÿ“Š๐Ÿ“ˆ๐ŸŽ‰

Recommend Topics

  • javascript

    JavaScript (JS) is a lightweight interpreted programming language with first-class functions.

  • web

    Some thing interesting about web. New door for the world.

  • server

    A server is a program made to process requests and deliver data to clients.

  • Machine learning

    Machine learning is a way of modeling and interpreting data that allows a piece of software to respond intelligently.

  • Game

    Some thing interesting about game, make everyone happy.

Recommend Org

  • Facebook photo Facebook

    We are working to build community through open source technology. NB: members must have two-factor auth.

  • Microsoft photo Microsoft

    Open source projects and samples from Microsoft.

  • Google photo Google

    Google โค๏ธ Open Source for everyone.

  • D3 photo D3

    Data-Driven Documents codes.