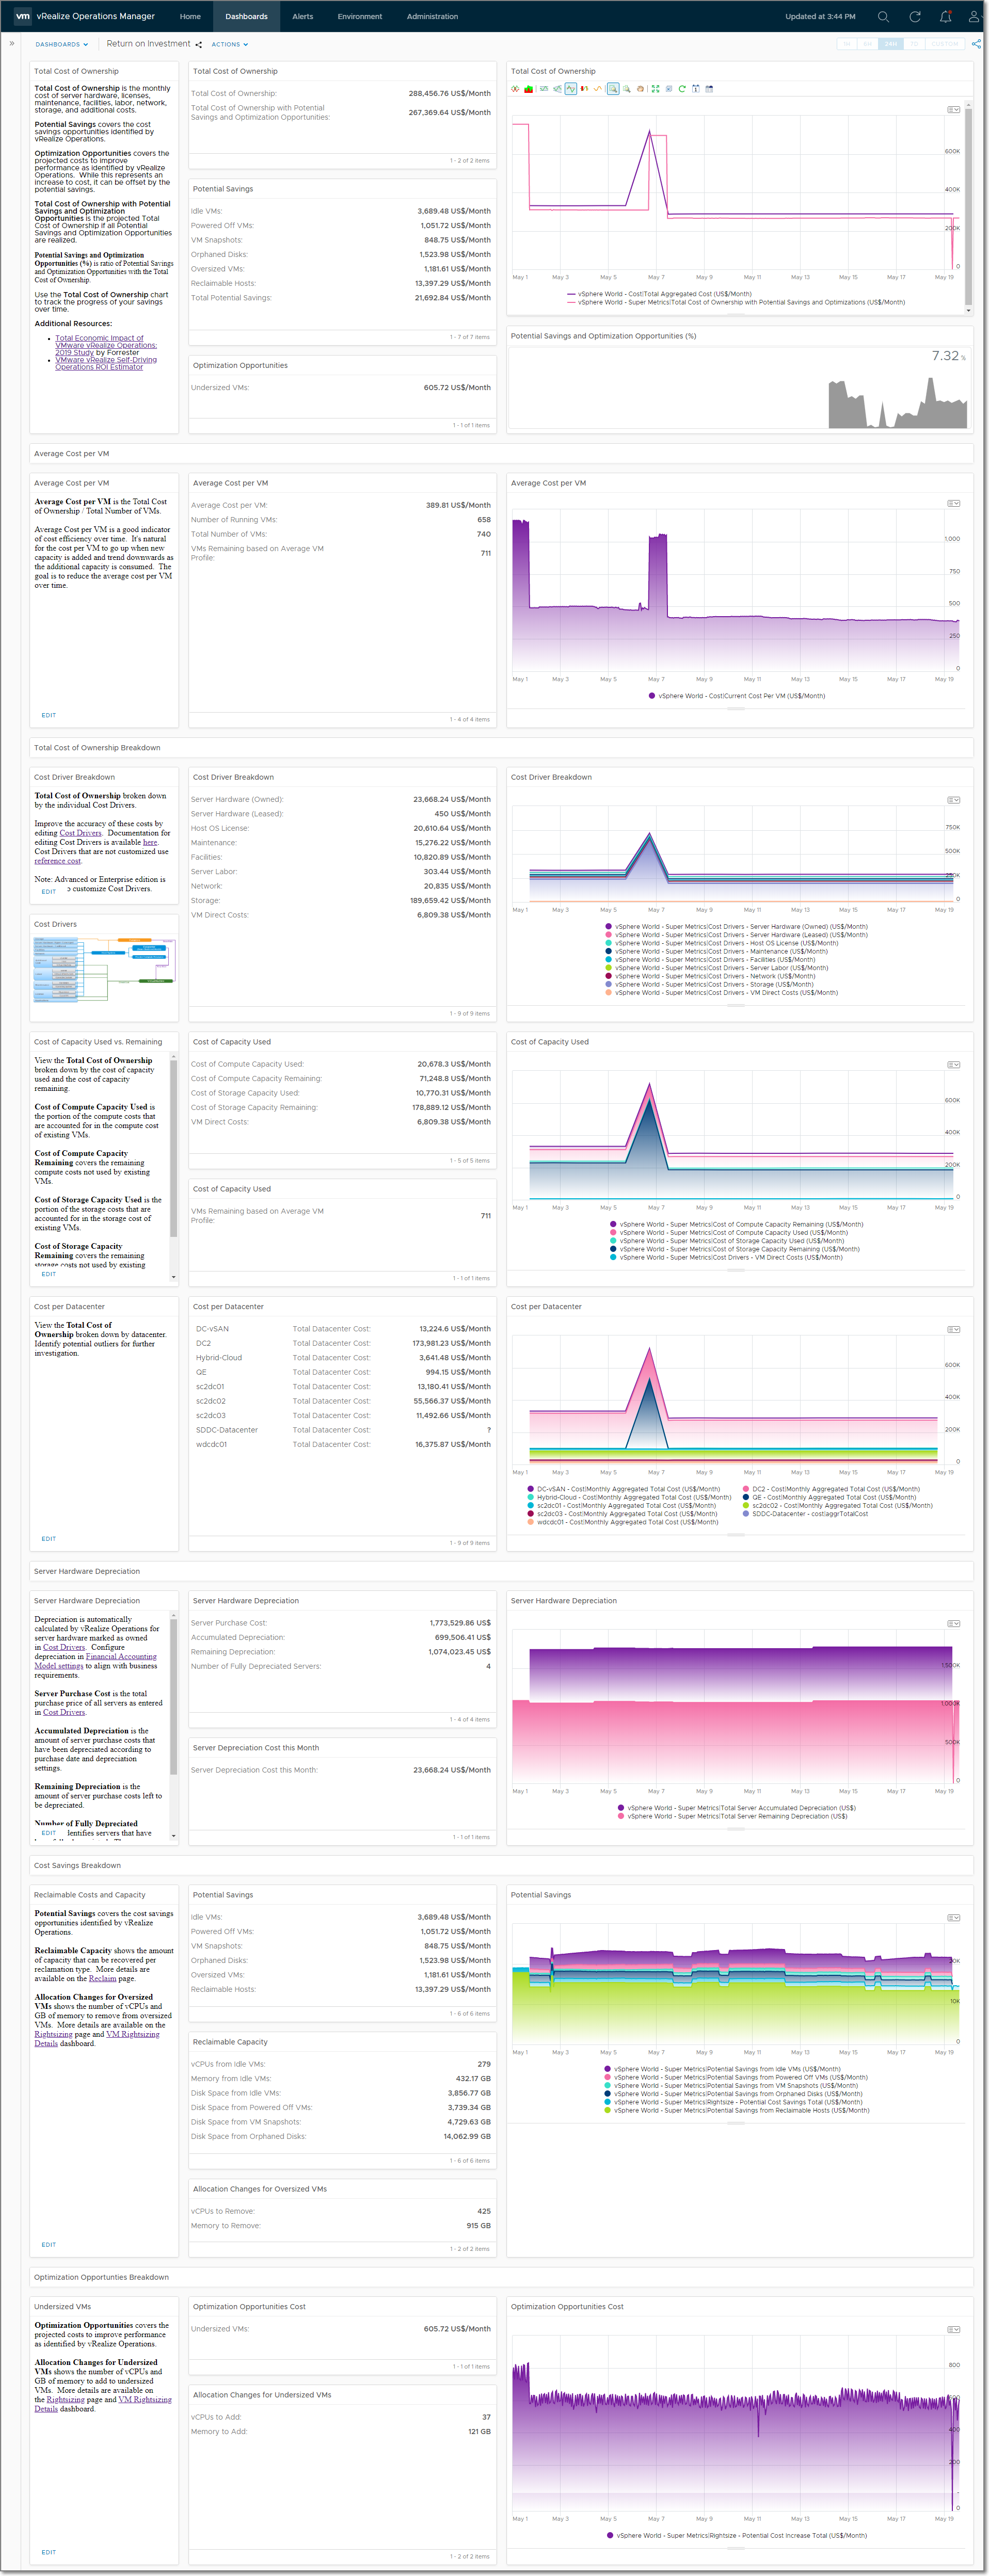
Use this vRealize Operations dashboard to view total cost of ownership, potential savings, and optimization costs. View cost breakdown by cost drivers, capacity used, and datacenter as well as tracking for server depreciation. More details on using this dashboard is available in the ROI Dashboard for vRealize Operations blog post.
- Install the Reclaimable Resources Details Dashboard for vRealize Operations dashboard according to the instructions on the dashboard page.
- Install the VM Rightsizing Details Dashboard for vRealize Operations dashboard according to the instructions on the dashboard page. Refer to the Rightsizing VMs with vRealize Operations blog post for a more detailed explanation of this dashboard.
- Install the Reclaimable Hosts Dashboard for vRealize Operations dashboard according to the instructions on the dashboard page.
- Import the super metrics at
Administration/Configuration/Super Metrics/Import Super Metric
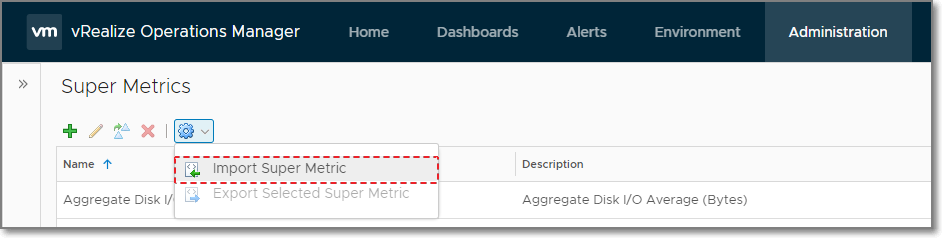
- Click
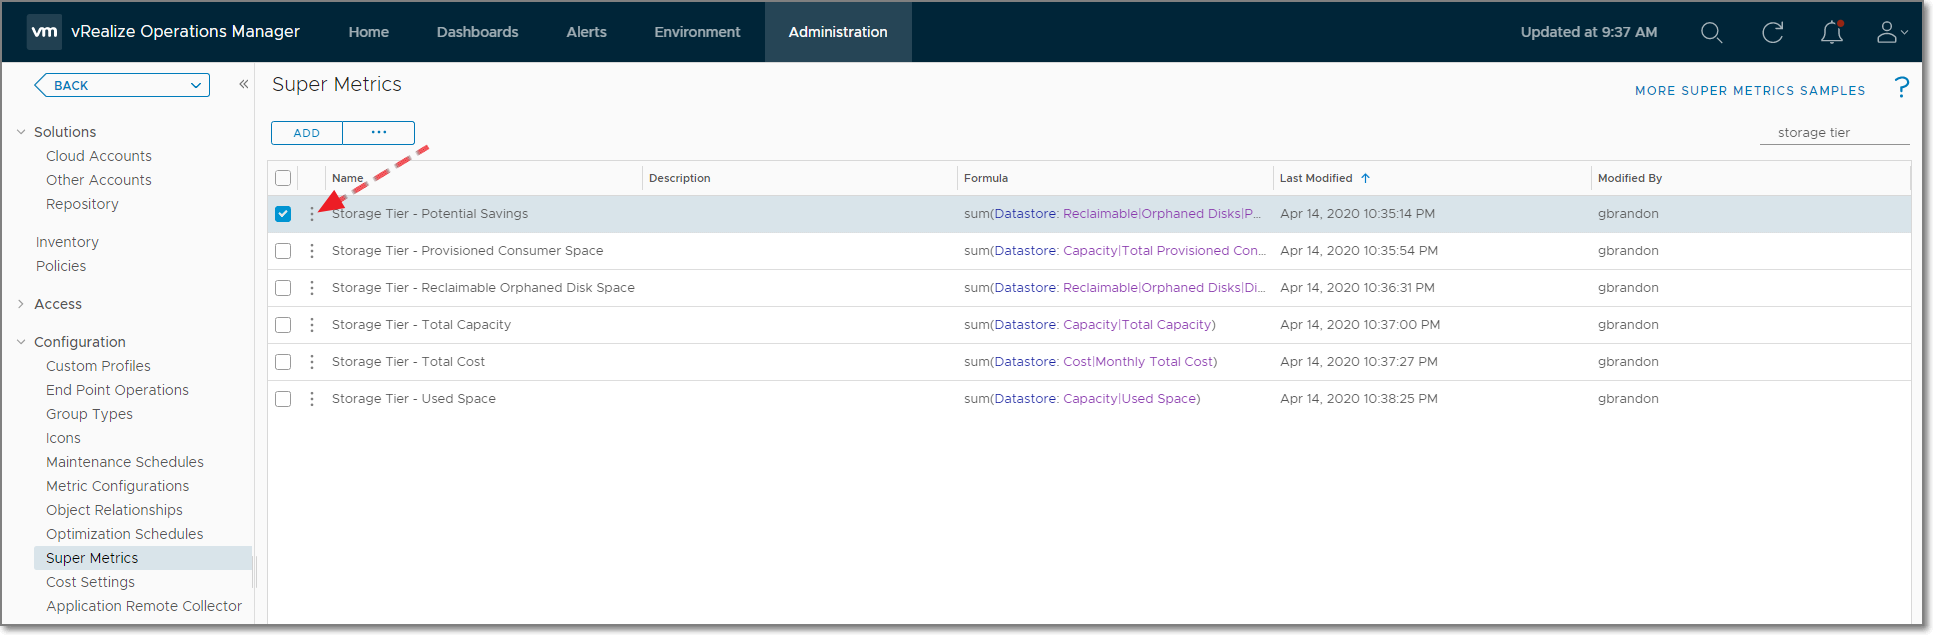
Browse...then select the file named supermetric.json - For each Super Metric listed in the Super Metrics section, click on the vertical kebab and select edit.
- Enable the Super Metric for each Policy shown in the
Enable in a Policystage of the wizard.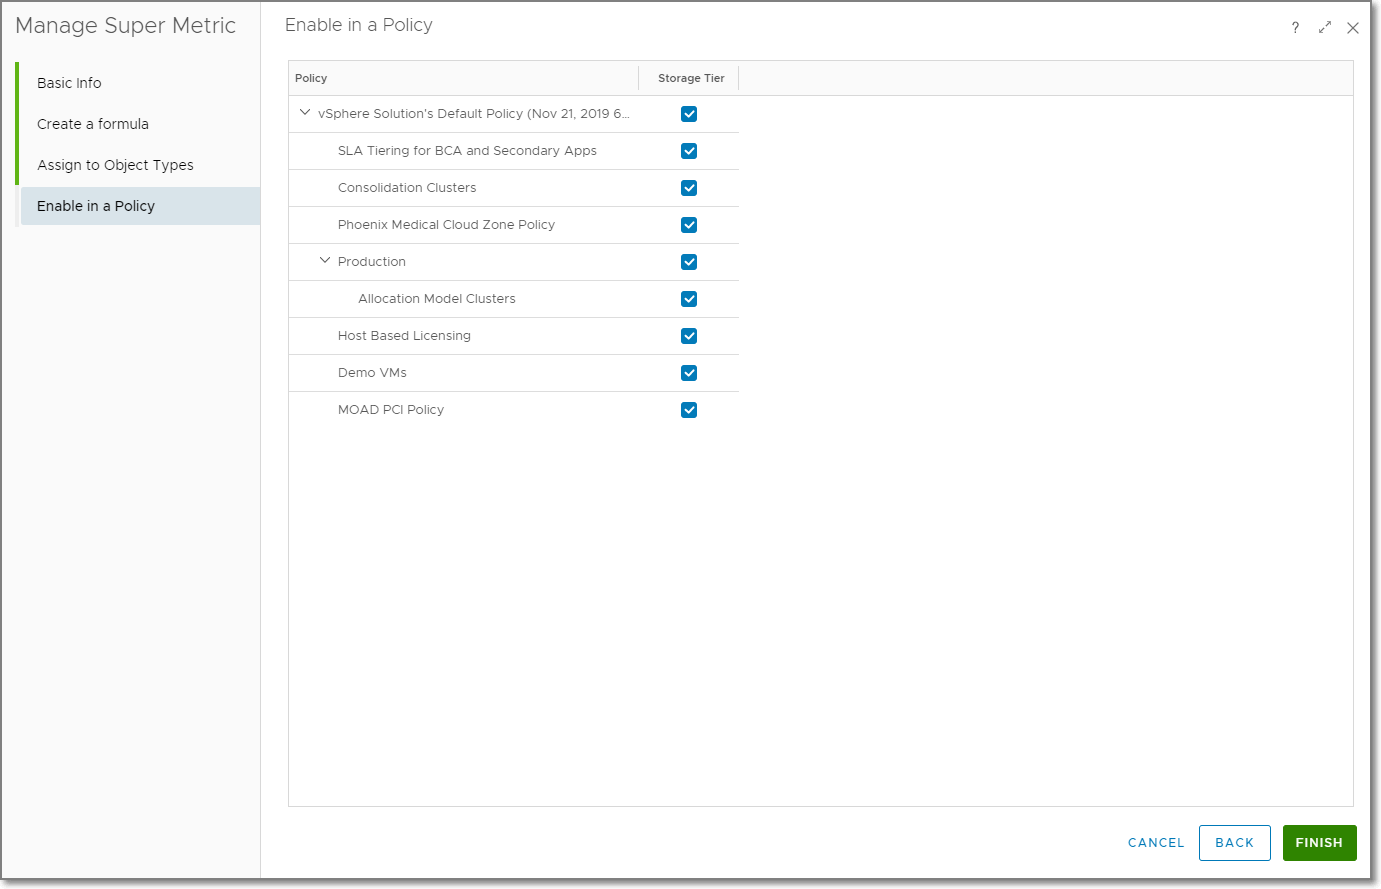
- Repeat the previous 2 steps for the remaining Super Metrics listed in the Super Metrics section.
- Import the view at
Dashboards/Views/Import...
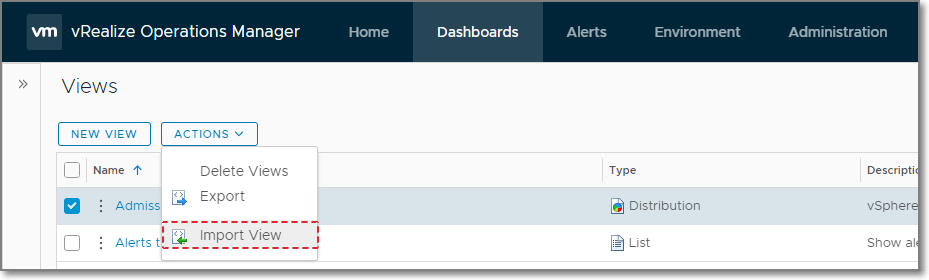
- Click
Browse...then select the file named Views.zip - The included views are listed in the Views section
- Import the dashboard at
Dashboards/Actions/Manage Dashboards/Import Dashboards
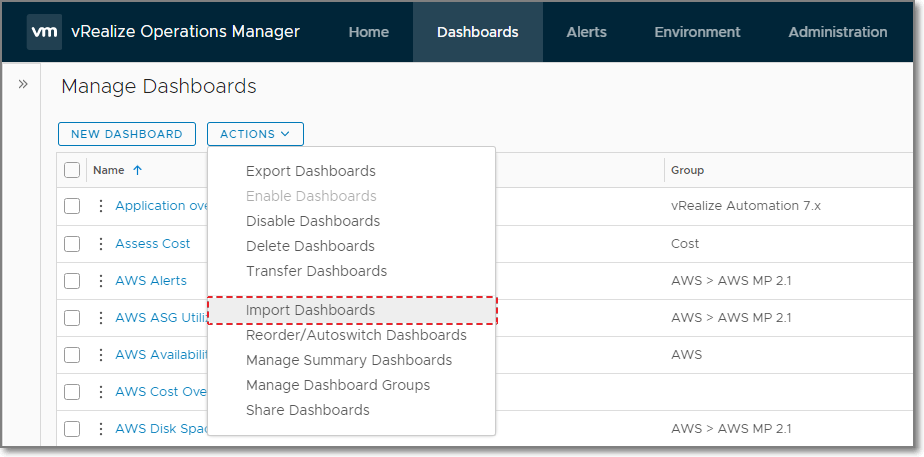
- Click
Browse...then select the file named Dashboard.zip - The dashboard should now be available in in the dashboard list
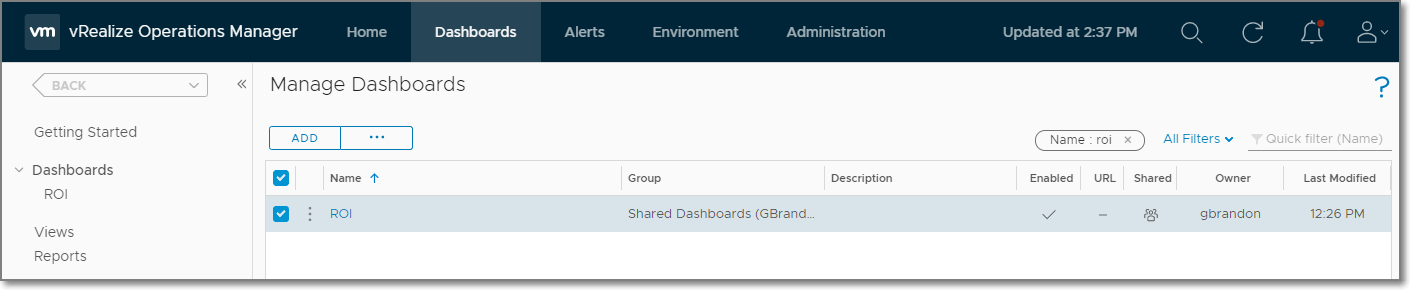
- The included dashboards are listed in the Dashboards section
- Data should start showing after the first cost calculation completes. Cost calculations run daily at 9 PM appliance time, which is UTC by default.
- After a few days, the charts should start filling in as shown in the dashboard screenshot.
| Dashboard Name | Dashboard Path |
|---|---|
| Return on Investment | Shared Dashboards (GBrandon)/Cost |
| View Name | Name on Dashboard | View Type |
|---|---|---|
| Cost Drivers Diagram | Reclaimable Hosts Detail | List |
| Super Metric Name | Object Type |
|---|---|
| Cost Drivers - Server Hardware (Owned) | vSphere World |
| Cost Drivers - Server Hardware (Owned) | Custom Datacenter |
| Cost Drivers - Server Hardware (Owned) | Datacenter |
| Cost Drivers - Server Hardware (Owned) | Cluster Compute Resource |
| Cost Drivers - Server Hardware (Leased) | vSphere World |
| Cost Drivers - Server Hardware (Leased) | Custom Datacenter |
| Cost Drivers - Server Hardware (Leased) | Datacenter |
| Cost Drivers - Server Hardware (Leased) | Cluster Compute Resource |
| Cost Drivers - Host OS License | vSphere World |
| Cost Drivers - Host OS License | Custom Datacenter |
| Cost Drivers - Host OS License | Datacenter |
| Cost Drivers - Host OS License | Cluster Compute Resource |
| Cost Drivers - Maintenance | vSphere World |
| Cost Drivers - Maintenance | Custom Datacenter |
| Cost Drivers - Maintenance | Datacenter |
| Cost Drivers - Maintenance | Cluster Compute Resource |
| Cost Drivers - Facilities | vSphere World |
| Cost Drivers - Facilities | Custom Datacenter |
| Cost Drivers - Facilities | Datacenter |
| Cost Drivers - Facilities | Cluster Compute Resource |
| Cost Drivers - Server Labor | vSphere World |
| Cost Drivers - Server Labor | Custom Datacenter |
| Cost Drivers - Server Labor | Datacenter |
| Cost Drivers - Server Labor | Cluster Compute Resource |
| Cost Drivers - Network | vSphere World |
| Cost Drivers - Network | Custom Datacenter |
| Cost Drivers - Network | Datacenter |
| Cost Drivers - Network | Cluster Compute Resource |
| Cost Drivers - Storage | vSphere World |
| Cost Drivers - Storage | Custom Datacenter |
| Cost Drivers - Storage | Datacenter |
| Cost Drivers - Storage | Cluster Compute Resource |
| Cost Drivers - VM Direct Costs | vSphere World |
| Cost Drivers - VM Direct Costs | Custom Datacenter |
| Cost Drivers - VM Direct Costs | Datacenter |
| Cost Drivers - VM Direct Costs | Cluster Compute Resource |
| Cost of Compute Capacity Remaining | vSphere World |
| Cost of Compute Capacity Used | vSphere World |
| Cost of Storage Capacity Remaining | vSphere World |
| Cost of Storage Capacity Used | vSphere World |
| Number of Fully Depreciated Servers | vSphere World |
| Number of Fully Depreciated Servers | Custom Datacenter |
| Number of Fully Depreciated Servers | Datacenter |
| Number of Fully Depreciated Servers | Cluster Compute Resource |
| Potential Savings and Optimization Opportunities | vSphere World |
| Total Cost of Ownership with Potential Savings and Optimizations | vSphere World |
| Total Potential Savings | vSphere World |
| Total Potential Savings | Custom Datacenter |
| Total Potential Savings | Datacenter |
| Total Potential Savings | Cluster Compute Resource |
| Total Server Purchase Cost | vSphere World |
| Total Server Purchase Cost | Custom Datacenter |
| Total Server Purchase Cost | Datacenter |
| Total Server Purchase Cost | Cluster Compute Resource |
| Total Server Accumulated Depreciation | vSphere World |
| Total Server Accumulated Depreciation | Custom Datacenter |
| Total Server Accumulated Depreciation | Datacenter |
| Total Server Accumulated Depreciation | Cluster Compute Resource |
| Total Server Remaining Depreciation | vSphere World |
| Total Server Remaining Depreciation | Custom Datacenter |
| Total Server Remaining Depreciation | Datacenter |
| Total Server Remaining Depreciation | Cluster Compute Resource |
| VMs Remaining (Average VM Size) | vSphere World |
This dashboard requires vRealize Operation 8.1 Advanced or Enterprise edition or vRealize Operations Cloud.
Please open an issue for feedback.
2020-05-20
- Initial release

