Cloud-Latency - Measure and Graph Network Latency written in Rust
This project uses the same concept as /nerdalert/cloud-bandwidth of measuring performance metrics and writing them out to a TSDB backend and then visualizing them into Grafana. The primary difference is this measures latency to the specified targets and is written in Rust instead of Go.
The round trip time of the probes are measured and then plotted into the TSDB stack and visualized with Grafana. The RTT is measured via ICMP and/or TCP. Some endpoints are on networks filtering ICMP. In order to get around that, we can measure the time it takes to open a TCP socket on the remote host. All polling is multi-threaded using Rust concurrency runtimes.
Currently you simply feed in targets to monitor via the config.yml file and start the binary with cloud-latency --config=config.yml.
Start the TSDB and Grafana:
docker run -d\
 --name go-graphite\
 --restart=always\
 -p 80:80\
 -p 2003-2004:2003-2004\
 gographite/go-graphite
This maps the following ports:
| Host | Container | Service |
|---|---|---|
| 80 | 80 | grafana |
| 2003 | 2003 | carbon receiver - plaintext |
| 2004 | 2004 | carbon receiver - pickle |
Verify you can reach the grafana/graphite server running by pointing your browser to the container IP. If you're running Docker for desktop on a Mac, http://localhost. On Linux just point to the host IP since the port is getting mapped with -p 80:80. The default login is username: admin and password: admin. More details on troubleshooting connectivity to the grafana/graphite stack can be find in this project nerdalert/cloud-bandwidth.
git clone https://github.com/nerdalert/cloud-latency.git
cd cloud-latency/- Note: Like other async ICMP libraries, tokio-ping requires privileged access to run. This means the binaries need to be run using
sudo.
Here you can either build the code yourself with sudo -E cargo run - --config config.yml or run the compiled binaries.
Mac:
cd ./binaries/macosx/
sudo ./cloud-latency --config ./config.yml
Linux:
cd ./binaries/linux/
sudo ./cloud-latency --config ./config.ymlThe configuration file is pretty simple. It consists of the following. Comments are added inline describing each field.
---
# The time between polls. The default is 20 seconds
test_interval: 20
# The IP or dns name of the grafana server. In this case it is
# pointing to Docker running on a mac which uses localhost.
grafana_address: localhost
# The exposed graphite/carbon port.
# Test connectivity with `nc -zv <address_of_graphite grafana container> 2003`
grafana_port: 2003
# The prefix that is used in the TSDB. View the gif below to see more.
tsdb_prefix: latency
# The endpoints that get polled. If any of these hosts don't resolve to IPs
# or are invalid IPs the program will exit.
# (These are simply example hosts that reply to icmp)
endpoints:
  - aws.amazon.com
  - cloud.google.com
  - github.com
  - a.root-servers.net
  - b.root-servers.net
  - c.root-servers.net
  - d.root-servers.net
  - e.root-servers.net
  - f.root-servers.net
  - g.root-servers.net
  - h.root-servers.net
  - i.root-servers.net
  - j.root-servers.net
  - k.root-servers.net
  - l.root-servers.net
  - m.root-servers.net
  - 8.8.8.8
  - 8.8.4.4
  tcp_endpoints:
  - google.com:80
  - rust-lang.org:80
  - github.com:443
  - azure.microsoft.com:443
- aws.amazon.com:443-
You can import Copy the json in grafana-config.json and paste it into a new dashboard by clicking the + and then import in the Grafana splash page.
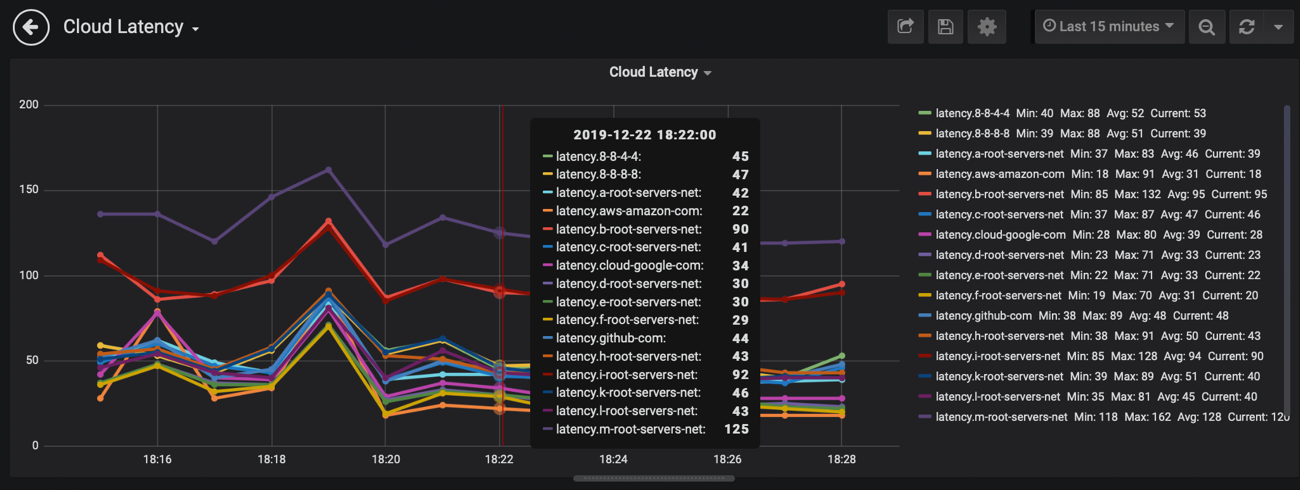
-
Grafana makes it east to setup your own graphs as shown in the following image:

