This will detail the ‘rightsize’ for your Features, the number of these Features you have capacity for in a given time period and the likely completion date of Features in your backlog right now based on the number of child items and a forecasted target date. Please note, when I say Features, I mean the backlog hierarchy level above User Story/Product Backlog Item. You may call this something different in your context (e.g. Epic), but for simplicity I am using the term "Feature".
To better understand how ‘big’ (in terms of child items) your Features/Epics are, as well as how many Features you have capacity for in a given time period (e.g. a quarter). In addition to this, you can use it to improve your confidence around delivery dates for Features/Epics.
You can use the rightsizing page on a frequent basis (e.g. weekly) for monitoring Feature/Epic size. Capacity Planning could be used in the build-up to quarterly planning (or similar type of event if you have it) to understand team capacity and the Feature Monte Carlo can be used weekly to track progress of Features.
- Your team needs to have the following practices in place:
- Your team regularly review and move work items (User Stories, PBIs, Features, Epics, etc.) to in progress (when started) and done (once complete)
- Your team regularly monitor the size (in terms of number of child work items) of Features/Epics
- At all levels you always try to break work down to thin, vertical slices
- Features/Epics are 'owned' by a single team (i.e. not shared across multiple teams)
- Download the appropriate template file:
- Create/save an access token
- Then you're good to get started!
- Open the .pbit file in Power BI Desktop
- Select http/https (only choose http if your Azure DevOps Server is HTTP)
- Add the Analytics / Azure DevOps Server URL - for Azure DevOps services enter 'analytics.dev.azure.com' / for Azure DevOps Server enter your server details
- Add your organization, project name and team name
Don't confuse the team name with the project name, a common mistake. If the URL you use is "http://dev.azure.com/Microsoft-UK/AzureDevOpsTeam/Database", then Microsoft-UK is the Organization Name, AzureDevOpsTeam is the Project name, Database is the team name.
- It should then look something like this:

- Hit 'Load'
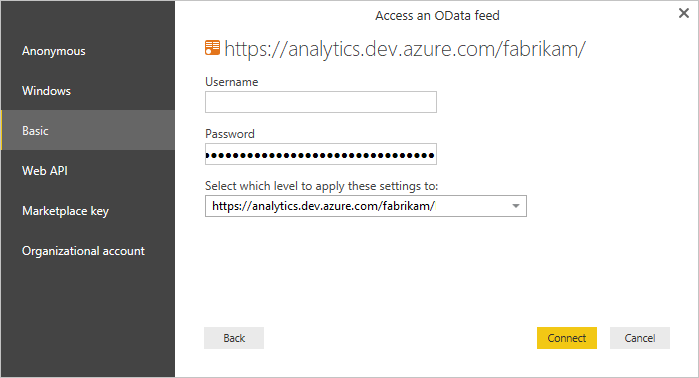
- You will be prompted for a login, choose Basic and enter:
- Your PAT you created in the Prerequisites in the password field
- Leave the username as blank or enter 'Dummy'
- Once signed in hit 'Load' and wait for your charts to populate!
- Open the .pbit file in Power BI Desktop
- Add your Jira URL
- Add your Jira Project Key
Don't confuse the project name with the project key, a common mistake! Your project key will be in the URL when viewing an item.
-
It should then look something like this:

-
Hit 'Load'
-
You will be prompted for a login, choose Basic and enter:
- Your email associated with your Jira account for your username
- Your API token you created in the Prerequisities
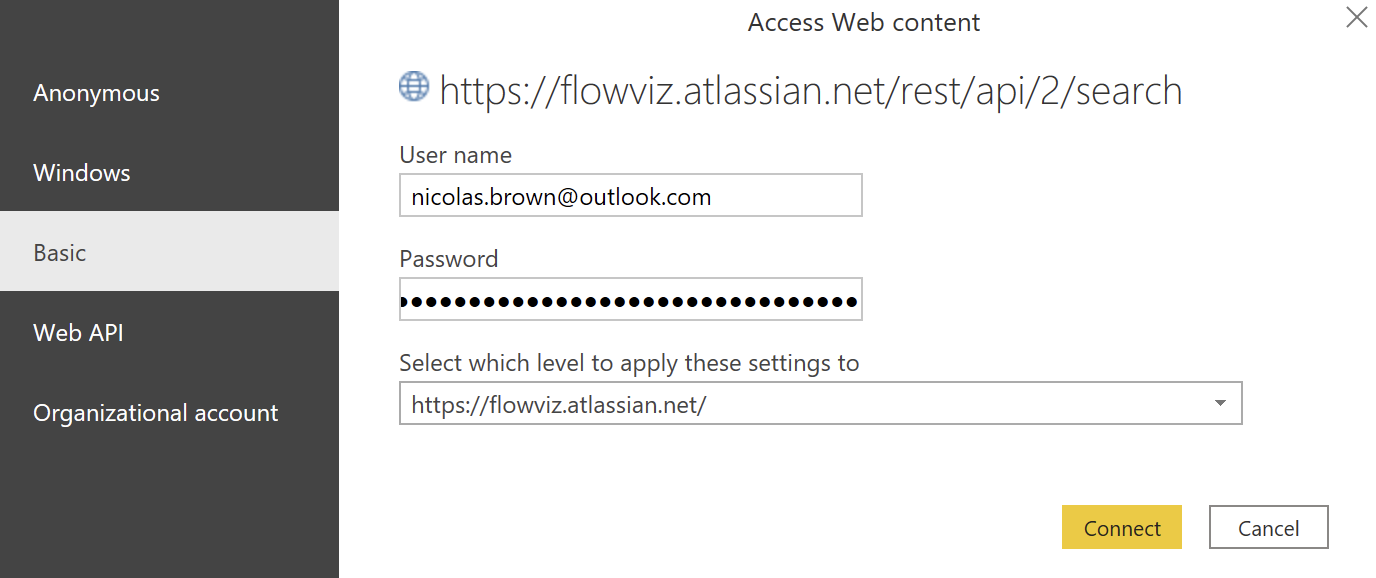
- Then hit 'Connect' and wait for the data and charts to load!
There are a few different ways you can use each chart.

Using this chart we can see that the “right size” for our Features is 7 child items (User Stories/PBIs) or less. We should therefore try to ensure the majority of our Features are no bigger than this. The table to the right highlights any ‘open’ Features that are under/at/exceed our rightsize. You’d use this to focus on those that are “too big” and potentially be trying to find ways to break them down.

Using this chart we can see that we are forecasting this team have an 85% likelihood of completing 96 stories or more in the next 12 weeks. We can also see that 85% of our Features have 7 child items or less. When we divide 96 by 7 we get 13.71 - seen as we can’t have .71 of a Feature we round down therefore we can say that in the next 12 weeks, this team has capacity for 13 rightsized Features.
One of the advantages of this approach is the ability to see the likelihood of different outcomes that could occur and how reasonable (or unreasonable!) expectations may be around capacity. Use the dropdown to play around with the different percentile likelihoods depending on your risk appetite:

There are two main ways to use this report:
Better understand/manage expectations on delivery - by using this report you are able to define a target date and percentage likelihood outcome to aim for. You can play around with the drop down options for these two fields to see the different outcomes that could occur and how likely (or unlikely!) an outcome for a particular Feature is.

Understand the impact WIP has on delivery - the problem with forecasting at Feature level is that it typically assumes one feature is worked on sequentially in priority order by a team, which is simply not the reality we face. It is underestimated just how much of an impact Feature WIP has on teams. Even if a team is limiting WIP at story level, this is redundant for Feature throughput if WIP is not limited at the level above that. We can see the impact of this with a very quick example:

- The Jira version only works at project level, if you have multiple teams in a project you will need to modify this using the field you use to differentiate a team with
- The ADO version is team level only as, due to the monte carlo simulations, doing it at a project level would likely mean the report would not load (due to the amount of rows needed)
- A Process Behaviour Chart is included in the What Will We Get? help tooltip, which indicates how predictable your input data (Throughput) is


