Code Monkey home page Code Monkey logo

interpretable-ml's Introduction

Interpretable Machine Learning

A collection of code, notebooks, and resources for training interpretable machine learning (ML) models, explaining ML models, and debugging ML models for accuracy, discrimination, and security.
Want to contribute your own examples/code/resources? Just make a pull request.

Setup

cd interpretable-ml
virtualenv -p python3.6 env
source env/bin/activate
pip install -r python/jupyter-notebooks/requirements.txt

** Note: if using Ubuntu, you may have to manually install gcc. Try the following 
1. sudo apt-get update
2. sudo apt-get install gcc
3. sudo apt-get install --reinstall build-essential

Contents

Further reading:

Resources

interpretable-ml's People

Contributors

jphall663 avatar navdeep-g avatar pramitchoudhary avatar

Stargazers

 avatar  avatar  avatar  avatar  avatar  avatar  avatar  avatar  avatar  avatar  avatar  avatar  avatar  avatar  avatar  avatar  avatar  avatar  avatar

Watchers

 avatar  avatar  avatar  avatar  avatar  avatar  avatar

interpretable-ml's Issues

ROC plots

Roc plots with thresholds clearly identified. Using Jupyter ipywidgets one could also think of making it interactive where the user can specify the threshold based on which the TPR/FPR might change. Something similar to what h20-3 does.

Add multinomial version of credit card notebook (monotonic XGBoost, PDP, ICE, & Shapley)

Follow same outline here but for multinomial prediction: https://github.com/navdeep-G/interpretable-ml/blob/master/notebooks/credit/xgb_credit_binary_classifier.ipynb

  • Need multinomial XGBoost model with monotonicity constraints
  • Need variable importance from model
  • Need Shapley values per class outcome
  • Need global Shapley variable importance
  • Need local Shapley example
  • PDP (partial dependence per class outcome)
  • ICE (ICE values per class outcome)

Comparative Charts

Thinking of ways to have comparative chart for comparing different methods and accuracy.
Checking some old papers might help on how to summarize results from different algorithms.

Adjusting the color for the Shapely plots per class

If time permits, it might be a good idea to normalize the shapely scores such that it is bounded between 0 and 1 so that we get distinct color when the influence of a feature is positive(red)/negative(blue).
Current bound is -1, 1 and the color map is absolute so red and blue get mixed and one has to focus on the color legend to understand what's going on.

Tentative Outline

  • Abstract
  • Introduction
  • Simulated data
    • Global analysis
      • Surrogate DT
      • Decision boundary plot
      • Comparison of global var. imp. methods
    • Local analysis: Comparison of local var. imp. methods
  • Credit card data
    • Global analysis: Surrogate DT, decision boundary, global shap
    • Local analysis: Local shap
  • Conclusion

Add AIR to DIA notebook

  • Adverse Impact: (tp + fp) / (tp + fp + tn + fn)

  • Adverse Impact Disparity (Ratio): non-reference adverse impact / reference adverse impact

  • Adverse Impact Parity: low_threshold < Adverse Impact Disparity < high_threshold

Correlation matrix

This is a low hanging fruit which could be covered under Exploratory Analysis.
We can then compare the high correlated features and not highly correlated features to understand or poke around Surrogate Models validate if the influences are rightly captured.

Cross validation plot

If time permits, it might be worth to have a CV plot highlighting the sweet spot during the model training phase.

Add 2-way Partial plots

So far we show 1-d plot, it might we worth showing 2-way interactive plots as well.
I will add this to the simulated notebook. It will complement 1-way PDP and ICE.

Add decision tree surrogate notebook

  • Binomial case
  • Multinomial case
    • Find some package, even if it's R, that does multinomial decision tree for one overall surrogate DT.
    • Be sure to show overall error and CV error.
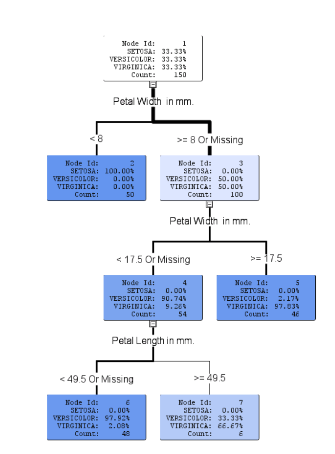
    • From @jphall663: Please try to find a single, multinomial DT. I promise this is the most elegant way to handle. It will show how to get to probabilities in each class, but in a single tree. We have to summarize info to be useful/novel. Per class surrogate DT is ok too, but I would only show those after showing a single DT, like this one:
      selection_019
  • Regression case

Confusion Matrix plot

Would suggest having a confusion matrix plot, I think we already have access to the values.

  1. Values could be normalized to be represented as %ages
  2. or not normalized as well. Using the computed values to draw the plot.
    if time permits one could think of some cool intuitive visualization as well.

Recommend Projects

  • React photo React

    A declarative, efficient, and flexible JavaScript library for building user interfaces.

  • Vue.js photo Vue.js

    ๐Ÿ–– Vue.js is a progressive, incrementally-adoptable JavaScript framework for building UI on the web.

  • Typescript photo Typescript

    TypeScript is a superset of JavaScript that compiles to clean JavaScript output.

  • TensorFlow photo TensorFlow

    An Open Source Machine Learning Framework for Everyone

  • Django photo Django

    The Web framework for perfectionists with deadlines.

  • D3 photo D3

    Bring data to life with SVG, Canvas and HTML. ๐Ÿ“Š๐Ÿ“ˆ๐ŸŽ‰

Recommend Topics

  • javascript

    JavaScript (JS) is a lightweight interpreted programming language with first-class functions.

  • web

    Some thing interesting about web. New door for the world.

  • server

    A server is a program made to process requests and deliver data to clients.

  • Machine learning

    Machine learning is a way of modeling and interpreting data that allows a piece of software to respond intelligently.

  • Game

    Some thing interesting about game, make everyone happy.

Recommend Org

  • Facebook photo Facebook

    We are working to build community through open source technology. NB: members must have two-factor auth.

  • Microsoft photo Microsoft

    Open source projects and samples from Microsoft.

  • Google photo Google

    Google โค๏ธ Open Source for everyone.

  • D3 photo D3

    Data-Driven Documents codes.