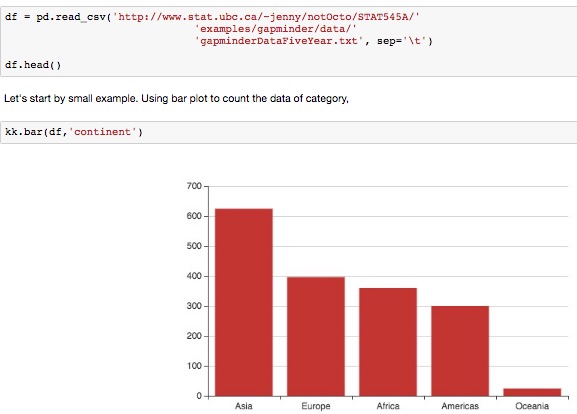
Krisk bring Echarts to Python Data Science Ecosystem, and helpful tools for high level statistical interactive visualization.
- Python 3.5 (Python 2.7 should be supported, haven't test it yet)
- Jupyter Notebook 4.2.x
- Pandas 0.18.x
- Echarts 3.2.1 (built-in)
pip install jupyter pandas krisk
jupyter nbextension install --py krisk --sys-prefix
jupyter nbextension enable --py krisk --sys-prefix- Introduction
- Themes and Colors
- Legend, Title, and Toolbox
- Resync Data and Reproducible Charts
- Declarative Visualization
- Waterfall and Barline Chart
- Tidy Plot: Time Series and Other Custom Data Manipulation
- Chart Integration with Jupyter Notebook, widgets, and Dashboard.
- Statistical interactive visualization
- Ability backed by Echarts (Toolbox, Transition, Tooltip, etc.)
Krisk won't implement all features of Echarts. For more advanced usage, Krisk users can use JSON option (or HTML) output produced by Krisk to optimize in Javascript.
Only basic charts are supported for explanation visualization. The plan will support:
- More complex line, bar, scatter, and histogram.
- Geoscatter plot
- Time Series
Of course, contributions are welcome to support all chart types and advanced features.
Krisk is targeted for building interactive dashboard application on top of two key components of Jupyter framework, ipywidgets and Jupyter Dashboard.
Krisk is also act as tool to support reproducible chart by utilizing pandas DataFrame as data input.
To contribute and unit tests your changes, please do the following,
- Fork this repository
- Clone this repo and do unit test,
pip install coverage pytest
git clone https://github.com/your-username/krisk.git
cd krisk
coverage run --source krisk -m py.test
New BSD


