nagix / chartjs-plugin-colorschemes Goto Github PK
View Code? Open in Web Editor NEWPredefined color schemes for Chart.js
License: MIT License
Predefined color schemes for Chart.js
License: MIT License


Setting specific colors for some traces in Chart of type 'scatter' doesn't prevent them for catching colors from the scheme. More exactly, even though the legend does show what would be expected, the markers on the canvas retain the colors supplied by the colorscheme.
        var myChart = new Chart(ctx, {
        type: 'scatter',
        data: {
          datasets: [
            {
             data : [
               {"x" : 10, "y" : 10},
               {"x" : 20, "y" : 20}
           ],
             backgroundColor : "gray",
             label : "Set 1"
           },
            {
              data : [
                {"x" : 10, "y" : 20},
                {"x" : 20, "y" : 40}
            ],
            label : "Set 2"
            }
          ]
          },
        options : {
          plugins : {
            colorschemes: {
              scheme: 'tableau.ColorBlind10',
              override : false,
              fillAlpha : 0.2
            }
          }
        }
      });

I see in the tutorial there are two options for a colorscheme, can't find a way to specify dark mode.
Is ti possible?
@nagix
this is my option in data
options:{
	plugins : {
		colorschemes : {
			scheme : 'brewer.YlGn3'
		}
	}
}
by default brewer.Paired12 is applied even I change other schemes
I triend to install this package with ng2-charts v3.0.8 and chart.js v3.6.0 but I get a dependency error:
npm ERR! code ERESOLVE
npm ERR! ERESOLVE unable to resolve dependency tree
npm ERR!
npm ERR! While resolving: **[email protected]
npm ERR! Found: [email protected]
npm ERR! node_modules/chart.js
npm ERR! chart.js@"3.6.0" from the root project
npm ERR!
npm ERR! Could not resolve dependency:
npm ERR! peer chart.js@">= 2.5.0 < 3" from [email protected]
npm ERR! node_modules/chartjs-plugin-colorschemes
npm ERR! chartjs-plugin-colorschemes@"" from the root project
npm ERR!
npm ERR! Fix the upstream dependency conflict, or retry
npm ERR! this command with --force, or --legacy-peer-deps
npm ERR! to accept an incorrect (and potentially broken) dependency resolution.
Does it say it still requires chart.js version to be lower than 3?
Please add support for Chartjs 3.x.x or at least mention it in the README since it only says "This plugin requires Chart.js 2.5.0 or later."
Chart.js changed from Chart.defaults.global to Chart.defaults in the new version.


https://www.chartjs.org/docs/master/getting-started/v3-migration/#defaults
Hey @nagix , would you accept this commit as a pull request? -> https://github.com/JohnArcher/chartjs-plugin-colorschemes/commit/707ce90516af10e23e7ded3055f75d9c4a4e9f63
The aim is to (dynamically) add additional colors to a scheme in order to e.g. prevent that the same colors are used again when you have more datasets then colors.
An example using my code would be:
var myColorFunction = function () {
    var myColors = ['#ff00000', '#00ff00'];
    // ... or calculate your colors with some fancy algorithm
    return myColors;
}

...
    plugins: {
        colorschemes: {
            scheme: 'brewer.Paired12',
            colorFunction: myColorFunction
        }
    }
I really need this behaviour. :-) What do you think?
Hi, I am new at programming and I just started a Flask project related to Stock Market. In the chart under "function Stock_Performance_Chart2()" I am using the plugin but it doesn't seem to work (All the different lines of the chart posses the same color i.e. Grey). Can you please help me regarding this. I will be very thankful if you do so.
`function initialize(){
var active = "Active";
$.ajax({ url : '/api/initialize/user_check?JsStatus=' + active,
success: function (data) {
var user = data['user'];
var firsttime = "yes";
var olduser = "no";
var modified = "error";
if (user == firsttime){
window.location.replace("http://127.0.0.1:5000/First_Login");
}else if (user == olduser){
window.location.replace("http://127.0.0.1:5000/Scratch_start_1");
}
}
});
}
$('#quickstart').click(function() {
window.location.replace("http://127.0.0.1:5000/quick_start_form");
});
function QuickStartSave(){
$.ajax({ url: '/api/quick_start_form?First_Name=' + document.getElementById('First_Name').value + '&Last_Name=' + document.getElementById('Last_Name').value + '&Tickers=' + document.getElementById('Tickers').value + '&Start_Date=' + document.getElementById('Start_Date').value + '&End_Date=' + document.getElementById('End_Date').value + '&Total_Investment_Amount=' + document.getElementById('Total_Investment_Amount').value + '&Amount_Allocation_raw=' + document.getElementById('Amount_Allocation_raw').value,
success: function(data){window.location.replace("http://127.0.0.1:5000/quick_start_analytics")}
});
}
function Quick_Start_Analytics(){
var temp = "x";
$.ajax({ url : '/api/quick_start_form/analysis_and_optimistaion?x=' + temp,
success: function (data) {
$('#Portfolio_Annual_Return_Percent').html(data['Portfolio_Return_Percent'] );
$('#Current_Portfolio_Value').html('$' + data['Current_Portfolio_Value']);
$('#Sharp_Ratio').html(data['Sharp_Ratio']);
$('#Portfolio_Volatility').html(data['Portfolio_Volatility_Data']);
$('#Portfolio_Varience').html(data['Portfolio_Varience_Data']);
$('#Annual_Sharp_Ratio').html(data['Annual_Sharp_Ratio']);
$('#Cumulative_Return').html(data['Cumulative_Return']);
$('#Profit_Amount').html('$' +data['Profit_Amount']);
Portfolio_Performance_Chart1();
Stock_Performance_Chart2();
    }
});
}
function Portfolio_Performance_Chart1(){
$.ajax({ url : '/api/quick_start_form/analysis_and_optimistaion',
success: function (data) {
  var ctx = document.getElementById('Chart-1')
  var chart = new Chart(ctx, {
  type: 'line',
  data: {
      labels: data.Portfolio_Performance_Yaxis_Data,
  datasets: [{
      label: 'Portfolio Performance',
      borderColor: '#4B4B4B',
      data: data.Portfolio_Performance_Xaxis_Data,
  }]
   },
  options: {
      responsive: true,
      maintainAspectRatio: false,


      elements: {
          point:{
              radius: 2
            }
          }
      }
  });
}
});
}
function Stock_Performance_Chart2(){
var TITLE = 'Individual Stock Performance';
var X_AXIS = 'Time Period'; // x-axis label and label in tooltip
var Y_AXIS = 'Price Normalized to 100'; // y-axis label and label in tooltip
var BEGIN_AT_ZERO = false; // Should x-axis start from 0? true or false
var SHOW_GRID = true; // true to show the grid, false to hide
var SHOW_LEGEND = true; // true to show the legend, false to hide
$(document).ready(function() {
// Read data file and create a chart
$.get('/return-files', function(csvString) {

  var data = Papa.parse(csvString).data;
  var timeLabels = data.slice(1).map(function(row) { return row[0]; });

  var datasets = [];
  for (var i = 1; i < data[0].length; i++) {
    datasets.push(
      {
        label: data[0][i], // column name
        data: data.slice(1).map(function(row) {return row[i]}), // data in that column
        fill: false // `true` for area charts, `false` for regular line charts
      }
    )
  }

  // Get container for the chart
  var ctx = document.getElementById('chart-container').getContext('2d');

  new Chart(ctx, {
    type: 'line',

    data: {
      labels: timeLabels,
      datasets: datasets,
    },

    options: {
      title: {
        display: true,
        text: TITLE,
        fontSize: 14,
      },
      legend: {
        display: SHOW_LEGEND,
      },
      maintainAspectRatio: false,
      scales: {
        xAxes: [{
          scaleLabel: {
            display: X_AXIS !== '',
            labelString: X_AXIS
          },
          gridLines: {
            display: SHOW_GRID,
          },
          ticks: {
            callback: function(value, index, values) {
              return value.toLocaleString();
            }
          }
        }],
        yAxes: [{
          beginAtZero: true,
          scaleLabel: {
            display: Y_AXIS !== '',
            labelString: Y_AXIS
          },
          gridLines: {
            display: SHOW_GRID,
          },
          ticks: {
            beginAtZero: BEGIN_AT_ZERO,
            callback: function(value, index, values) {
              return value.toLocaleString()
            }
          }
        }]
      },
      tooltips: {
        displayColors: false,
        callbacks: {
          label: function(tooltipItem, all) {
            return all.datasets[tooltipItem.datasetIndex].label
              + ': ' + tooltipItem.yLabel.toLocaleString();
          }
        }
      },
      plugins: {

        colorschemes: {

          scheme: 'brewer.PuRd4'

        }

      }
    }
  });

});
});
} `
Angular 10+ throws:
CommonJS or AMD dependencies can cause optimization bailouts.
For more info see: https://angular.io/guide/build#configuring-commonjs-dependencies
Hi Team,
I am using vanilla .NET MVC website (have razor cshtml view file) where I have got both chart.js and chartjs-plugin-colorschemes installed (installed via LibMan client side library). Having followed instructions, I am receiving the following message on console (F12 dev tools in browser):
Uncaught TypeError: Cannot read properties of undefined (reading 'plugins') in both .min.js and .js versions.
Inspecting the main JS file the error is here:
Chart.defaults.global.plugins.colorschemes = {
	scheme: 'brewer.Paired12',
	fillAlpha: 0.5,
	reverse: false,
	override: false
};
Additionally, I tried the NPM runkit option:
https://npm.runkit.com/chartjs-plugin-colorschemes and it returns the same error.
My Razor Page:
<div class="row">
        <div class="col-lg-4">
            <canvas id="myChart"></canvas>
        </div>
    </div>

<script>
    const ctx = document.getElementById('myChart').getContext('2d');
    const myChart = new Chart(ctx, {
        type: 'bar',
        data: {
            labels: ['Red', 'Blue', 'Yellow', 'Green', 'Purple', 'Orange'],
            datasets: [{
                label: '# of Votes',
                data: [4, 6, 3, 5, 2, 3],
                borderWidth: 1
            }]
        },
        options: {
            plugins: {
                colorschemes: {
                    scheme: 'brewer.GnBu6'
                }
            }
        }
    });
</script>
My Master / Layout page:
<script src="~/Content/js/ChartJS3.7.1/chart.min.js"></script>
<script src="~/Content/js/ChartJsColorSchemes0.4.0/chartjs-plugin-colorschemes.js"></script>
My Index View:
The bar chart renders but without any colours scheme applied.
Perhaps I am not doing something right? Apologies if that is the case.
I have spotted an issue and not sure if there is a way around it.
If one dataset has multiple rows, lines, columns then the bars/lines are all coloured the same colour:
e.g.
let title = data.chartData[0].chartTitle;
let labels = data.chartData.map(a => a.title);
let values = data.chartData.map(a => a.value);
...
datasets: [{
   label: title,
   borderWidth: 1,
   data: values
},
Is there a way around this or do I need to design my charts differently or find another solution to colour the bars?
I can colour them by specifying an array of background colours.
Thanks
Robin
Should it be possible to let users define their own complete schemes? Or is the custom-Function the way to go for this?
If I change Chart.defaults.global.plugins.colorschemes.scheme at any time, including before I define the first chart, the scheme color value is not used when I do create a chart.
For some reason, it always defaults to the value of ('brewer.Accent4'). That's odd. Where does that value come from?
The default value you have set in the plugin ('brewer.Paired12') is not used.
I can get a specific chart to draw with the scheme I want by setting ch.options.plugins.colorschemes.scheme
That works fine. But setting the global fails to fall through to a chart when I do not set the scheme on the chart directly. And again, the odd value of scheme that gets used for whatever reason is ('brewer.Accent4').
Note that I am only using scatter-type charts if that makes any difference.
It would be nice to be able to set the global and then have all charts pull from that, but right now the global setting is useless... and worse, wrong.
First I just want to say that this is a fantastic idea and I'm really happy you developed the package. Pretty crazy that something like this isn't included by default in chartJS. I am unfortunately having some trouble getting it working within my application though.
I am loading your package via jsdelivr CDN, and using it along with chartJS within a basic jQuery document ready function. I am not a JS expert so I guess I could be setting something up wrong here, but it's not apparent to me what it is. My code seems to match your examples, at least for setting up the config parameter.
Here is what my chart currently looks like:

Here is my loading of your package & chart js in my base html file:
    <script
      type="text/javascript"
      src="https://cdn.jsdelivr.net/npm/[email protected]"
    ></script>
    <script
      type="text/javascript"
      src="https://cdn.jsdelivr.net/npm/chartjs-plugin-colorschemes"
    ></script>
And here is my .js file containing the chartJS and your package code. Note that this file is called at the very end of the body of my base HTML file.
$(function() {
  /// code goes here that sets up data variables below (cacc, rsvc, models)
  /// not posted to keep post short

  let ctx = document.getElementById("stacked_chartjs");
  let chart = new Chart(ctx, {
    type: "line",
    data: {
      labels: ["January", "February", "March", "April", "May", "June", "July", "August"
      ],
      datasets: [
        {
          label: "Corporate Access",
          data: cacc
        },
        {
          label: "Research Services",
          data: rsvc
        },
        {
          label: "Models & Content",
          data: models
        }
      ]
    },
    options: {
      plugins: {
        colorschemes: {
          scheme: "brewer.Paired12"
        }
      },
      maintainAspectRatio: true,
      responsive: true,
      tooltips: {
        mode: "index",
        intersect: false
      },
      hover: {
        mode: "index"
      },
      scales: {
        xAxes: [
          {
            scaleLabel: {
              display: true,
              labelString: "Month"
            }
          }
        ],
        yAxes: [
          {
            stacked: true,
            scaleLabel: {
              display: true,
              labelString: "Consumpion"
            }
          }
        ]
      }
    }
  });
});
Hiya,
Next to my chart i'd like to show an overview of the avg,mix/max values of whats in my chart.
Would it be possible to grab the colors from the color scheme somehow?
Hello,
On a pie chart, after you hover on the pie section, the color returns to gray.


the fillAlpha option doesn't work on a bar chart..
I have a stacked series of bars. I would like to force the colors of the upper bar in the stack to be a ligher/less saturated hue than the lower color. Is this possible to do?
The default looks like this using brewer.Paired12.
I want to make the pink bar a lighter blue to match the bar below it, the red bar a light blue to match the dark blue below it, and so on.
Is it possible to reference the color in a series and adjust the saturation?
I, like many others here, ran into an issue using ChartJS version 3 and @nagix's colorschemes plugin. I use NPM + Webpack to manage my Javascript dependencies, so if you're looking for a working NPM package, I suggest checking out:
https://www.npmjs.com/package/chartjs-plugin-colorschemes-v3
The package is based on @m08pvv's fork of @zsu's fork of this repo. Kudos to both of them!
What about ChartJS Version 4?
I tested chartjs-plugin-colorschemes-v3, and unfortunately, it does not work with version 4. I spent a few hours trying to figure out the problem, but I hit a brick wall. Perhaps someone smarter than me can figure out why colorschemes won't register itself as a global plugin in version 4.
I hope that @zsu and @m08pvv update their repos to enable Issues so we can report bugs and such.
Using the following:
"chart.js": "^4.4.2",
"chartjs-plugin-annotation": "^3.0.1",
"chartjs-plugin-colorschemes": "^0.4.0",
"chartjs-plugin-datalabels": "^2.2.0",
"ng2-charts": "^5.0.4",
I am trying to create a custom color scheme, as shown in the docs:
colors: string[] = ['#43B02A', '#61B3E4', '#9E7691', '#70A087', '#00968F', '#CC6C4E', '#005E5D', '#007396', '#59315F', '#414042', '#003CA6', '#7DDBD3', '#FFCD00'];
 public lineChartOptions: ChartConfiguration['options'] = {
   responsive: true,
   plugins: {
     legend: { position: 'top', },
     title: { display: true, text: 'Chart.js Line Chart' },
     colorscheme: { scheme: this.colors, }
   }
 };
 public lineChartType: ChartType = 'line';
however, I get an error on the colorscheme line stating:
Object literal my only specify known properties, and 'colorscheme' does not exist in type '_DeepPartialObject<PluginOptionsByType<keyof ChartTypeRegistry>>'
I figure this is a ng2-charts issue, related to Chart.register() - but I have not been able to figure out how to register this plugin.
Hi all,
Do we plan to upgrade this package to adapt Chartjs v4.x ang Typescript ?
Is there a way of using these colour schemes for an HTML legend? I have multiple charts and don't want the legend to appear after each of them. I was thinking that I would use a custom HTML legend above the charts. But how do I use the scheme with the HTML legend?
Including chartjs-plugin-colorschemes enables point labels without asking. See this example:
https://jsfiddle.net/nicmcd/fcw9pt3k/
If you comment out the inclusion of the chartjs-plugin-colorschemes script, then the labels disappear. I want to use a color scheme, but I don't want it to alter any except the colors.
Am I doing something wrong or is there a bug?
Does anyone know whether there is a "maintained" alternative to this repository?
(great job, by the way!)
Just included the js file in html page and havent added colorschemes to plugins yet. Still getting error. https://stackoverflow.com/questions/74630153/chartjs-3-9-1-and-colorscheme-not-working

Modularizing the color schema(s) will greatly reduce the user payload.
i.e:
Instead of:
import 'chartjs-plugin-colorschemes'; // This loads everything at 50K!Use:
import { OfficeAspect6 } from 'chartjs-plugin-colorschemes'; // Only loads what's needed = 75 bytes!!Nice plugin. It seems to work well for the POINTS on my scatter charts, but the lines between the points are left as the default gray color that comes with chartjs.
How can I fix this problem?
After merging #26 it would be nice to see it as npm package's release :)
Trying to build the project, got an error after running gulp build, what am I doing wrong?
node --version
v14.15.5
npm --version
7.5.4
gulp --version
CLI version: 2.3.0
Local version: 4.0.2
Steps to reproduce
git clone https://github.com/nagix/chartjs-plugin-colorschemes
cd chartjs-plugin-colorschemes
npm install
gulp build
isangjae@siin-iui-MacBookPro chartjs-plugin-colorschemes % gulp build
[14:26:46] Using gulpfile /Volumes/DK_DEV/project/chartjs-plugin-colorschemes/gulpfile.js
[14:26:46] Starting 'build'...
[14:26:46] 'build' errored after 3.24 ms
[14:26:46] Error: Cannot find module 'rollup/bin/rollup'
Require stack:
- /Volumes/DK_DEV/project/chartjs-plugin-colorschemes/gulpfile.js
- /usr/local/lib/node_modules/gulp/node_modules/gulp-cli/lib/shared/require-or-import.js
- /usr/local/lib/node_modules/gulp/node_modules/gulp-cli/lib/versioned/^4.0.0/index.js
/* global Promise */
- /usr/local/lib/node_modules/gulp/node_modules/gulp-cli/index.js
- /usr/local/lib/node_modules/gulp/bin/gulp.js
    at Function.Module._resolveFilename (internal/modules/cjs/loader.js:880:15)
    at Function.resolve (internal/modules/cjs/helpers.js:94:19)
    at /Volumes/DK_DEV/project/chartjs-plugin-colorschemes/gulpfile.js:24:21
    at new Promise (<anonymous>)
    at run (/Volumes/DK_DEV/project/chartjs-plugin-colorschemes/gulpfile.js:22:9)
    at /Volumes/DK_DEV/project/chartjs-plugin-colorschemes/gulpfile.js:40:9
    at build (/Volumes/DK_DEV/project/chartjs-plugin-colorschemes/node_modules/undertaker/lib/set-task.js:13:15)
    at bound (domain.js:413:15)
    at runBound (domain.js:424:12)
    at asyncRunner (/Volumes/DK_DEV/project/chartjs-plugin-colorschemes/node_modules/async-done/index.js:55:18)
    at processTicksAndRejections (internal/process/task_queues.js:75:11)
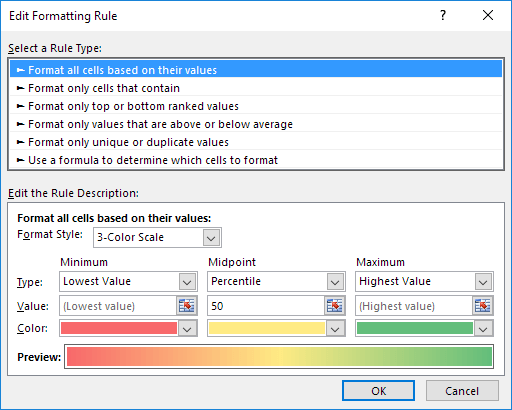
I was wondering if there was any way to create a color scale that would obtain a color based on a certain value.
My target is to make this plot have brighter colors for higher absolute values i.e. progressively brighter green for high positive values and the same thing (in red) for high negative values.

Microsoft Excel can create this color scale in the Conditional Formatting section and the result looks like this:

Hi everyone!
I'm trying to use the chartjs-plugin-colorschemes in my angular 1.7 app with no success. I'm using angular-chart.js as a Chart.js wrapper.
I installed the plugin via npm and followed the steps in the tutorial but still doesn't work.
Can you confirm if the plugin is supported by angular 1.7x apps ?
Thanks in advance!
if i use
colorschemes: { scheme: 'brewer.Paired12', }
how can add bordercolor to my graphic?
I love the idea behind this project... unfortunately I just tried it and it doesn't work. I followed the directions exactly as described and all of my metrics are all grey colored. There are also no errors.
chart.js version 2.7.3
chartjs-plugin-colorschemes version 0.1.0
installed with npm
using react


A declarative, efficient, and flexible JavaScript library for building user interfaces.
🖖 Vue.js is a progressive, incrementally-adoptable JavaScript framework for building UI on the web.
TypeScript is a superset of JavaScript that compiles to clean JavaScript output.
An Open Source Machine Learning Framework for Everyone
The Web framework for perfectionists with deadlines.
A PHP framework for web artisans
Bring data to life with SVG, Canvas and HTML. 📊📈🎉
JavaScript (JS) is a lightweight interpreted programming language with first-class functions.
Some thing interesting about web. New door for the world.
A server is a program made to process requests and deliver data to clients.
Machine learning is a way of modeling and interpreting data that allows a piece of software to respond intelligently.
Some thing interesting about visualization, use data art
Some thing interesting about game, make everyone happy.
We are working to build community through open source technology. NB: members must have two-factor auth.
Open source projects and samples from Microsoft.
Google ❤️ Open Source for everyone.
Alibaba Open Source for everyone
Data-Driven Documents codes.
China tencent open source team.