JS call stack visualization JS 调用栈可视化工具
因为 hound-trace 实现原理是在函数中注入代码(无变量接收的函数表达式、匿名函数已过滤),所以需要配套安装此插件:
yarn babel-plugin-hound-trace -D # npm install babel-plugin-hound-trace -D安装后需要在你的 babel 的 plugins 配置项中添加该插件,比如使用的是 .babelrc 配置的,则添加的配置如下:
{
    "presets": ["@babel/preset-react"],
    "plugins": [
        "hound-trace" // 添加该插件
    ]
}注意:因为该插件会在函数中注入代码,建议只在开发环境下使用。
hound-trace-ui 提供了收集调用栈信息,以及可视化(使用的 mermaid )展示调用栈的接口。
安装:
yarn hound-trace-ui -D # npm install hound-trace-ui -D首先需要导入包:
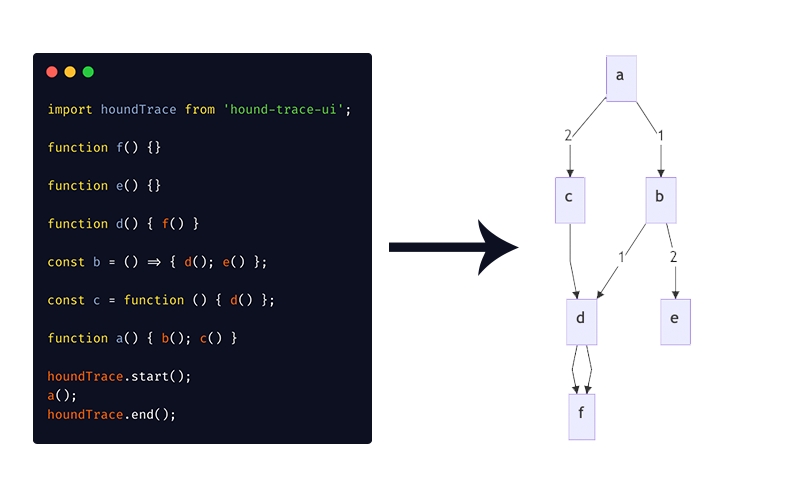
import houndTrace from "hound-trace-ui";然后在你需要开始捕获调用栈的地方调用下面的函数:
houndTrace.start();最后在你想要结束捕获的地方调用下面的函数:
houndTrace.end();如果没有什么意外,会在页面上显示当前调用栈的流程图。
这是 example 的代码经过 hound-trace 捕获后得到的图。
欢迎反馈问题或建议!
点击这个链接提交 issues page.
造这个轮子的背景文章:写一个 JS 调用栈可视化工具 hound-trace
This README was generated with ❤️ by readme-md-generator

![dependabot[bot] avatar](https://avatars.githubusercontent.com/in/29110?v=4 "dependabot[bot]")