Code Monkey home page Code Monkey logo

geocolor's Introduction

Geocolor

Build Status

Geocolor is both a javascript module and a web app. The web app makes it easy to demo the functionality or use to create quick visualizations without having to code. It can be found at geocolor.io.

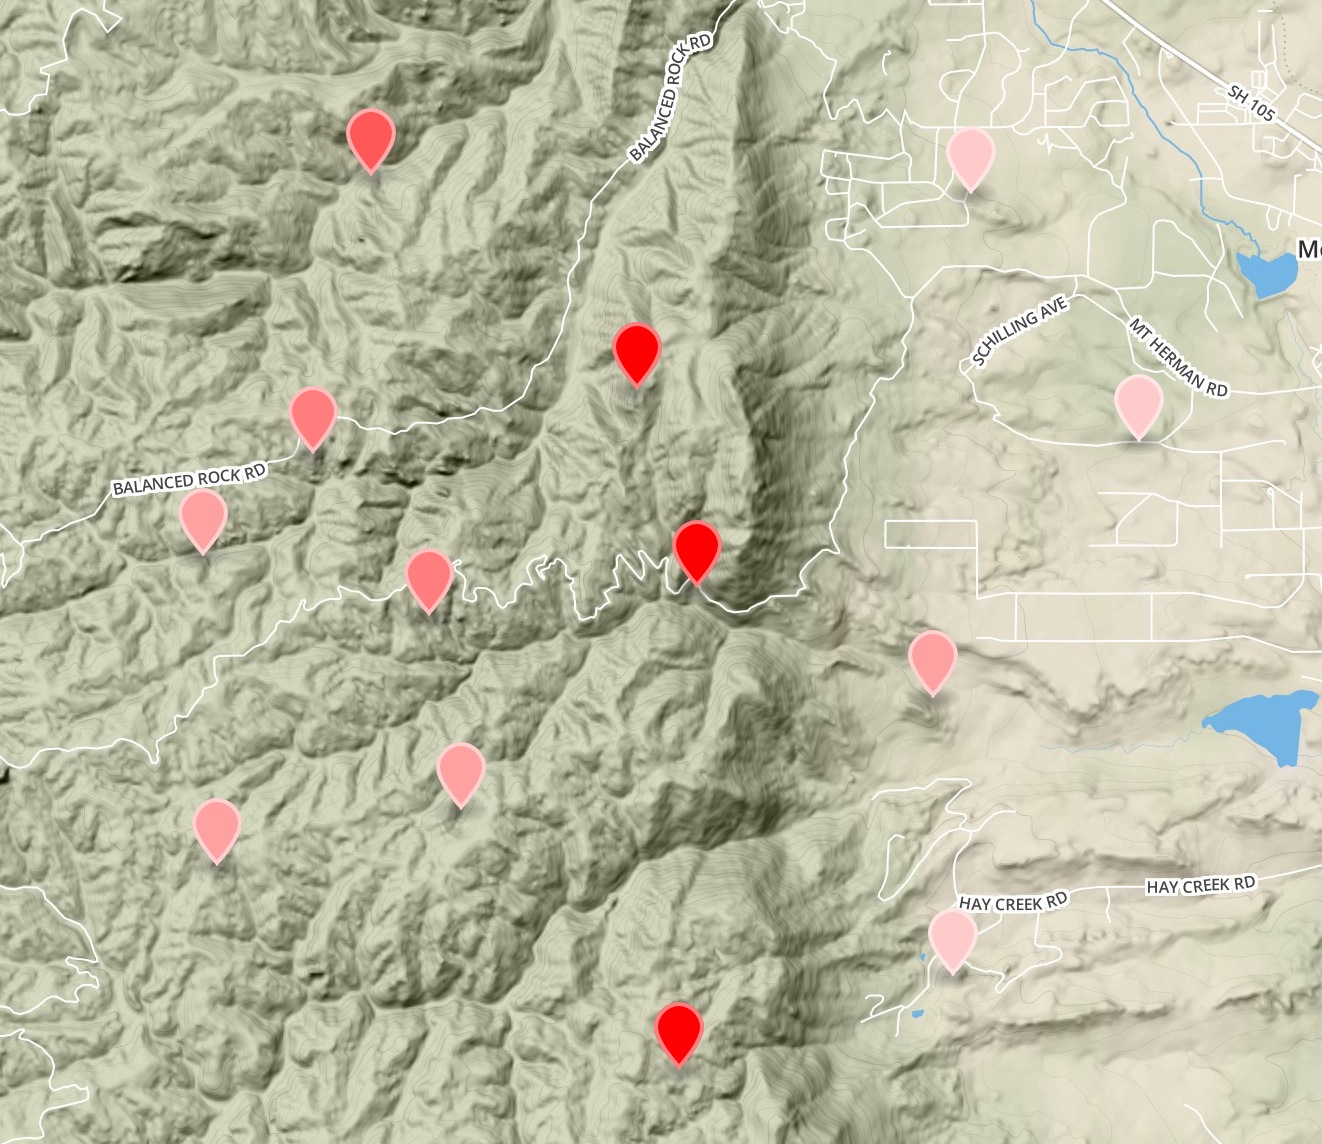
Geocolor classifies data contained in geojson properties, and assigns color values based on the simplestyle-spec. This means that when your geojson is rendered in github, gists, mapbox, or other simplestyle-spec compliant renderers, you will get nice styles that help to visualize your data.

sc-counties

Install

npm install geocolor

Colors

The color gradient is defined by simply passing an array of colors with as many stops as you want.

Classification

Curently supported classifications:

  • equal intervals
  • quantiles
  • jenks
  • custom
  • random
  • all

Example

gradient

var geocolor = require('geocolor')

var cities = {
  // [point data](https://github.com/morganherlocker/geocolor/blob/master/test/in/cities.geojson)
}

var z = 'Population',
    numberOfBreaks = 5,
    colors = ['green', 'yellow', 'red']

// jenks
geoJenks = geocolor.jenks(cities, z, numberOfBreaks, colors)
console.log(geoJenks)

// quantiles
geoQuantiles = geocolor.quantiles(cities, z, numberOfBreaks, colors)
console.log(geoQuantiles)

// equal intervals
geoEqualIntervals = geocolor.equalIntervals(cities, z, numberOfBreaks, colors)
console.log(geoEqualIntervals)

// custom breaks
geoCustom = geocolor.custom(cities, z, [0,200000,300000,400000,500000,800000,1000000,1000000000], colors)
console.log(geoCustom)

// random colors
geoRandom = geocolor.random(geo, ['green', 'yellow', 'red', 'blue', 'purple', 'orange', 'pink'])
console.log(geoRandom)

// all (assigns the same style to all features)
var style = {
  'stroke': 'blue',
  'fill-opacity': .7,
  'fill': 'green'
}
geoAll = geocolor.all(geo, style)
console.log(geoRandom)

You can also pass in a custom style object to any of the functions that will applied to all features as an optional parameter. The following will perform a quantile white to red ramp, will set the stroke to blue, and will set the fill opacity to .4.

var geocolor = require('geocolor')

var cities = {
  // [point data](https://github.com/morganherlocker/geocolor/blob/master/test/in/cities.geojson)
}

var z = 'Population',
    numberOfBreaks = 15,
    colors = ['white', 'red']

var style = {
  'stroke': 'blue',
  'fill-opacity': .4
}

// quantiles
geoQuantiles = geocolor.quantiles(cities, z, numberOfBreaks, colors, style)
console.log(geoQuantiles)

Dev

Running tests:

npm test

More Examples

rivers

choloropleth

gradient

gradient

geocolor's People

Contributors

jmann6 avatar maptastik avatar morganherlocker avatar

Stargazers

 avatar  avatar  avatar  avatar  avatar  avatar  avatar  avatar  avatar  avatar  avatar  avatar  avatar  avatar  avatar  avatar  avatar  avatar  avatar  avatar  avatar  avatar  avatar  avatar  avatar  avatar  avatar  avatar  avatar  avatar  avatar  avatar  avatar  avatar  avatar  avatar  avatar  avatar  avatar  avatar  avatar  avatar  avatar  avatar  avatar  avatar  avatar  avatar  avatar  avatar  avatar  avatar  avatar  avatar  avatar  avatar  avatar  avatar  avatar  avatar  avatar  avatar  avatar  avatar  avatar  avatar  avatar  avatar  avatar  avatar  avatar  avatar  avatar  avatar  avatar  avatar  avatar  avatar  avatar  avatar  avatar  avatar  avatar  avatar  avatar  avatar  avatar  avatar  avatar  avatar  avatar  avatar  avatar  avatar  avatar  avatar  avatar  avatar  avatar  avatar

Watchers

 avatar  avatar  avatar  avatar  avatar  avatar  avatar

geocolor's Issues

help tips

Add help tips for each of the controls

cli

simple cli for piping in geojson data and piping out styled data

share button

share a fullscreen map with a link to a bl.ock, sort of like the one on geojson.io

Styles controls

Allow styles to be controlled by either buttons/inputs or as raw text.

fullscreen

This should be a button, and may be the default for links, or an option in the url params. This will make it easy to share visualizations with non technical users.

Legend

Needs a legend to be generated from classification output

Unique Cagtegory Classification

Add the ability to parse strings and group by unique values in geocolor.io. This may become a part of the geocolor module as well, but I have not decided yet.

remove bootstrap

All I need is to do set the fonts, form controls, and textarea styles to remove bootstrap.

all()

takes a feature collection and a set of styles and applies them.

Trying to do geocolor and not sure what I'm missing

Thanks for your help! It took me a little longer to get all the data together.

I can load this map on http://geocolor.io/# but all I see are dots rather then regions being colored.

The input file:
heatmap.geojson.zip
The code:

var geocolor = require('geocolor');

var fs = require('fs');

try {
  var heatmap = JSON.parse(fs.readFileSync('./heatmap.geojson'));
} catch (err) {
  console.log('err',err);
}

var z = 'stars',
    numberOfBreaks = 5,
    colors = ['red', 'blue', 'white'];

// jenks
var geoJenks = geocolor.jenks(heatmap, z, numberOfBreaks, colors);

fs.writeFileSync('./jenks.geojson', JSON.stringify(geoJenks));

My output Jenks.json:
jenks.geojson.zip

The share: http://bl.ocks.org/anonymous/raw/39c4ed96bf428cc67344

load sample

Somewhere there should be a load sample button. Perhaps it could even be a flag passed into the URL and read on load.

Recommend Projects

  • React photo React

    A declarative, efficient, and flexible JavaScript library for building user interfaces.

  • Vue.js photo Vue.js

    ๐Ÿ–– Vue.js is a progressive, incrementally-adoptable JavaScript framework for building UI on the web.

  • Typescript photo Typescript

    TypeScript is a superset of JavaScript that compiles to clean JavaScript output.

  • TensorFlow photo TensorFlow

    An Open Source Machine Learning Framework for Everyone

  • Django photo Django

    The Web framework for perfectionists with deadlines.

  • D3 photo D3

    Bring data to life with SVG, Canvas and HTML. ๐Ÿ“Š๐Ÿ“ˆ๐ŸŽ‰

Recommend Topics

  • javascript

    JavaScript (JS) is a lightweight interpreted programming language with first-class functions.

  • web

    Some thing interesting about web. New door for the world.

  • server

    A server is a program made to process requests and deliver data to clients.

  • Machine learning

    Machine learning is a way of modeling and interpreting data that allows a piece of software to respond intelligently.

  • Game

    Some thing interesting about game, make everyone happy.

Recommend Org

  • Facebook photo Facebook

    We are working to build community through open source technology. NB: members must have two-factor auth.

  • Microsoft photo Microsoft

    Open source projects and samples from Microsoft.

  • Google photo Google

    Google โค๏ธ Open Source for everyone.

  • D3 photo D3

    Data-Driven Documents codes.