Code Monkey home page Code Monkey logo

dalextra's Introduction

DALEXtra

R build status Coverage Status CRAN_Status_Badge Total Downloads DrWhy-eXtrAI

Overview

The DALEXtra package is an extension pack for DALEX package. It contains various tools for XAI (eXplainable Artificial Intelligence) that can help us inspect and improve our model. Functionalities of the DALEXtra could be divided into two areas.

  • Champion-Challenger analysis
    • Lets us compare two or more Machine-Learning models, determinate which one is better and improve both of them.
    • Funnel Plot of performance measures as an innovative approach to measure comparison.
    • Automatic HTML report.
  • Cross language comparison
    • Creating explainers for models created in different languges so they can be explained using R tools like DrWhy.AI family.
    • Currently supported are Python scikit-learn and keras, Java h2o, R xgboost, mlr, mlr3 and tidymodels.

Installation

# Install the development version from GitHub:

# it is recommended to install latest version of DALEX from GitHub
devtools::install_github("ModelOriented/DALEX")
# install.packages("devtools")
devtools::install_github("ModelOriented/DALEXtra")

or latest CRAN version

install.packages("DALEX")
install.packages("DALEXtra")

Other packages useful with explanations.

devtools::install_github("ModelOriented/ingredients")
devtools::install_github("ModelOriented/iBreakDown")
devtools::install_github("ModelOriented/shapper")
devtools::install_github("ModelOriented/auditor")
devtools::install_github("ModelOriented/modelStudio")

Above packages can be used along with explain object to create explanations (ingredients, iBreakDown, shapper), audit our model (auditor) or automate the model exploration process (modelStudio).

Champion-Challenger analysis

Without any doubts, comparison of models, especially black-box ones is a very important use case nowadays. Every day new models are being created and we need tools that can allow us to determinate which one is better. For this purpose we present Champion-Challenger analysis. It is set of functions that creates comparisons of models and later can be gathered up to create one report with generic comments. Example of report can be found here. As you can see any explanation that has generic plot() function can be plotted.

Funnel Plot

Core of our analysis is funnel plot. It lets us find subsets of data where one of the models is significantly better than the other ones. That ability is insanely useful, when we have models that have similiar overall performance and we want to know which one should we use.

 library("mlr")
 library("DALEXtra")
 task <- mlr::makeRegrTask(
   id = "R",
   data = apartments,
   target = "m2.price"
 )
 learner_lm <- mlr::makeLearner(
   "regr.lm"
 )
 model_lm <- mlr::train(learner_lm, task)
 explainer_lm <- explain_mlr(model_lm, apartmentsTest, apartmentsTest$m2.price, label = "LM", 
                             verbose = FALSE, precalculate = FALSE)

 learner_rf <- mlr::makeLearner(
   "regr.randomForest"
 )
 model_rf <- mlr::train(learner_rf, task)
 explainer_rf <- explain_mlr(model_rf, apartmentsTest, apartmentsTest$m2.price, label = "RF",
                             verbose = FALSE, precalculate = FALSE)

 plot_data <- funnel_measure(explainer_lm, explainer_rf, 
                             partition_data = cbind(apartmentsTest, 
                                                    "m2.per.room" = apartmentsTest$surface/apartmentsTest$no.rooms),
                             nbins = 5, measure_function = DALEX::loss_root_mean_square, show_info = FALSE)
plot(plot_data)[[1]]

Such situation is shown in the following plot. Both, `LM` and `RF` models have smiliar RMSE, but Funnel Plot shows that if we want to predict expensive or cheap apartments, we definetly should use `LM` while `RF` for average priced apartments. Also without any doubt `LM` is much better than `RF` for `Srodmiescie` district. Following use case shows us how powerful of a tool Funnel Plot can be, for example we can compound two or more models into one based on areas acquired from the Plot and thus improve our models. One another advantage of Funnel Plot is that it doesn’t require model to be fitted with Variables shown on the plot, as you can see, `m2.per.room` is an artificial variable.

Cross language comparison

Here we will present a short use case for our package and its compatibility with Python.

How to setup Anaconda

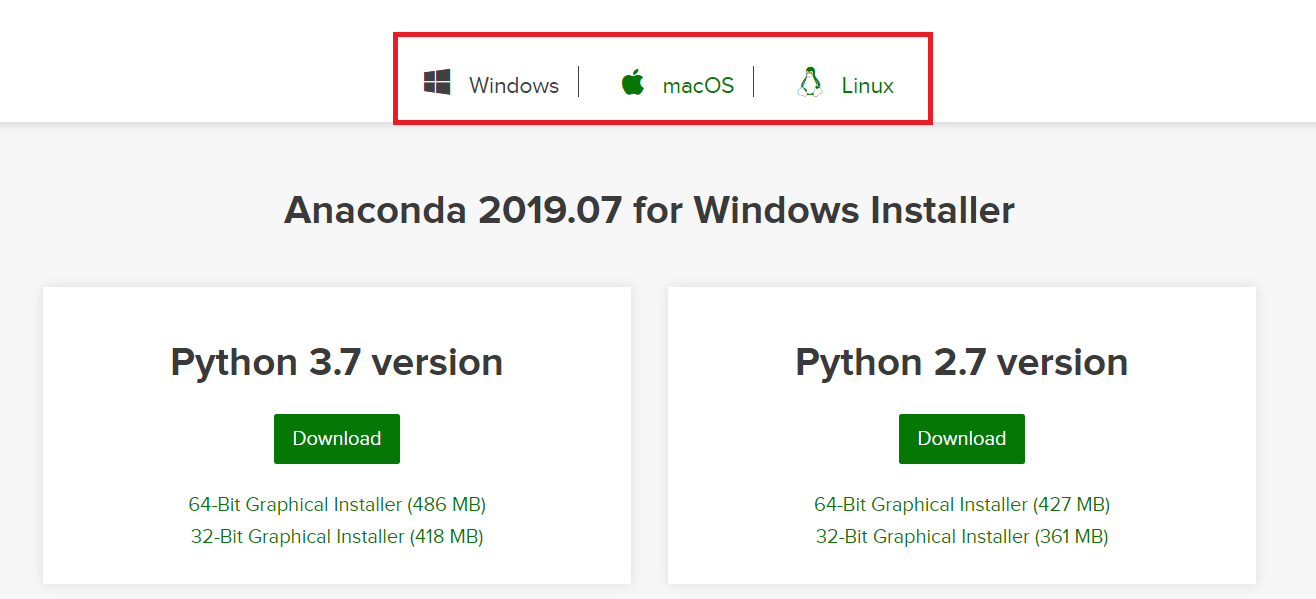
In order to be able to use some features associated with DALEXtra, Anaconda is needed. The easiest way to get it, is visiting Anaconda website. And choosing proper OS as it stands in the following picture. There is no big difference bewtween Python versions when downloading Anaconda. You can always create virtual environment with any version of Python no matter which version was downloaded first.
Windows

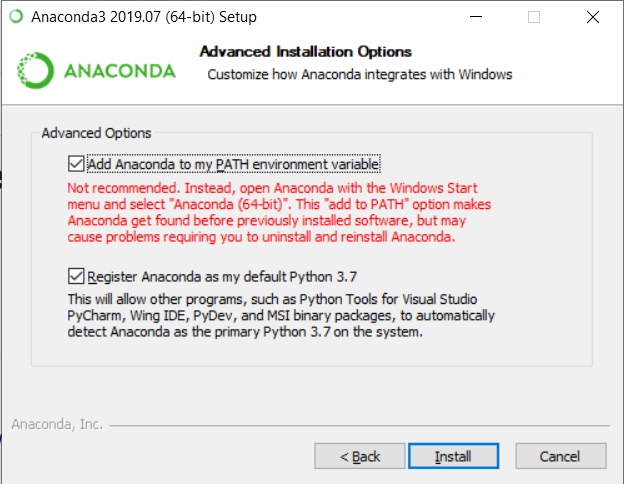
Crucial thing is adding conda to PATH environment variable when using Windows. You can do it during the installation, by marking this checkbox.

or, if conda is already installed, follow those instructions.

Unix

While using unix-like OS, adding conda to PATH is not required.

Loading data

First we need provide the data, explainer is useless without them. The thing is that Python object does not store training data so we always have to provide a dataset. Feel free to use those attached to DALEX package or those stored in DALEXtra files.

titanic_test <- read.csv(system.file("extdata", "titanic_test.csv", package = "DALEXtra"))

Keep in mind that dataframe includes target variable (18th column) and scikit-learn models cannot work with it.

Creating explainer

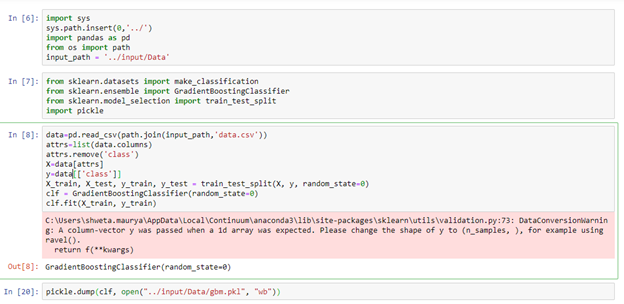
Creating explainer from scikit-learn Python model is very simple thanks to DALEXtra. The only thing you need to provide is path to pickle and, if necessary, something that lets recognize Python environment. It may be a .yml file with packages specification, name of existing conda environment or path to Python virtual environment. Execution of scikitlearn_explain only with .pkl file and data will cause usage of default Python.

library(DALEXtra)
explainer <- explain_scikitlearn(system.file("extdata", "scikitlearn.pkl", package = "DALEXtra"),
yml = system.file("extdata", "testing_environment.yml", package = "DALEXtra"), 
data = titanic_test[,1:17], y = titanic_test$survived, colorize = FALSE)
## Preparation of a new explainer is initiated
##   -> model label       :  scikitlearn_model  (  default  )
##   -> data              :  524  rows  17  cols 
##   -> target variable   :  524  values 
##   -> predict function  :  yhat.scikitlearn_model  will be used (  default  )
##   -> predicted values  :  numerical, min =  0.02086126 , mean =  0.288584 , max =  0.9119996  
##   -> model_info        :  package reticulate , ver. 1.16 , task classification (  default  ) 
##   -> residual function :  difference between y and yhat (  default  )
##   -> residuals         :  numerical, min =  -0.8669431 , mean =  0.02248468 , max =  0.9791387  
##   A new explainer has been created!

Now with explainer ready we can use any of DrWhy.Ai universe tools to make explanations. Here is a small demo.

Creating explanations

library(DALEX)
plot(model_performance(explainer))

library(ingredients)
plot(feature_importance(explainer))

describe(feature_importance(explainer))
## The number of important variables for scikitlearn_model's prediction is 3 out of 17. 
##  Variables gender.female, gender.male, age have the highest importantance.
library(iBreakDown)
plot(break_down(explainer, titanic_test[2, 1:17]))

describe(break_down(explainer, titanic_test[2, 1:17]))
## Scikitlearn_model predicts, that the prediction for the selected instance is 0.132 which is lower than the average model prediction.
## 
## The most important variable that decrease the prediction is class.3rd.
## 
## Other variables are with less importance. The contribution of all other variables is -0.108.
library(auditor)
eval <- model_evaluation(explainer)
plot_roc(eval)

# Predictions with newdata
predict(explainer, titanic_test[1:10, 1:17])
##  [1] 0.3565896 0.1321947 0.7638813 0.1037486 0.1265221 0.2949228 0.1421281
##  [8] 0.1421281 0.4154695 0.1321947

Acknowledgments

Work on this package was financially supported by the NCN Opus grant 2016/21/B/ST6/02176.

dalextra's People

Contributors

anityagan9urde avatar hbaniecki avatar kant avatar kasiapekala avatar maksymiuks avatar pbiecek avatar rnorberg avatar

Stargazers

 avatar  avatar  avatar  avatar  avatar  avatar  avatar  avatar  avatar  avatar  avatar  avatar  avatar  avatar  avatar  avatar  avatar  avatar  avatar  avatar  avatar  avatar  avatar  avatar  avatar  avatar  avatar  avatar  avatar  avatar  avatar  avatar  avatar  avatar  avatar  avatar  avatar  avatar  avatar  avatar  avatar  avatar  avatar  avatar  avatar  avatar  avatar  avatar  avatar  avatar  avatar  avatar  avatar  avatar  avatar  avatar  avatar  avatar  avatar  avatar  avatar  avatar

Watchers

 avatar  avatar  avatar  avatar  avatar  avatar

dalextra's Issues

Support for `stacks`

Hi there,

I am wondering if you could provide support for using DALEX in conjunction with stacks from the tidymodels ecosystem to enable model explanations for model stacks?

Best,
Simon

DALEXverse 0.19.8 release summer 2019

DALEXverse 0.19.8 release summer 2019

Integration

  • readability: vignettes
  • readability: NEWS
  • readability: DESCRIPTION
  • consistency: pkgdown website
  • consistency: entry at DrWhy.AI webpage

assigned: @pbiecek

Code review

  • consistency: names of functions
  • consistency: names of files
  • consistency: names of variables in functions (local and global)
  • length: functions
  • readability: code (comments, constructions)

assigned: @hbaniecki

Feature review

  • readability: documentation (title, description, details)
  • readability: examples (relevant, complete, with comments)
  • reproducibility: tests (code coverage)
  • links to functions: \code

assigned: @WojciechKretowicz

Update README

  1. Add step by step instruction how to install DALEXtra for python (install anaconda, create env, run explainer)
  2. In README add examples for few (2-3) plots, maybe break_down, feature_importance and ROC from auditor (if possible)
  3. If needed split these instructions into two versions, for windows and for unix

Check / auto-convert type of `explain_mlr3` input

The model input of explain_mlr3 should be an mlr3 Learner object, but there are a few things in mlr3 that can be converted to Learners automatically. Consider using mlr3::as_learner(model) instead of just model in the explain() call here:

explain_mlr3 <-
function(model,
data = NULL,
y = NULL,
weights = NULL,
predict_function = NULL,
predict_function_target_column = NULL,
residual_function = NULL,
...,
label = NULL,
verbose = TRUE,
precalculate = TRUE,
colorize = TRUE,
model_info = NULL,
type = NULL) {
explain(
model,
data = data,
y = y,
weights = weights,

or alternatively, mlr3::assert_learner() if you want to force your users to do the conversion for themselves. (Imho as_learner() would fit more naturally with how mlr3 behaves otherwise).

This bug was caused by someone accidentally using a Graph, expecting it to be converted to a Learner internally: mlr-org/mlr3pipelines#642

DALEXtra with textual data

Hi,
is it possible to explain a keras model (CNN) that has textual data as input with DALEX?
I've only seen examples with tabular data.
I preprocess the textual data with word embeddings and use them as a input for my CNN.

Thank you in advance!

features from tidymodels workflow being included that have been updated via update_role

When I try and run explain_tidymodels I have to include all the features that are in my dataset even though i have run update_role on the original recipie so they are not included in the analsysis.

Using the example from https://modeloriented.github.io/DALEXtra/reference/explain_tidymodels.html. I have included the update_role and it is still inlcuded.

library("DALEXtra")
library("tidymodels")

data <- titanic_imputed
data$survived <- as.factor(data$survived)
rec <- recipe(survived ~ ., data = data) %>%
  update_role(parch, new_role = "test_role") %>%
  step_normalize(fare)

model <- decision_tree(tree_depth = 25) %>%
  set_engine("rpart") %>%
  set_mode("classification")

wflow <- workflow() %>%
  add_recipe(rec) %>%
  add_model(model)


model_fitted <- wflow %>%
  fit(data = data)

explain_tidymodels(model_fitted, data = titanic_imputed, y = titanic_imputed$survived)

If I remove the offending feature then it returns a warning.

ex_data <- data %>%
  select(-parch)

explain_tidymodels(model_fitted, data =ex_data, y = titanic_imputed$survived)

I am having this problem with a randomforest regression workflow too.

How to use predict_function_target_column in explain_xgboost function?

I have an xgboost model with 7 class label. The guide says
predict_function_target_column: Character or numeric containing either column name or column number in the model prediction object of the class that should be considered as positive

What is the range of values I can use for predict_function_target_column. I was hoping the function to throw an error if I set
predict_function_target_column = 999 It did not, so not sure how to use this option.

feature-level data for tidymodels workflows

We're writing the chapter in the tidymodels book on model explainers. Right now, DALEXtra can compute importance scores on the original predictors for a workflow object:

library(tidymodels)
#> Registered S3 method overwritten by 'tune':
#>   method                   from   
#>   required_pkgs.model_spec parsnip
library(DALEXtra)
#> Loading required package: DALEX
#> Welcome to DALEX (version: 2.2.1).
#> Find examples and detailed introduction at: http://ema.drwhy.ai/
#> 
#> Attaching package: 'DALEX'
#> The following object is masked from 'package:dplyr':
#> 
#>     explain

tidymodels_prefer()
data("Chicago")

rec <- recipe(ridership ~ date + Clark_Lake + California, data = Chicago) %>% 
  step_date(date) %>% 
  step_holiday(date) %>% 
  update_role(date, new_role = "id") %>% 
  step_dummy(all_nominal_predictors())

lm_spec <- linear_reg() %>% set_engine("lm")

lm_wflow <- 
  workflow() %>% 
  add_model(lm_spec) %>% 
  add_recipe(rec) %>%
  fit(data = Chicago)

vip_original_predictors <- 
  explain_tidymodels(
    lm_wflow, 
    data = Chicago %>% select(date, Clark_Lake, California), 
    y = Chicago$ridership,
    verbose = FALSE
  ) %>% 
  model_parts()
vip_original_predictors
#>       variable mean_dropout_loss    label
#> 1 _full_model_          2.117953 workflow
#> 2   Clark_Lake          2.127304 workflow
#> 3   California          2.148961 workflow
#> 4         date          8.556402 workflow
#> 5   _baseline_          8.986275 workflow

Created on 2021-06-03 by the reprex package (v2.0.0)

We'd also like to get feature-level importances. For the example above, it would be good to know what components of date were important (day of the week, month, year, or holiday).

It would be great to either

  1. make explain_tidymodels() a generic with methods for workflow and model_fit objects or
  2. keep as-is and add a level = c("predictors", "features") option (or similar).

I think that the model_info() and yhat() would be very similar to the workflow methods; the predict() signatures and outputs are all the same.

For the second approach, an example syntax would be:

lm_fit <-
  lm_wflow %>% 
  pull_workflow_fit() # <- parsnip model_fit object

feature_data <- 
  lm_wflow %>% 
  pull_workflow_prepped_recipe() %>% 
  bake(new_data = Chicago)

vip_features <- 
  explain_tidymodels(
    lm_fit, 
    data = feature_data %>% select(-ridership), 
    y = feature_data$ridership
  ) %>% 
  model_parts()

@juliasilge

Interpreting model_parts() plot from DALEX or DALEXtra package

Hi, sorry if this is not appropriate to be asked here.

I tried to build a classification model and explain using DALEX package. Below is the reprex what I'm trying to do.

# Packages 
library(tidymodels)
library(mlbench)

# Data 
data("PimaIndiansDiabetes")
dat <- PimaIndiansDiabetes 
dat$some_new_group[1:384] <- "group 1" 
dat$some_new_group[385:768] <- "group 2"

# Split
set.seed(123)
ind <- initial_split(dat)
dat_train <- training(ind)
dat_test <- testing(ind)

# CV
set.seed(123)
dat_cv <- vfold_cv(dat_train, v = 10)

# Recipes
svm_rec <- 
  recipe(diabetes ~., data = dat_train) %>% 
  update_role(some_new_group, new_role = "group_var") %>% 
  step_rm(pressure) %>% 
  step_YeoJohnson(all_numeric_predictors())


# Model spec 
svm_spec <- 
  svm_rbf() %>% 
  set_mode("classification") %>% 
  set_engine("kernlab")

# Workflow 
svm_wf <- 
  workflow() %>% 
  add_recipe(svm_rec) %>% 
  add_model(svm_spec)

# Train
svm_trained <- 
  svm_wf %>% 
  fit(dat_train)

Notice in the recipes above, I removed variable pressure and make a new categorical variable (some_new_group).

Next, I try explain this model using DALEX.

# Explainer
library(DALEXtra)

svm_exp <- explain_tidymodels(svm_trained, 
                              data = dat %>% select(-diabetes), 
                              y = dat$diabetes %>% as.numeric(), 
                              label = "SVM")

## Variable importance
set.seed(123)
svm_vp <- model_parts(svm_exp, type = "variable_importance") 
svm_vp

Result of svm_vp.

         variable mean_dropout_loss label
1    _full_model_         0.6762916   SVM
2         glucose         0.5827101   SVM
3             age         0.6584117   SVM
4            mass         0.6599677   SVM
5        pregnant         0.6609174   SVM
6        pedigree         0.6620800   SVM
7         insulin         0.6686974   SVM
8         triceps         0.6691379   SVM
9        pressure         0.6762916   SVM
10 some_new_group         0.6762916   SVM
11     _baseline_         0.5017774   SVM    

Here is the plot.

plot(svm_vp) +
  ggtitle("Mean-variable importance over 50 permutations", "") 

Rplot

So,based on the plot, the most influential variable is glucose right? It does not make sense for some_new_group and pressure variables to be the most important variable as we do not use these variables in the model fitting. I have seen this post and this post and my plot looks a bit different as my most important variable is at the bottom while in both posts the most important variable is at the top. Even the direction of my bar plot is different. I attached one of the plots from the post as a comparison.
enter image description here

Did I miss something in the R code? or miss a certain step?

Variable importance plot lists only original variables, not one-hot-encoded variables, when permutation importance calculated with `model_parts()` and `explain_tidymodels()` functions?

I am using explain_tidymodels() to compute variable importance. I have a workflow which includes a recipe with a step_dummy() step. I'm trying to understand why the associated variable importance calculated with model_parts() is given for the original variables rather than the one-hot-encoded variables when this step is included. Is the permutation importance aggregated at some point for the group of one-hot-encoded variables that go together? I didn't see this explained in the documentation. Reprex below. Please advise, Thank you

library("DALEXtra")
library("tidymodels")
library("recipes")

# example with no dummy variables
data <- titanic_imputed

data$survived <- as.factor(data$survived)

rec <- recipe(survived ~ ., data = data) %>%
  step_normalize(fare)

model <- decision_tree(tree_depth = 25) %>%
  set_engine("rpart") %>%
  set_mode("classification")

wflow <- workflow() %>%
  add_recipe(rec) %>%
  add_model(model)

model_fitted <- wflow %>%
  fit(data = data)

explainTest <- explain_tidymodels(model_fitted, data = data, y = as.numeric(data$survived))
explainModelParts <- model_parts(explainTest, type="variable_importance")
plot(explainModelParts)


# example with dummy variables
data <- titanic_imputed

data$survived <- as.factor(data$survived)

rec <- recipe(survived ~ ., data = data) %>%
  step_dummy(gender, class, embarked, one_hot = TRUE) %>% # one hot encode the categorical variables
  step_normalize(fare)

model <- decision_tree(tree_depth = 25) %>%
  set_engine("rpart") %>%
  set_mode("classification")

wflow <- workflow() %>%
  add_recipe(rec) %>%
  add_model(model)

model_fitted <- wflow %>%
  fit(data = data)

explainModel <- explain_tidymodels(model_fitted, data = data, y = as.numeric(data$survived))

vipData <- model_parts(explainModel, type = "variable_importance")
plot(vipData) # this plot shows original variable names and does not include the one hot encoded variables

Which data (training/testing) should be used to build the explainer?

Hello @maksymiuks,

Many thanks for your great work. Recently I'm learning how to use DALEX and DALEXtra packages to conduct XAI analysis. May I ask you a question about the explain() function?

When doing machine learning, we first split the whole dataset into training and testing sets. I have seen most of the tutorials are using the testing set to build the explainer (for example this one). This is appropriate when we want to evaluate the model's overall performance.

However, if the analysis purpose is to investigate the relationship between the input features and the target variable (i.e., feature importance, feature effects, and feature interaction), should we use the training set to build the explainer?

Your kind guidance is much appreciated!

Best regards,
Xiaochi

Error when using `mlr3::Autotuner`.

when I try to use DALEXtra::explain_mlr3 and then DALEX::model_profile() with a trained AutoTuner$new(), I get

Error: Input task during prediction of int_to_num does not match input task during training.
This happened PipeOp int_to_num's $predict()

as an error message.
Please, notice that this error does not appear when doing a regular procedure within mlr3 --- Train a model, and then use it for predictions.

Error in utils::packageVersion(package) : there is no package called

Error when using explain_mlr():

library("mlr")
library("DALEX")

task <- mlr::makeClassifTask(id = "task",
                             data = HR,
                             target = "status")

learner <- mlr::makeLearner("classif.kknn",
                            predict.type = "response")

model <- mlr::train(learner, task)

explainer <- DALEXtra::explain_mlr(model = model,
                                   data = HR,
                                   y = HR[,6])

In console utils::packageVersion('kknn') yields 1.3.1.

Error while installing DALEXtra from GitHub: download of package 'vctrs' failed

When I try to install DALEXtra from GitHub, I get an error. I run:

devtools::install_github("ModelOriented/DALEXtra")

Then I choose to update all packages.

Subsequently I get this error:

trying URL 'https://cran.rstudio.com/bin/windows/contrib/3.6/vctrs_0.3.4.zip'
Error in download.file(url, destfile, method, mode = "wb", ...) : 
  (converted from warning) cannot open URL 'https://cran.rstudio.com/bin/windows/contrib/3.6/vctrs_0.3.4.zip': HTTP status was '404 Not Found'
Error: Failed to install 'DALEXtra' from GitHub:
  (converted from warning) download of package ‘vctrs’ failed

mlr3 based Multiclass Classification gives Error

hi, it appears that DALEXtra does not handle multiclass mlr3 ranger or rpart model. The task also has factor, logical and integer variables. Our dummy example code is given below. Any help please?
`
library(DALEX)
library(DALEXtra)
library(tidyverse)
library("mlr3verse")

df=data.frame(w=c(34,65,23,78,37),
x=c('a','b','a','c','c'),
y=c(TRUE,FALSE,TRUE,TRUE,FALSE),
z=c('alpha','alpha','delta','delta','phi')
)

df_task <- TaskClassif$new(id = "my_df", backend = df, target = "z")
df_lrn <- lrn("classif.rpart")
df_lrn$train(df_task)

df_lrn_exp <- explain_mlr3(df_lrn,
data = df,
y = df$z,
label = "DF lrnr exp")
df_vi <- model_parts(df_lrn_exp)
head(df_vi)

`

model_profile throws error when explaining some columns

Going through TidyModels in R and got to a super cool section on partial dependence profiles . I am having trouble reproducing the code on partial dependence profiles, specifically the model_profile function from DALEX throws an error about loss of precision for the column the text wants to explain, Year_Built.

  • I tried converting the Year_Built column from an integer to a double but I get the same error:
> pdp_age <- model_profile(explainer_rf, N = 500, variables = "Year_Built")
Error in `stop_vctrs()`:
! Can't convert from `Year_Built` <double> to `Year_Built` <integer> due to loss of precision.
• Locations: 2, 3, 5, 13, 14, 49, 53, 72, 73, 75, 83, 84, 119, 123, 142, 143, 145, 153, 154, 189, 193, 212, ...
Run `rlang::last_error()` to see where the error occurred.
  • Strangely, the code above does seem to run for other columns, like Latitude

I'm wondering if it might be a bug in model_profile

H2O multiclass : Error in contribution[nrow(contribution), ] <- cumulative[nrow(contribution), : incorrect number of subscripts on matrix

Trying to use DALEX on my data. Getting following error in line

pb_h2o_automl <- predict_parts(explainer_h2o_automl,new_observation = new_date_birth,type="break_down")

Error

Error in contribution[nrow(contribution), ] <- cumulative[nrow(contribution),  : 
  incorrect number of subscripts on matrix

Code

rm( list = ls() )

library(DALEX) ; library(h2o) ; library(DALEXtra) ; library(readxl) ; library(dplyr)
set.seed(17)

setwd( 'E:\\projects\\political_analysis' )

df0 = read_excel('training.xlsx')

df0$age = as.numeric( df0$age)

df1 <- df0[c("area", "district", "assembly_constituency", "gender", "age", "party_assembly_election_2018",
             "party_current_year_election", "chief_minister", "leader_vote_for_mla", "benefit_govt_scheme",
             "benefit_current_budget_scheme", "occupation", "education", "social_category", "caste", "caste_other",'party_upcoming_election')]

df1 <- df1 %>% mutate_all(~ifelse(is.na(.), as.character(names(which.max(table(na.omit(.))))), as.character(.))) %>% mutate_at(vars(-age), as.factor)

h2o.init()

target <- "party_upcoming_election"
df <- as.h2o(df1)

model_h2o_automl <- h2o.automl(y = target, training_frame = df, max_models = 5, max_runtime_secs = 600  )

leader_board <- h2o.get_leaderboard(model_h2o_automl)
head(leader_board)

test_df_0 = df1[1,]

explainer_h2o_automl <- DALEXtra::explain_h2o(model = model_h2o_automl, 
                                              data = test_df_0,
                                              y = test_df_0$party_upcoming_election,
                                              label = "h2o automl",
                                              colorize = T)

new_date_birth <- test_df_0 %>% select( - c('party_upcoming_election'))
pb_h2o_automl <- predict_parts(explainer_h2o_automl,new_observation = new_date_birth,type="break_down")

Have pasted first 50 rows of data here :

https://pastebin.com/C6ETyJbp

Scikit Learn Explainer version error 0.22.2post1

The following minimal example trains a rf on data online.
DALEXtra version 0.2.1

Python code:

import pandas as pd 
import pickle
from sklearn.ensemble import ExtraTreesRegressor
from sklearn.preprocessing import LabelEncoder
bike = pd.read_csv('https://raw.githubusercontent.com/christophM/interpretable-ml-book/master/data/bike.csv', delimiter=",")
bike_Y = bike[['cnt']]
bike_X = pd.get_dummies(bike[['season', 'yr', 'mnth', 'holiday',
       'weekday', 'workingday', 'weathersit', 'temp',
       'hum', 'windspeed', 'days_since_2011']])
       
model = ExtraTreesRegressor(
  n_estimators= 50,
  max_depth=4, 
  min_samples_split = 12
)
model = model.fit(bike_X, bike_Y.values.ravel())
pickle.dump(model, open("scikitlearn.pkl", "wb"))

then running the explainer:

explainer <- explain_scikitlearn(system.file("extdata", "scikitlearn.pkl", package = "DALEXtra"), 
                                 condaenv = "r-reticulate",
data = bike_x[,1:27], y = bike$cnt, colorize = FALSE, type="regression")

Which results in the followig error:

Error in py_get_attr_impl(x, name, silent) : AttributeError: 'GradientBoostingClassifier' object has no attribute 'ccp_alpha'

The Issue seems to be within model_info:

model_info(py$model)
Package: Model of class: sklearn.ensemble._forest.ExtraTreesRegressor package unrecognized 
 Package: Model of class: sklearn.ensemble._forest.ForestRegressor package unrecognized 
 Package: Model of class: sklearn.base.RegressorMixin package unrecognized 
 Package: Model of class: sklearn.ensemble._forest.BaseForest package unrecognized 
 Package: Model of class: sklearn.base.MultiOutputMixin package unrecognized 
 Package: Model of class: sklearn.ensemble._base.BaseEnsemble package unrecognized 
 Package: Model of class: sklearn.base.MetaEstimatorMixin package unrecognized 
 Package: Model of class: sklearn.base.BaseEstimator package unrecognized 
 Package: Model of class: python.builtin.object package unrecognized 
Package version: Unknown 
Task type: regression ...site-packages\sklearn\base.py:318: UserWarning: Trying to unpickle estimator DummyClassifier from version 0.21.2 when using version 0.22.2.post1. This might lead to breaking code or invalid results. Use at your own risk.UserWarning)

That's the version info from sklearn:

System:
    python: 3.6.10 (default, Mar  5 2020, 10:17:47) [MSC v.1900 64 bit (AMD64)]
executable: C:\Program Files\RStudio\bin\rsession.exe
   machine: Windows-10-10.0.18362-SP0

Python dependencies:
       pip: 20.0.2
setuptools: 46.1.3.post20200330
   sklearn: 0.22.2.post1
     numpy: 1.18.1
     scipy: 1.4.1
    Cython: None
    pandas: 1.0.3
matplotlib: None
    joblib: 0.14.1

Built with OpenMP: True`
``

Creating the explainer: predict_function returns an error when executed

Hello!

This is my first time using Dalextra and I am struggling creating an explainer. I have a tensorflow/keras regression model created in python that I load into R. I create the explainer like this:
explmod = explain_keras('model2.p', yml = "/home/user/environment.yml", predict_function = yhat, type = 'regression', condaenv = '/home/user/anaconda3/', data = train_x,y = train_y)

I have tried predict_function = predict' and yhat` and also leaving it empty. In any case, my output is like this:

`Preparation of a new explainer is initiated

-> model label : keras ( default )

-> data : 175200 rows 96 cols

-> target variable : 175200 values

-> predict function : predict_function

-> predicted values : the predict_function returns an error when executed ( WARNING )

-> model_info : package reticulate , ver. 1.18 , task classification ( default )

-> model_info : type set to regression

-> residual function : difference between y and yhat ( default )

-> residuals : the residual_function returns an error when executed ( WARNING )

A new explainer has been created!`

If I call predict() or yhat() separately, they work and can predict, though. Can anyone tell me what I'm doing wrong?
Thanks in advance!

Edit:
So by now I have found out that the pickle function I used was suboptimal, I also noticed that the explainer recognized a classification task instead of a regression. After using a different pickle funcion, the explainer correctly idenifies regression, but the prediction function still throws an error.
Is it possible that the dimensions of the x and y variables matter? Normally,the x-variable is 3d and the y-variable is 2d. I also tried a 3d and a 1d y-variable, but neither works.

Can DALEXtra even handle lstms?

Xgboost with sparse matrices

Using the explain_xgboost function with a sparse matrix created by sparse.model.matrix(), yilelds the warning

Preparation of a new explainer is initiated
-> model label : xgb.Booster ( default )
-> data : 33889 rows 87 cols
-> target variable : 33889 values
-> predict function : yhat.xgb.Booster will be used ( default )
-> predicted values : the predict_function returns an error when executed ( WARNING )
Error in strsplit(model$params$objective, ":", fixed = TRUE) :
non-character argument

Then when inserting the explainer into model_profile yields the error message:

Error in if (X.model$params$objective == "multi:softprob") { :
argument is of length zero

Are you familiar with the problem, and/or have a solution?

Possible to move reticulate to Suggests?

Hello! 👋 Thanks so much for all your great work on this package.

I wanted to ask if you all would be open to moving reticulate to Suggests. This is motivated in particular by how Posit Connect sets up environments for content that requires reticulate (installs Python and tried to create an environment), but I think this will come into play on other deployment targets as well. The idea here is that if you are using tidymodels, you don't need Python and reticulate installed, but if you are using a model like keras, you already have Python and reticulate from dealing with the model itself.

I took a look at how you are using reticulate, and I think you could move reticulate to Suggests if you wrapped calls in rlang::is_installed() or used a base R equivalent. For example, your .onLoad() could become:

# Check if conda is present. If not, warning will be raised.

.onAttach <- function(libname, pkgname) {
  if (rlang::is_installed("reticulate")) {
      is_conda <- try(reticulate::conda_binary(), silent = TRUE)
      if(inherits(is_conda, "try-error")) {
        packageStartupMessage("Anaconda not found on your computer. Conda related functionality such as create_env.R and condaenv and yml parameters from explain_scikitlearn will not be available")
      }
  }
}

What would you think about a change like this?

plot() gives result for ALL target classes, we need only 1

In a multiclass usecase, one needs BreakDown profile for only one target class, however plot() produces profiles for ALL target classes. How to control plot() to show only required target class result. Here is a dummy code similar to my actual usecase. I need to see BD plot for "DF lrnr exp.alpha" only and two other should not be shown. This kind of selection is needed where number of target classes and/or number of variables is large. Here is the dummy code:
library(DALEX) library(DALEXtra) library(tidyverse) library("mlr3verse") df=data.frame(w=c(34,65,23,78,37, 34,65,23,78,37, 34,65,23,78,37, 34,65,23,78,37), x=c('a','b','a','c','c', 'a','b','a','c','c', 'a','b','a','c','c', 'a','b','a','c','c'), y=c(TRUE,FALSE,TRUE,TRUE,FALSE, TRUE,FALSE,TRUE,TRUE,FALSE, TRUE,FALSE,TRUE,TRUE,FALSE, TRUE,FALSE,TRUE,TRUE,FALSE), z=c('alpha','alpha','delta','delta','phi', 'alpha','alpha','delta','delta','phi', 'alpha','alpha','delta','delta','phi', 'alpha','alpha','delta','delta','phi') ) df_task <- TaskClassif$new(id = "my_df", backend = df, target = "z") df_lrn <- lrn("classif.rpart", predict_type = "prob") df_lrn$train(df_task) df_lrn_exp <- explain_mlr3(df_lrn, data = df[,-4], y = df$z, label = "DF lrnr exp") df_BD <- predict_parts(df_lrn_exp, df[3,], type='break_down') plot(df_BD, max_features = 5, add_contributions = T)

Release DALEXtra v2.2.0 to CRAN

There were a lot of changes to DALEXtra recently. After they are at least partially reviewed by people requesting the new features, we should send DALEXtra v2.2.0 to CRAN.

H2O multiclass error

Hello,

I am not sure if this is an error but when I am using -following- default yhat function

`
"H2OMultinomialModel" = {
if (!inherits(newdata, "H2OFrame")) {
newdata <- h2o::as.h2o(newdata)
}
ret <- as.data.frame(h2o::h2o.predict(X.model, newdata = newdata))
colnames(ret) <- normalize_h2o_names(colnames(ret))

  if (!is.null(attr(X.model, "predict_function_target_column"))) {
    return(ret[,attr(X.model, "predict_function_target_column")])
  }

  ret[,-1]

}`

With this prediction function, predict_parts function gives an error related to dimensions.

So I checked yhatranger source code which returns a matrix. So I made the following custom yhat function, and now predict_parts works normally.

`new_custom <- function(X.model, newdata)
{

if (!inherits(newdata, "H2OFrame")) {
  newdata <- h2o::as.h2o(newdata)
}
ret <- as.data.frame(h2o::h2o.predict(X.model, newdata = newdata))
colnames(ret) <- normalize_h2o_names(colnames(ret))

if (!is.null(attr(X.model, "predict_function_target_column"))) {
  return( **as.matrix(**ret[,attr(X.model, "predict_function_target_column")]))
}

**as.matrix**(ret[,-1])

}`

explain_mlr3 issues: NA in residual in for explain

Maybe I am not invoking the explain_mlr3 properly. Hope someone can advice. I have used explain on caret models before, first time I am using with mlr3. Below is the reprex. mlr3 is from a dev tree version (bug fixed to work with the source version of lightgbm https://lightgbm.readthedocs.io/en/latest/R/index.html). But I am hoping none of that is relevant and the problem is just the way explain with mlr3 is invoked differently than explain with caret models.

library(mlr3verse)
#> Loading required package: mlr3
# devtools::install_github("mlr-org/mlr3extralearners", ref = "reshape")
library(mlr3extralearners)
library(mlr3hyperband)
#> Loading required package: mlr3tuning
#> Loading required package: paradox
# this is the source version of lightgbm as well
library(lightgbm)
library(DALEXtra)
#> Loading required package: DALEX
#> Welcome to DALEX (version: 2.4.2).
#> Find examples and detailed introduction at: http://ema.drwhy.ai/
#> Anaconda not found on your computer. Conda related functionality such as create_env.R and condaenv and yml parameters from explain_scikitlearn will not be available
library(tidyext)
library(dplyr)
#> 
#> Attaching package: 'dplyr'
#> The following object is masked from 'package:DALEX':
#> 
#>     explain
#> The following object is masked from 'package:lightgbm':
#> 
#>     slice
#> The following objects are masked from 'package:stats':
#> 
#>     filter, lag
#> The following objects are masked from 'package:base':
#> 
#>     intersect, setdiff, setequal, union

titanic_imputed$survived <- as.factor(titanic_imputed$survived)
num_classes <- length(unique(titanic_imputed$survived))
df <- onehot(titanic_imputed,
  var = c("gender", "class", "embarked"),
  keep.original = FALSE
)

task_classif <- as_task_classif(
  x = df,
  target = "survived"
)
learner_classif <- lrn(
  seed = 101L,
  "classif.lightgbm",
  objective = "binary",
  metric = "binary_logloss",
  device_type = "cpu",
  predict_type = "prob",
  learning_rate = to_tune(1e-04, 1e-1, logscale = TRUE),
  num_iterations = to_tune(p_int(50, 100, tag = "budget")),
  max_bin = 63L,
  num_leaves = 255L,
  tree_learner = "serial",
  min_data_in_leaf = 1L,
  min_sum_hessian_in_leaf = 100,
  num_threads = 32L
)
resample_classif <- rsmp("repeated_cv", repeats = 5, folds = 10)

print(task_classif)
#> <TaskClassif:df> (2207 x 18)
#> * Target: survived
#> * Properties: twoclass
#> * Features (17):
#>   - dbl (17): age, class_1st, class_2nd, class_3rd, class_deck.crew,
#>     class_engineering.crew, class_restaurant.staff,
#>     class_victualling.crew, embarked_Belfast, embarked_Cherbourg,
#>     embarked_Queenstown, embarked_Southampton, fare, gender_female,
#>     gender_male, parch, sibsp
print(learner_classif)
#> <LearnerClassifLightGBM:classif.lightgbm>: Gradient Boosting
#> * Model: -
#> * Parameters: num_threads=32, verbose=-1, convert_categorical=TRUE,
#>   seed=101, objective=binary, metric=binary_logloss, device_type=cpu,
#>   learning_rate=<RangeTuneToken>, num_iterations=<ObjectTuneToken>,
#>   max_bin=63, num_leaves=255, tree_learner=serial, min_data_in_leaf=1,
#>   min_sum_hessian_in_leaf=100
#> * Packages: mlr3, mlr3extralearners, lightgbm
#> * Predict Type: prob
#> * Feature types: numeric, integer, factor, logical
#> * Properties: importance, missings, multiclass, twoclass, weights
print(resample_classif)
#> <ResamplingRepeatedCV>: Repeated Cross-Validation
#> * Iterations: 50
#> * Instantiated: FALSE
#> * Parameters: repeats=5, folds=10

df_tuned <- tune(
  method = "hyperband",
  term_evals = 2,
  task = task_classif,
  learner = learner_classif,
  resampling = resample_classif,
  measure = msr("classif.ce"),
)
#> INFO  [13:16:17.437] [bbotk] Starting to optimize 2 parameter(s) with '<OptimizerHyperband>' and '<TerminatorEvals> [n_evals=2, k=0]' 
#> INFO  [13:16:17.468] [bbotk] Evaluating 2 configuration(s) 
#> INFO  [13:16:17.577] [mlr3] Running benchmark with 100 resampling iterations 
#> INFO  [13:16:17.618] [mlr3] Applying learner 'classif.lightgbm' on task 'df' (iter 12/50) 
#> INFO  [13:16:17.743] [mlr3] Applying learner 'classif.lightgbm' on task 'df' (iter 44/50) 
#> INFO  [13:16:17.926] [mlr3] Applying learner 'classif.lightgbm' on task 'df' (iter 34/50) 
#> INFO  [13:16:17.985] [mlr3] Applying learner 'classif.lightgbm' on task 'df' (iter 28/50) 
#> INFO  [13:16:18.050] [mlr3] Applying learner 'classif.lightgbm' on task 'df' (iter 49/50) 
#> INFO  [13:16:18.110] [mlr3] Applying learner 'classif.lightgbm' on task 'df' (iter 43/50) 
#> INFO  [13:16:18.166] [mlr3] Applying learner 'classif.lightgbm' on task 'df' (iter 33/50) 
#> INFO  [13:16:18.225] [mlr3] Applying learner 'classif.lightgbm' on task 'df' (iter 38/50) 
#> INFO  [13:16:18.280] [mlr3] Applying learner 'classif.lightgbm' on task 'df' (iter 22/50) 
#> INFO  [13:16:18.338] [mlr3] Applying learner 'classif.lightgbm' on task 'df' (iter 32/50) 
#> INFO  [13:16:18.412] [mlr3] Applying learner 'classif.lightgbm' on task 'df' (iter 4/50) 
#> INFO  [13:16:18.473] [mlr3] Applying learner 'classif.lightgbm' on task 'df' (iter 8/50) 
#> INFO  [13:16:18.529] [mlr3] Applying learner 'classif.lightgbm' on task 'df' (iter 17/50) 
#> INFO  [13:16:18.587] [mlr3] Applying learner 'classif.lightgbm' on task 'df' (iter 42/50) 
#> INFO  [13:16:18.647] [mlr3] Applying learner 'classif.lightgbm' on task 'df' (iter 41/50) 
#> INFO  [13:16:18.734] [mlr3] Applying learner 'classif.lightgbm' on task 'df' (iter 8/50) 
#> INFO  [13:16:18.786] [mlr3] Applying learner 'classif.lightgbm' on task 'df' (iter 12/50) 
#> INFO  [13:16:18.857] [mlr3] Applying learner 'classif.lightgbm' on task 'df' (iter 44/50) 
#> INFO  [13:16:18.908] [mlr3] Applying learner 'classif.lightgbm' on task 'df' (iter 41/50) 
#> INFO  [13:16:18.974] [mlr3] Applying learner 'classif.lightgbm' on task 'df' (iter 3/50) 
#> INFO  [13:16:19.043] [mlr3] Applying learner 'classif.lightgbm' on task 'df' (iter 30/50) 
#> INFO  [13:16:19.107] [mlr3] Applying learner 'classif.lightgbm' on task 'df' (iter 45/50) 
#> INFO  [13:16:19.165] [mlr3] Applying learner 'classif.lightgbm' on task 'df' (iter 38/50) 
#> INFO  [13:16:19.226] [mlr3] Applying learner 'classif.lightgbm' on task 'df' (iter 23/50) 
#> INFO  [13:16:19.307] [mlr3] Applying learner 'classif.lightgbm' on task 'df' (iter 15/50) 
#> INFO  [13:16:19.368] [mlr3] Applying learner 'classif.lightgbm' on task 'df' (iter 43/50) 
#> INFO  [13:16:19.519] [mlr3] Applying learner 'classif.lightgbm' on task 'df' (iter 29/50) 
#> INFO  [13:16:19.578] [mlr3] Applying learner 'classif.lightgbm' on task 'df' (iter 46/50) 
#> INFO  [13:16:19.636] [mlr3] Applying learner 'classif.lightgbm' on task 'df' (iter 20/50) 
#> INFO  [13:16:19.695] [mlr3] Applying learner 'classif.lightgbm' on task 'df' (iter 40/50) 
#> INFO  [13:16:19.766] [mlr3] Applying learner 'classif.lightgbm' on task 'df' (iter 19/50) 
#> INFO  [13:16:19.834] [mlr3] Applying learner 'classif.lightgbm' on task 'df' (iter 21/50) 
#> INFO  [13:16:19.894] [mlr3] Applying learner 'classif.lightgbm' on task 'df' (iter 15/50) 
#> INFO  [13:16:19.951] [mlr3] Applying learner 'classif.lightgbm' on task 'df' (iter 27/50) 
#> INFO  [13:16:20.002] [mlr3] Applying learner 'classif.lightgbm' on task 'df' (iter 48/50) 
#> INFO  [13:16:20.126] [mlr3] Applying learner 'classif.lightgbm' on task 'df' (iter 5/50) 
#> INFO  [13:16:20.192] [mlr3] Applying learner 'classif.lightgbm' on task 'df' (iter 48/50) 
#> INFO  [13:16:20.247] [mlr3] Applying learner 'classif.lightgbm' on task 'df' (iter 25/50) 
#> INFO  [13:16:20.314] [mlr3] Applying learner 'classif.lightgbm' on task 'df' (iter 49/50) 
#> INFO  [13:16:20.379] [mlr3] Applying learner 'classif.lightgbm' on task 'df' (iter 36/50) 
#> INFO  [13:16:20.445] [mlr3] Applying learner 'classif.lightgbm' on task 'df' (iter 31/50) 
#> INFO  [13:16:20.507] [mlr3] Applying learner 'classif.lightgbm' on task 'df' (iter 16/50) 
#> INFO  [13:16:20.745] [mlr3] Applying learner 'classif.lightgbm' on task 'df' (iter 13/50) 
#> INFO  [13:16:20.798] [mlr3] Applying learner 'classif.lightgbm' on task 'df' (iter 26/50) 
#> INFO  [13:16:20.885] [mlr3] Applying learner 'classif.lightgbm' on task 'df' (iter 47/50) 
#> INFO  [13:16:20.943] [mlr3] Applying learner 'classif.lightgbm' on task 'df' (iter 16/50) 
#> INFO  [13:16:21.041] [mlr3] Applying learner 'classif.lightgbm' on task 'df' (iter 40/50) 
#> INFO  [13:16:21.111] [mlr3] Applying learner 'classif.lightgbm' on task 'df' (iter 39/50) 
#> INFO  [13:16:21.166] [mlr3] Applying learner 'classif.lightgbm' on task 'df' (iter 35/50) 
#> INFO  [13:16:21.228] [mlr3] Applying learner 'classif.lightgbm' on task 'df' (iter 11/50) 
#> INFO  [13:16:21.481] [mlr3] Applying learner 'classif.lightgbm' on task 'df' (iter 26/50) 
#> INFO  [13:16:21.551] [mlr3] Applying learner 'classif.lightgbm' on task 'df' (iter 17/50) 
#> INFO  [13:16:21.612] [mlr3] Applying learner 'classif.lightgbm' on task 'df' (iter 14/50) 
#> INFO  [13:16:21.670] [mlr3] Applying learner 'classif.lightgbm' on task 'df' (iter 23/50) 
#> INFO  [13:16:21.885] [mlr3] Applying learner 'classif.lightgbm' on task 'df' (iter 32/50) 
#> INFO  [13:16:21.951] [mlr3] Applying learner 'classif.lightgbm' on task 'df' (iter 50/50) 
#> INFO  [13:16:22.448] [mlr3] Applying learner 'classif.lightgbm' on task 'df' (iter 18/50) 
#> INFO  [13:16:22.511] [mlr3] Applying learner 'classif.lightgbm' on task 'df' (iter 47/50) 
#> INFO  [13:16:22.900] [mlr3] Applying learner 'classif.lightgbm' on task 'df' (iter 25/50) 
#> INFO  [13:16:23.124] [mlr3] Applying learner 'classif.lightgbm' on task 'df' (iter 21/50) 
#> INFO  [13:16:23.275] [mlr3] Applying learner 'classif.lightgbm' on task 'df' (iter 5/50) 
#> INFO  [13:16:23.443] [mlr3] Applying learner 'classif.lightgbm' on task 'df' (iter 14/50) 
#> INFO  [13:16:23.535] [mlr3] Applying learner 'classif.lightgbm' on task 'df' (iter 20/50) 
#> INFO  [13:16:23.610] [mlr3] Applying learner 'classif.lightgbm' on task 'df' (iter 10/50) 
#> INFO  [13:16:23.685] [mlr3] Applying learner 'classif.lightgbm' on task 'df' (iter 50/50) 
#> INFO  [13:16:24.375] [mlr3] Applying learner 'classif.lightgbm' on task 'df' (iter 2/50) 
#> INFO  [13:16:24.444] [mlr3] Applying learner 'classif.lightgbm' on task 'df' (iter 28/50) 
#> INFO  [13:16:24.510] [mlr3] Applying learner 'classif.lightgbm' on task 'df' (iter 24/50) 
#> INFO  [13:16:24.577] [mlr3] Applying learner 'classif.lightgbm' on task 'df' (iter 4/50) 
#> INFO  [13:16:24.650] [mlr3] Applying learner 'classif.lightgbm' on task 'df' (iter 45/50) 
#> INFO  [13:16:24.986] [mlr3] Applying learner 'classif.lightgbm' on task 'df' (iter 42/50) 
#> INFO  [13:16:25.056] [mlr3] Applying learner 'classif.lightgbm' on task 'df' (iter 46/50) 
#> INFO  [13:16:25.150] [mlr3] Applying learner 'classif.lightgbm' on task 'df' (iter 30/50) 
#> INFO  [13:16:25.214] [mlr3] Applying learner 'classif.lightgbm' on task 'df' (iter 1/50) 
#> INFO  [13:16:25.283] [mlr3] Applying learner 'classif.lightgbm' on task 'df' (iter 29/50) 
#> INFO  [13:16:25.471] [mlr3] Applying learner 'classif.lightgbm' on task 'df' (iter 34/50) 
#> INFO  [13:16:25.532] [mlr3] Applying learner 'classif.lightgbm' on task 'df' (iter 1/50) 
#> INFO  [13:16:25.596] [mlr3] Applying learner 'classif.lightgbm' on task 'df' (iter 33/50) 
#> INFO  [13:16:25.667] [mlr3] Applying learner 'classif.lightgbm' on task 'df' (iter 9/50) 
#> INFO  [13:16:25.758] [mlr3] Applying learner 'classif.lightgbm' on task 'df' (iter 19/50) 
#> INFO  [13:16:25.822] [mlr3] Applying learner 'classif.lightgbm' on task 'df' (iter 37/50) 
#> INFO  [13:16:25.895] [mlr3] Applying learner 'classif.lightgbm' on task 'df' (iter 35/50) 
#> INFO  [13:16:25.986] [mlr3] Applying learner 'classif.lightgbm' on task 'df' (iter 6/50) 
#> INFO  [13:16:26.250] [mlr3] Applying learner 'classif.lightgbm' on task 'df' (iter 31/50) 
#> INFO  [13:16:26.321] [mlr3] Applying learner 'classif.lightgbm' on task 'df' (iter 13/50) 
#> INFO  [13:16:26.462] [mlr3] Applying learner 'classif.lightgbm' on task 'df' (iter 9/50) 
#> INFO  [13:16:26.523] [mlr3] Applying learner 'classif.lightgbm' on task 'df' (iter 37/50) 
#> INFO  [13:16:26.704] [mlr3] Applying learner 'classif.lightgbm' on task 'df' (iter 7/50) 
#> INFO  [13:16:26.981] [mlr3] Applying learner 'classif.lightgbm' on task 'df' (iter 36/50) 
#> INFO  [13:16:27.056] [mlr3] Applying learner 'classif.lightgbm' on task 'df' (iter 27/50) 
#> INFO  [13:16:27.239] [mlr3] Applying learner 'classif.lightgbm' on task 'df' (iter 10/50) 
#> INFO  [13:16:27.304] [mlr3] Applying learner 'classif.lightgbm' on task 'df' (iter 24/50) 
#> INFO  [13:16:27.366] [mlr3] Applying learner 'classif.lightgbm' on task 'df' (iter 18/50) 
#> INFO  [13:16:27.684] [mlr3] Applying learner 'classif.lightgbm' on task 'df' (iter 6/50) 
#> INFO  [13:16:27.746] [mlr3] Applying learner 'classif.lightgbm' on task 'df' (iter 2/50) 
#> INFO  [13:16:27.816] [mlr3] Applying learner 'classif.lightgbm' on task 'df' (iter 39/50) 
#> INFO  [13:16:28.063] [mlr3] Applying learner 'classif.lightgbm' on task 'df' (iter 22/50) 
#> INFO  [13:16:28.126] [mlr3] Applying learner 'classif.lightgbm' on task 'df' (iter 11/50) 
#> INFO  [13:16:28.233] [mlr3] Applying learner 'classif.lightgbm' on task 'df' (iter 3/50) 
#> INFO  [13:16:28.287] [mlr3] Applying learner 'classif.lightgbm' on task 'df' (iter 7/50) 
#> INFO  [13:16:28.359] [mlr3] Finished benchmark 
#> INFO  [13:16:28.520] [bbotk] Result of batch 1: 
#> INFO  [13:16:28.523] [bbotk]  learning_rate num_iterations stage bracket repetition classif.ce warnings 
#> INFO  [13:16:28.523] [bbotk]      -8.748948             50     0       1          1  0.3221633        0 
#> INFO  [13:16:28.523] [bbotk]      -6.578076             50     0       1          1  0.3221633        0 
#> INFO  [13:16:28.523] [bbotk]  errors runtime_learners                                uhash 
#> INFO  [13:16:28.523] [bbotk]       0            5.051 09758a1d-4f45-490b-87f6-6f36e0a0b7d6 
#> INFO  [13:16:28.523] [bbotk]       0            4.807 50b198ea-0b2a-419f-8703-d0cb215d1d54 
#> INFO  [13:16:28.532] [bbotk] Finished optimizing after 2 evaluation(s) 
#> INFO  [13:16:28.533] [bbotk] Result: 
#> INFO  [13:16:28.534] [bbotk]  learning_rate num_iterations learner_param_vals  x_domain classif.ce 
#> INFO  [13:16:28.534] [bbotk]      -8.748948             50         <list[14]> <list[2]>  0.3221633

df_tuned$result
#>    learning_rate num_iterations learner_param_vals  x_domain classif.ce
#> 1:     -8.748948             50         <list[14]> <list[2]>  0.3221633

learner_classif_final <- lrn(
  seed = 101L,
  "classif.lightgbm",
  objective = "binary",
  metric = "binary_logloss",
  device_type = "gpu",
  gpu_platform_id = 0L,
  gpu_device_id = 1L,
  predict_type = "prob",
  learning_rate = exp(df_tuned$result$learning_rate),
  num_iterations = df_tuned$result$num_iterations,
  max_bin = 63L,
  num_leaves = 255L,
  tree_learner = "serial",
  min_data_in_leaf = 1L,
  min_sum_hessian_in_leaf = 100,
  num_threads = 32L
)
learner_classif_final$train(task_classif)

pred <- learner_classif_final$train(task_classif)$predict(task_classif)

pred$score(msrs(c("classif.ce", "classif.fbeta")))
#>    classif.ce classif.fbeta 
#>     0.3221568     0.8079935
pred$confusion
#>         truth
#> response    0    1
#>        0 1496  711
#>        1    0    0

exp_mlr3 <- explain_mlr3(learner_classif_final,
  data = select(df, -"survived"),
  y = df$survived,
  label = "LGBM"
)
#> Preparation of a new explainer is initiated
#>   -> model label       :  LGBM 
#>   -> data              :  2207  rows  17  cols 
#>   -> target variable   :  2207  values 
#>   -> predict function  :  yhat.LearnerClassif  will be used (  default  )
#>   -> predicted values  :  No value for predict function target column. (  default  )
#>   -> model_info        :  package mlr3 , ver. 0.13.3 , task classification (  default  ) 
#>   -> model_info        :  Model info detected classification task but 'y' is a factor .  (  WARNING  )
#>   -> model_info        :  By deafult classification tasks supports only numercical 'y' parameter. 
#>   -> model_info        :  Consider changing to numerical vector with 0 and 1 values.
#>   -> model_info        :  Otherwise I will not be able to calculate residuals or loss function.
#>   -> predicted values  :  numerical, min =  0.3208135 , mean =  0.3221568 , max =  0.325412  
#>   -> residual function :  difference between y and yhat (  default  )
#> Warning in Ops.factor(y, predict_function(model, data)): '-' not meaningful for
#> factors
#>   -> residuals         :  numerical, min =  NA , mean =  NA , max =  NA  
#>   A new explainer has been created!

vic <- feature_importance(exp_mlr3)
#> Error in Summary.factor(structure(c(1L, 1L, 1L, 2L, 1L, 1L, 1L, 1L, 2L, : 'sum' not meaningful for factors

Created on 2022-07-17 by the reprex package (v2.0.1)

Session info
sessioninfo::session_info()
#> ─ Session info ───────────────────────────────────────────────────────────────
#>  setting  value
#>  version  R version 3.6.3 (2020-02-29)
#>  os       Ubuntu 20.04.4 LTS
#>  system   x86_64, linux-gnu
#>  ui       X11
#>  language (EN)
#>  collate  en_US.UTF-8
#>  ctype    en_US.UTF-8
#>  tz       Etc/UTC
#>  date     2022-07-17
#>  pandoc   2.18 @ /usr/lib/rstudio-server/bin/quarto/bin/tools/ (via rmarkdown)
#> 
#> ─ Packages ───────────────────────────────────────────────────────────────────
#>  package           * version  date (UTC) lib source
#>  backports           1.4.1    2021-12-13 [1] CRAN (R 3.6.3)
#>  bbotk               0.5.3    2022-05-04 [1] CRAN (R 3.6.3)
#>  checkmate           2.1.0    2022-04-21 [1] CRAN (R 3.6.3)
#>  cli                 3.3.0    2022-04-25 [1] CRAN (R 3.6.3)
#>  clue                0.3-61   2022-05-30 [1] CRAN (R 3.6.3)
#>  cluster             2.1.0    2019-06-19 [4] CRAN (R 3.6.1)
#>  clusterCrit         1.2.8    2018-07-26 [1] CRAN (R 3.6.3)
#>  codetools           0.2-16   2018-12-24 [4] CRAN (R 3.5.2)
#>  colorspace          2.0-3    2022-02-21 [1] CRAN (R 3.6.3)
#>  crayon              1.5.1    2022-03-26 [1] CRAN (R 3.6.3)
#>  DALEX             * 2.4.2    2022-06-15 [1] CRAN (R 3.6.3)
#>  DALEXtra          * 2.2.1    2022-06-14 [1] CRAN (R 3.6.3)
#>  data.table          1.14.2   2021-09-27 [1] CRAN (R 3.6.3)
#>  digest              0.6.29   2021-12-01 [1] CRAN (R 3.6.3)
#>  dplyr             * 1.0.9    2022-04-28 [1] CRAN (R 3.6.3)
#>  ellipsis            0.3.2    2021-04-29 [1] CRAN (R 3.6.3)
#>  evaluate            0.15     2022-02-18 [1] CRAN (R 3.6.3)
#>  fansi               1.0.3    2022-03-24 [1] CRAN (R 3.6.3)
#>  fastmap             1.1.0    2021-01-25 [1] CRAN (R 3.6.3)
#>  fs                  1.5.2    2021-12-08 [1] CRAN (R 3.6.3)
#>  future              1.26.1   2022-05-27 [1] CRAN (R 3.6.3)
#>  future.apply        1.9.0    2022-04-25 [1] CRAN (R 3.6.3)
#>  generics            0.1.3    2022-07-05 [1] CRAN (R 3.6.3)
#>  ggplot2             3.3.6    2022-05-03 [1] CRAN (R 3.6.3)
#>  globals             0.15.1   2022-06-24 [1] CRAN (R 3.6.3)
#>  glue                1.6.2    2022-02-24 [1] CRAN (R 3.6.3)
#>  gtable              0.3.0    2019-03-25 [1] CRAN (R 3.6.3)
#>  highr               0.9      2021-04-16 [1] CRAN (R 3.6.3)
#>  htmltools           0.5.2    2021-08-25 [1] CRAN (R 3.6.3)
#>  ingredients         2.2.0    2021-04-10 [1] CRAN (R 3.6.3)
#>  jsonlite            1.8.0    2022-02-22 [1] CRAN (R 3.6.3)
#>  knitr               1.39     2022-04-26 [1] CRAN (R 3.6.3)
#>  lattice             0.20-40  2020-02-19 [4] CRAN (R 3.6.2)
#>  lgr                 0.4.3    2021-09-16 [1] CRAN (R 3.6.3)
#>  lifecycle           1.0.1    2021-09-24 [1] CRAN (R 3.6.3)
#>  lightgbm          * 3.3.2.99 2022-07-15 [1] local
#>  listenv             0.8.0    2019-12-05 [1] CRAN (R 3.6.3)
#>  magrittr            2.0.3    2022-03-30 [1] CRAN (R 3.6.3)
#>  Matrix              1.2-18   2019-11-27 [4] CRAN (R 3.6.1)
#>  mlr3              * 0.13.3   2022-03-01 [1] CRAN (R 3.6.3)
#>  mlr3cluster         0.1.3    2022-04-06 [1] CRAN (R 3.6.3)
#>  mlr3data            0.6.0    2022-03-18 [1] CRAN (R 3.6.3)
#>  mlr3extralearners * 0.5.43   2022-07-17 [1] Github (mlr-org/mlr3extralearners@d56bb48)
#>  mlr3filters         0.5.0    2022-01-25 [1] CRAN (R 3.6.3)
#>  mlr3fselect         0.7.1    2022-05-03 [1] CRAN (R 3.6.3)
#>  mlr3hyperband     * 0.4.1    2022-05-04 [1] CRAN (R 3.6.3)
#>  mlr3learners        0.5.3    2022-05-25 [1] CRAN (R 3.6.3)
#>  mlr3measures        0.4.1    2022-01-13 [1] CRAN (R 3.6.3)
#>  mlr3misc            0.10.0   2022-01-11 [1] CRAN (R 3.6.3)
#>  mlr3pipelines       0.4.1    2022-05-15 [1] CRAN (R 3.6.3)
#>  mlr3tuning        * 0.13.1   2022-05-03 [1] CRAN (R 3.6.3)
#>  mlr3tuningspaces    0.3.0    2022-06-28 [1] CRAN (R 3.6.3)
#>  mlr3verse         * 0.2.5    2022-05-18 [1] CRAN (R 3.6.3)
#>  mlr3viz             0.5.9    2022-05-25 [1] CRAN (R 3.6.3)
#>  munsell             0.5.0    2018-06-12 [1] CRAN (R 3.6.3)
#>  palmerpenguins      0.1.0    2020-07-23 [1] CRAN (R 3.6.3)
#>  paradox           * 0.9.0    2022-04-18 [1] CRAN (R 3.6.3)
#>  parallelly          1.32.0   2022-06-07 [1] CRAN (R 3.6.3)
#>  pillar              1.7.0    2022-02-01 [1] CRAN (R 3.6.3)
#>  pkgconfig           2.0.3    2019-09-22 [1] CRAN (R 3.6.3)
#>  png                 0.1-7    2013-12-03 [1] CRAN (R 3.6.3)
#>  purrr               0.3.4    2020-04-17 [1] CRAN (R 3.6.3)
#>  R.cache             0.15.0   2021-04-30 [1] CRAN (R 3.6.3)
#>  R.methodsS3         1.8.2    2022-06-13 [1] CRAN (R 3.6.3)
#>  R.oo                1.25.0   2022-06-12 [1] CRAN (R 3.6.3)
#>  R.utils             2.12.0   2022-06-28 [1] CRAN (R 3.6.3)
#>  R6                  2.5.1    2021-08-19 [1] CRAN (R 3.6.3)
#>  rappdirs            0.3.3    2021-01-31 [1] CRAN (R 3.6.3)
#>  Rcpp                1.0.9    2022-07-08 [1] CRAN (R 3.6.3)
#>  rematch2            2.1.2    2020-05-01 [1] CRAN (R 3.6.3)
#>  reprex              2.0.1    2021-08-05 [1] CRAN (R 3.6.3)
#>  reticulate          1.25     2022-05-11 [1] CRAN (R 3.6.3)
#>  rlang               1.0.4    2022-07-12 [1] CRAN (R 3.6.3)
#>  rmarkdown           2.14     2022-04-25 [1] CRAN (R 3.6.3)
#>  rstudioapi          0.13     2020-11-12 [1] CRAN (R 3.6.3)
#>  scales              1.2.0    2022-04-13 [1] CRAN (R 3.6.3)
#>  sessioninfo         1.2.2    2021-12-06 [1] CRAN (R 3.6.3)
#>  stringi             1.7.8    2022-07-11 [1] CRAN (R 3.6.3)
#>  stringr             1.4.0    2019-02-10 [1] CRAN (R 3.6.3)
#>  styler              1.7.0    2022-03-13 [1] CRAN (R 3.6.3)
#>  tibble              3.1.7    2022-05-03 [1] CRAN (R 3.6.3)
#>  tidyext           * 0.3.6    2022-07-16 [1] Github (m-clark/tidyext@87df6da)
#>  tidyr               1.2.0    2022-02-01 [1] CRAN (R 3.6.3)
#>  tidyselect          1.1.2    2022-02-21 [1] CRAN (R 3.6.3)
#>  utf8                1.2.2    2021-07-24 [1] CRAN (R 3.6.3)
#>  uuid                1.1-0    2022-04-19 [1] CRAN (R 3.6.3)
#>  vctrs               0.4.1    2022-04-13 [1] CRAN (R 3.6.3)
#>  withr               2.5.0    2022-03-03 [1] CRAN (R 3.6.3)
#>  xfun                0.31     2022-05-10 [1] CRAN (R 3.6.3)
#>  yaml                2.3.5    2022-02-21 [1] CRAN (R 3.6.3)
#> 
#>  [1] /home/sheetal/R/x86_64-pc-linux-gnu-library/3.6
#>  [2] /usr/local/lib/R/site-library
#>  [3] /usr/lib/R/site-library
#>  [4] /usr/lib/R/library
#> 
#> ──────────────────────────────────────────────────────────────────────────────

S3 methods vs dedicated functions for explain

Hi,

I have a question, just out of curiosity.

I can see that in the {DALEX} package you initially inteded to use explain as a S3 method, as explain.default suggests. It would even be compatible with the explain method in the {generics} package. However, in the {DALEXtra} package you created a set of dedicated methods such as explain_tidymodels or explain_mlr.

Why didn't you decide to create specialised explain method versions (like explain.model_fit, explain.workfkow, explain.WrappedModel etc.) in the same manner as it was done in the case of the model_info method?

I'm asking because I'd like to create a connector between {keras} for R and {DALEX}.
Personally, I'd prefer to make a S3 method for these models.

Update README and DESCRIPTION

After #19 it would be good to update README and DESCRIPTION in order to reflect new content of the package

In addition to support for mlr, h2o and scikit-learn we also need to mention champion-challenger funnel plots and aspect importance features.

h2o::h2o.init()

h2o::h2o.init() fails if there is already an h2o-instance running.

Since in most cases we do preprocessings like partitions etc. with an earlier initiated h2o-instance, and some initiations need more params for ports, logins etc., its generally a bad idea/practise to put h2o::h2o.init() hardcoded in explain_h2o().

However, there seems to be a workaround using the regular DALEX::explain() function...
http://uc-r.github.io/dalex#local

Recommend Projects

  • React photo React

    A declarative, efficient, and flexible JavaScript library for building user interfaces.

  • Vue.js photo Vue.js

    🖖 Vue.js is a progressive, incrementally-adoptable JavaScript framework for building UI on the web.

  • Typescript photo Typescript

    TypeScript is a superset of JavaScript that compiles to clean JavaScript output.

  • TensorFlow photo TensorFlow

    An Open Source Machine Learning Framework for Everyone

  • Django photo Django

    The Web framework for perfectionists with deadlines.

  • D3 photo D3

    Bring data to life with SVG, Canvas and HTML. 📊📈🎉

Recommend Topics

  • javascript

    JavaScript (JS) is a lightweight interpreted programming language with first-class functions.

  • web

    Some thing interesting about web. New door for the world.

  • server

    A server is a program made to process requests and deliver data to clients.

  • Machine learning

    Machine learning is a way of modeling and interpreting data that allows a piece of software to respond intelligently.

  • Game

    Some thing interesting about game, make everyone happy.

Recommend Org

  • Facebook photo Facebook

    We are working to build community through open source technology. NB: members must have two-factor auth.

  • Microsoft photo Microsoft

    Open source projects and samples from Microsoft.

  • Google photo Google

    Google ❤️ Open Source for everyone.

  • D3 photo D3

    Data-Driven Documents codes.