Code Monkey home page Code Monkey logo

powerbi-visuals-horizontalbarchart's Introduction

Horizontal bar chart

A horizontal bar chart that saves space by putting the category labels inside the bars

screenshot

Overview

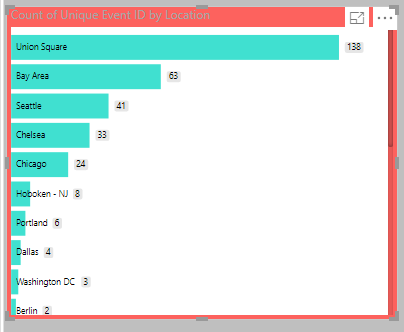
This horizontal bar chart visual can be used as a filter to slice through your data in a more meaningful fashion while saving space by putting the category labels inside the bars itself. You can add different tooltips to show next level of detail that you don’t want visible right on the first look but still is relevant to the dataset.

See also Horizontal bar chart at Microsoft AppSource

Development Workflow

npm i # installs all required modules
npm run cert # generates and installs a SSL certificate
npm start # starts debugging visual
npm run package # build a pbiviz package for Power BI

powerbi-visuals-horizontalbarchart's People

Contributors

adlele avatar astaruns avatar dependabot[bot] avatar ignatvilesov avatar masters3d avatar microsoftopensource avatar msftgits avatar uve avatar

Stargazers

 avatar  avatar  avatar  avatar  avatar  avatar  avatar  avatar  avatar  avatar  avatar  avatar  avatar  avatar  avatar  avatar

Watchers

 avatar  avatar  avatar  avatar  avatar  avatar  avatar  avatar  avatar  avatar  avatar  avatar  avatar  avatar

powerbi-visuals-horizontalbarchart's Issues

Add a disable option for the click on the bars

In order to simplify user's interraction with the report, we want to disable the possibility to click on bars.
To do so, a 'clickable" option in bar settings could be added

I have some code to push if allowed

Error during start

Hi, many thanks for your great and useful work.
I downloaded PowerBI-Visuals-HorizontalBarChart-master but when I tried to start whit pbiviz it don't work.
There are some error

ERROR Failed to compile with 3 errors 00:40:52

error in C:\Users\Giacomo\PowerBI-Visuals-HorizontalBarChart-master\src\barChart.ts

[tsl] ERROR in C:\Users\Giacomo\PowerBI-Visuals-HorizontalBarChart-master\src\barChart.ts(848,9)
TS1128: Declaration or statement expected.

error in C:\Users\Giacomo\PowerBI-Visuals-HorizontalBarChart-master\src\tooltipServiceWrapper.ts

[tsl] ERROR in C:\Users\Giacomo\PowerBI-Visuals-HorizontalBarChart-master\src\tooltipServiceWrapper.ts(3,5)
TS2305: Module '"d3-selection"' has no exported member 'event'.

error in C:\Users\Giacomo\PowerBI-Visuals-HorizontalBarChart-master\src\tooltipServiceWrapper.ts

[tsl] ERROR in C:\Users\Giacomo\PowerBI-Visuals-HorizontalBarChart-master\src\tooltipServiceWrapper.ts(5,5)
TS2305: Module '"d3-selection"' has no exported member 'touches'.
Can you help me?
Giacomo

HorizontalBarChart tooltip issue

I faced with tooltip page issue on my PowerBI desktop. When hover over bars for appearing tooltip message, there are nothing to show, just blank field
Note, tooltip settings - Page>tooltip page

tooltip page
2020-03-27_1346

ToolTip issues

The control is working fine, but the tooltip is not coming Default as well as custom. Both the tooltip does not show. Any help would be appreciated.

Plot Area White - Not Able to Update

When using the visual the Plot area is white and can not be changed. While you can update the background, it only applies to a small area that surrounds the actual graph.

In the sample available in the Sample_BarChart.pbix, it functions as expected, but when imported from the marketplace the issue with the plot area appears.

image

Chart does not update if no data is present for the value chosen in a slicer

I've found a bug in the way the visual updates in a particular circumstance. I am using it in a desktop-created Power BI report that has a live connection to a Tabular Model. When I select a value in a slicer for which there are no rows of data in my fact table the rest of the visuals on the page update to show no data, as you'd expect, but this one shows the data for the previous selection.
Sarah

Recommend Projects

  • React photo React

    A declarative, efficient, and flexible JavaScript library for building user interfaces.

  • Vue.js photo Vue.js

    🖖 Vue.js is a progressive, incrementally-adoptable JavaScript framework for building UI on the web.

  • Typescript photo Typescript

    TypeScript is a superset of JavaScript that compiles to clean JavaScript output.

  • TensorFlow photo TensorFlow

    An Open Source Machine Learning Framework for Everyone

  • Django photo Django

    The Web framework for perfectionists with deadlines.

  • D3 photo D3

    Bring data to life with SVG, Canvas and HTML. 📊📈🎉

Recommend Topics

  • javascript

    JavaScript (JS) is a lightweight interpreted programming language with first-class functions.

  • web

    Some thing interesting about web. New door for the world.

  • server

    A server is a program made to process requests and deliver data to clients.

  • Machine learning

    Machine learning is a way of modeling and interpreting data that allows a piece of software to respond intelligently.

  • Game

    Some thing interesting about game, make everyone happy.

Recommend Org

  • Facebook photo Facebook

    We are working to build community through open source technology. NB: members must have two-factor auth.

  • Microsoft photo Microsoft

    Open source projects and samples from Microsoft.

  • Google photo Google

    Google ❤️ Open Source for everyone.

  • D3 photo D3

    Data-Driven Documents codes.