![]()
The goal of flexdashboard is to make it easy to create interactive dashboards for R, using R Markdown.
-
Use R Markdown to publish a group of related data visualizations as a dashboard.
-
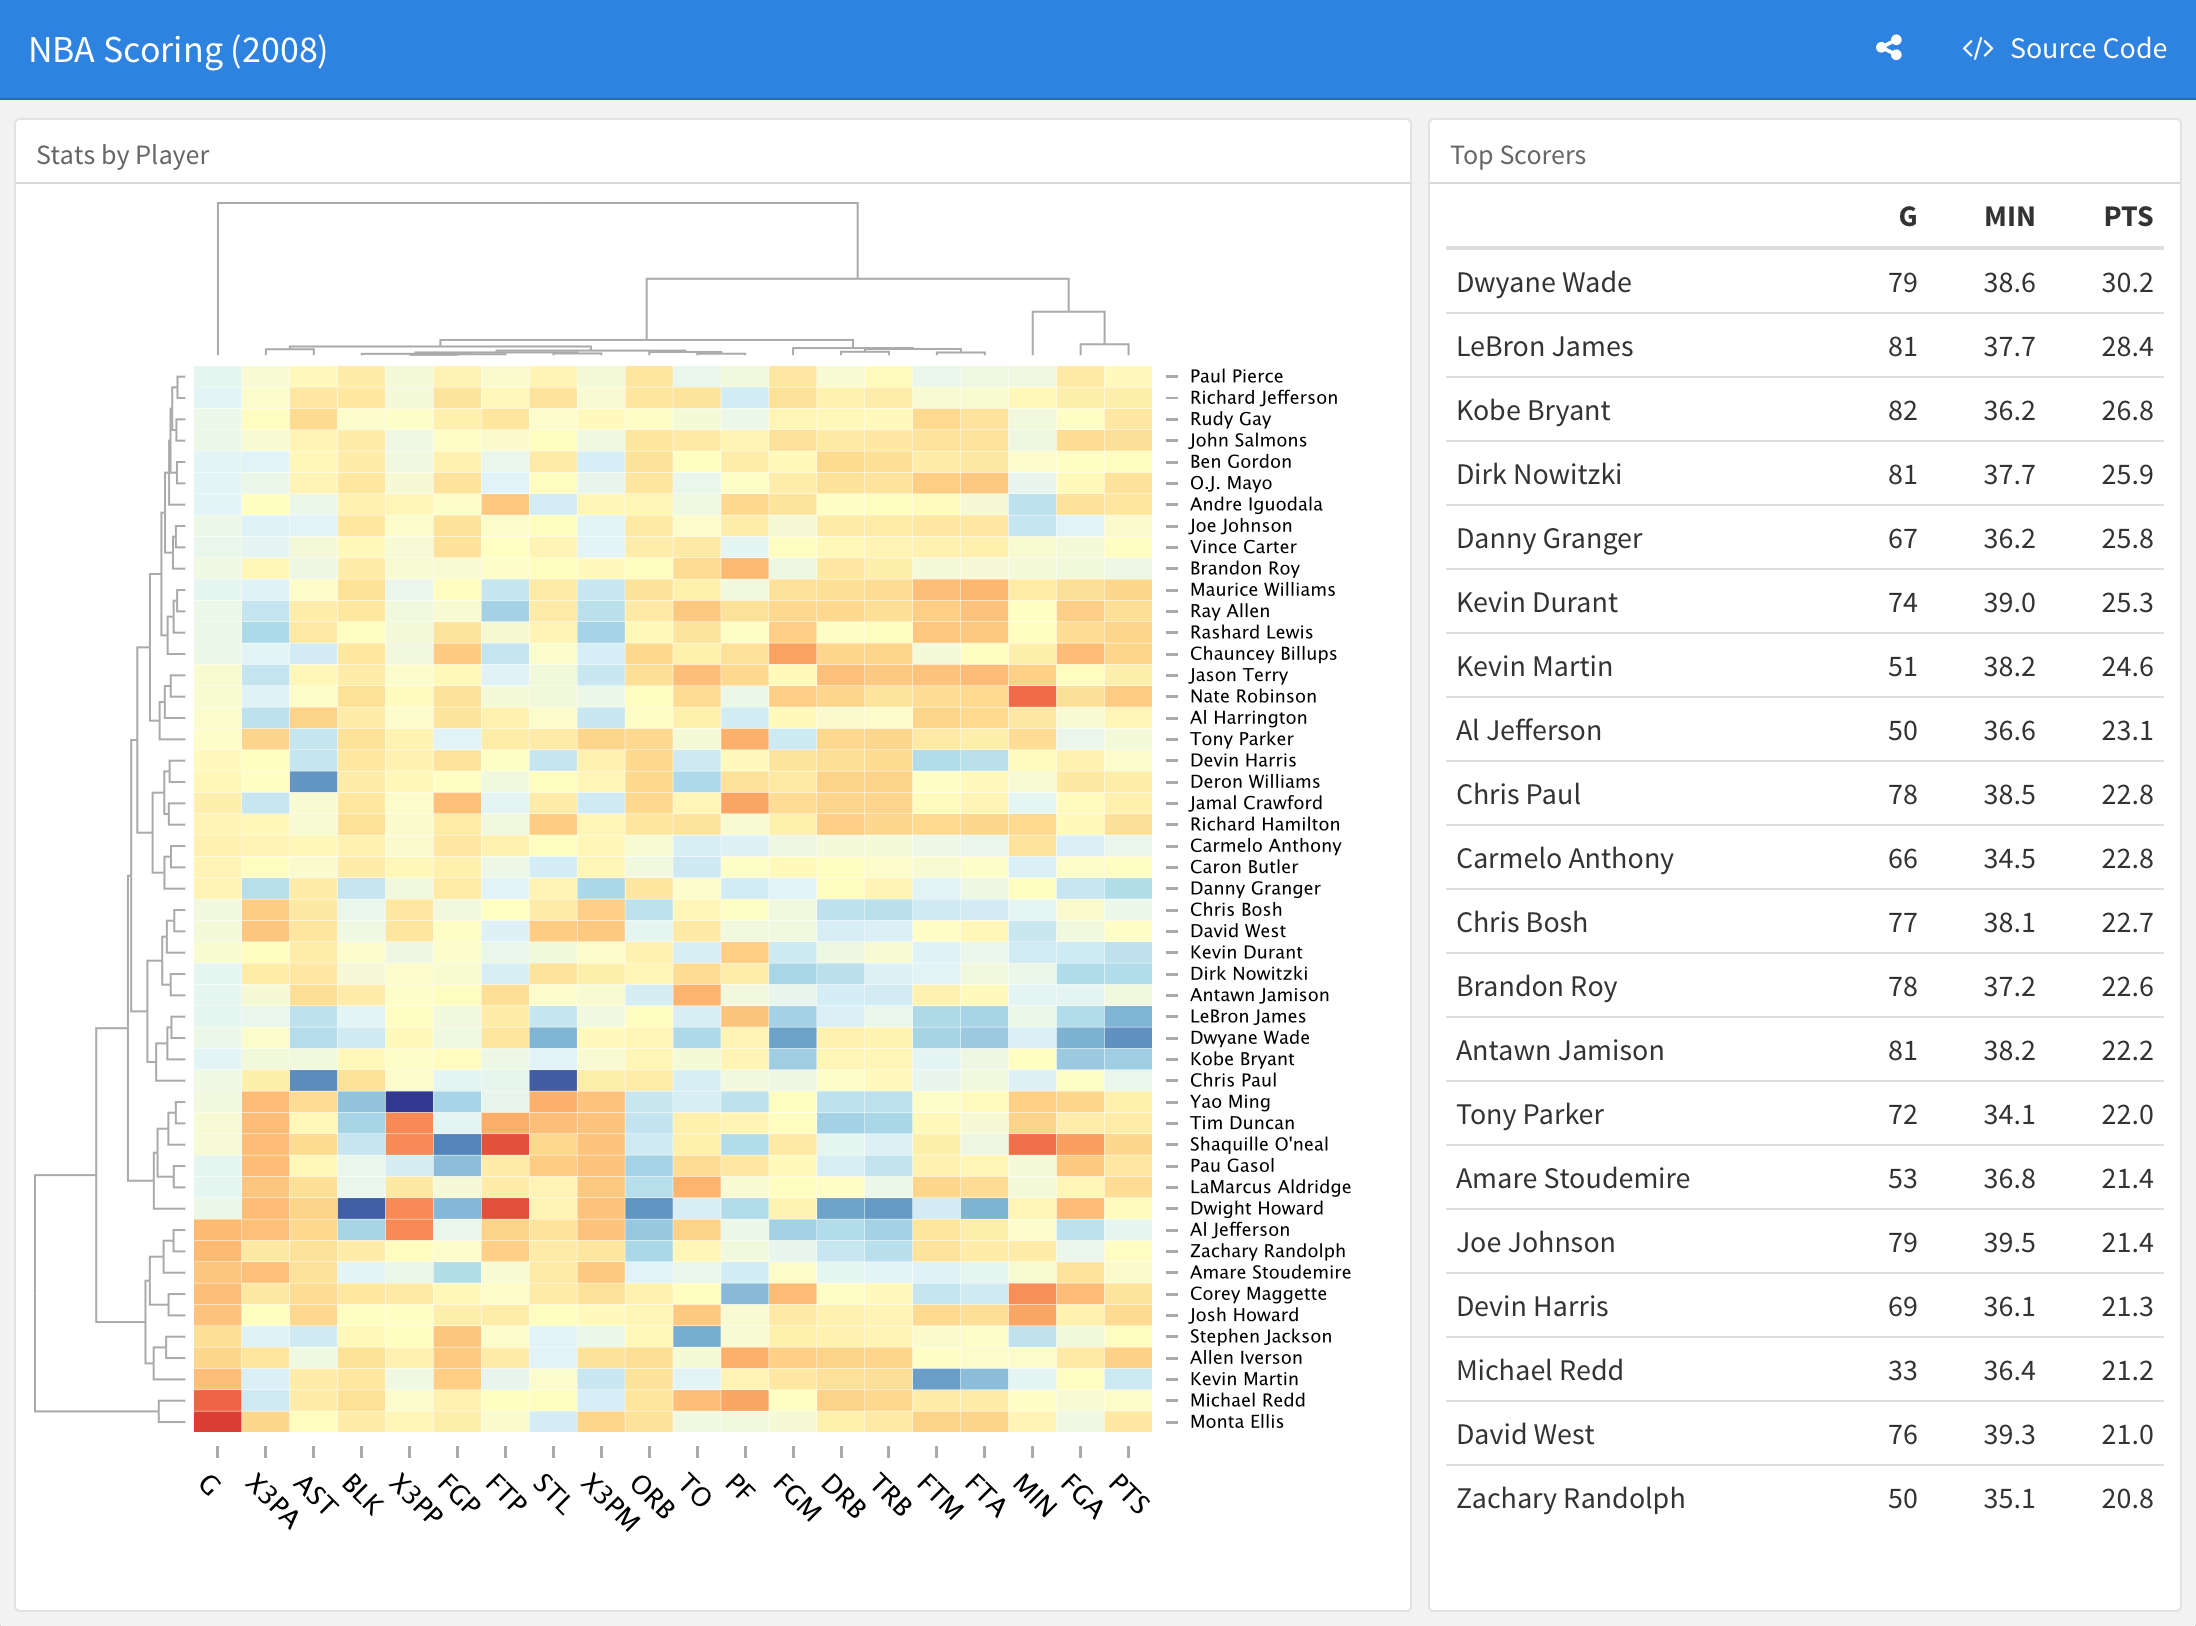
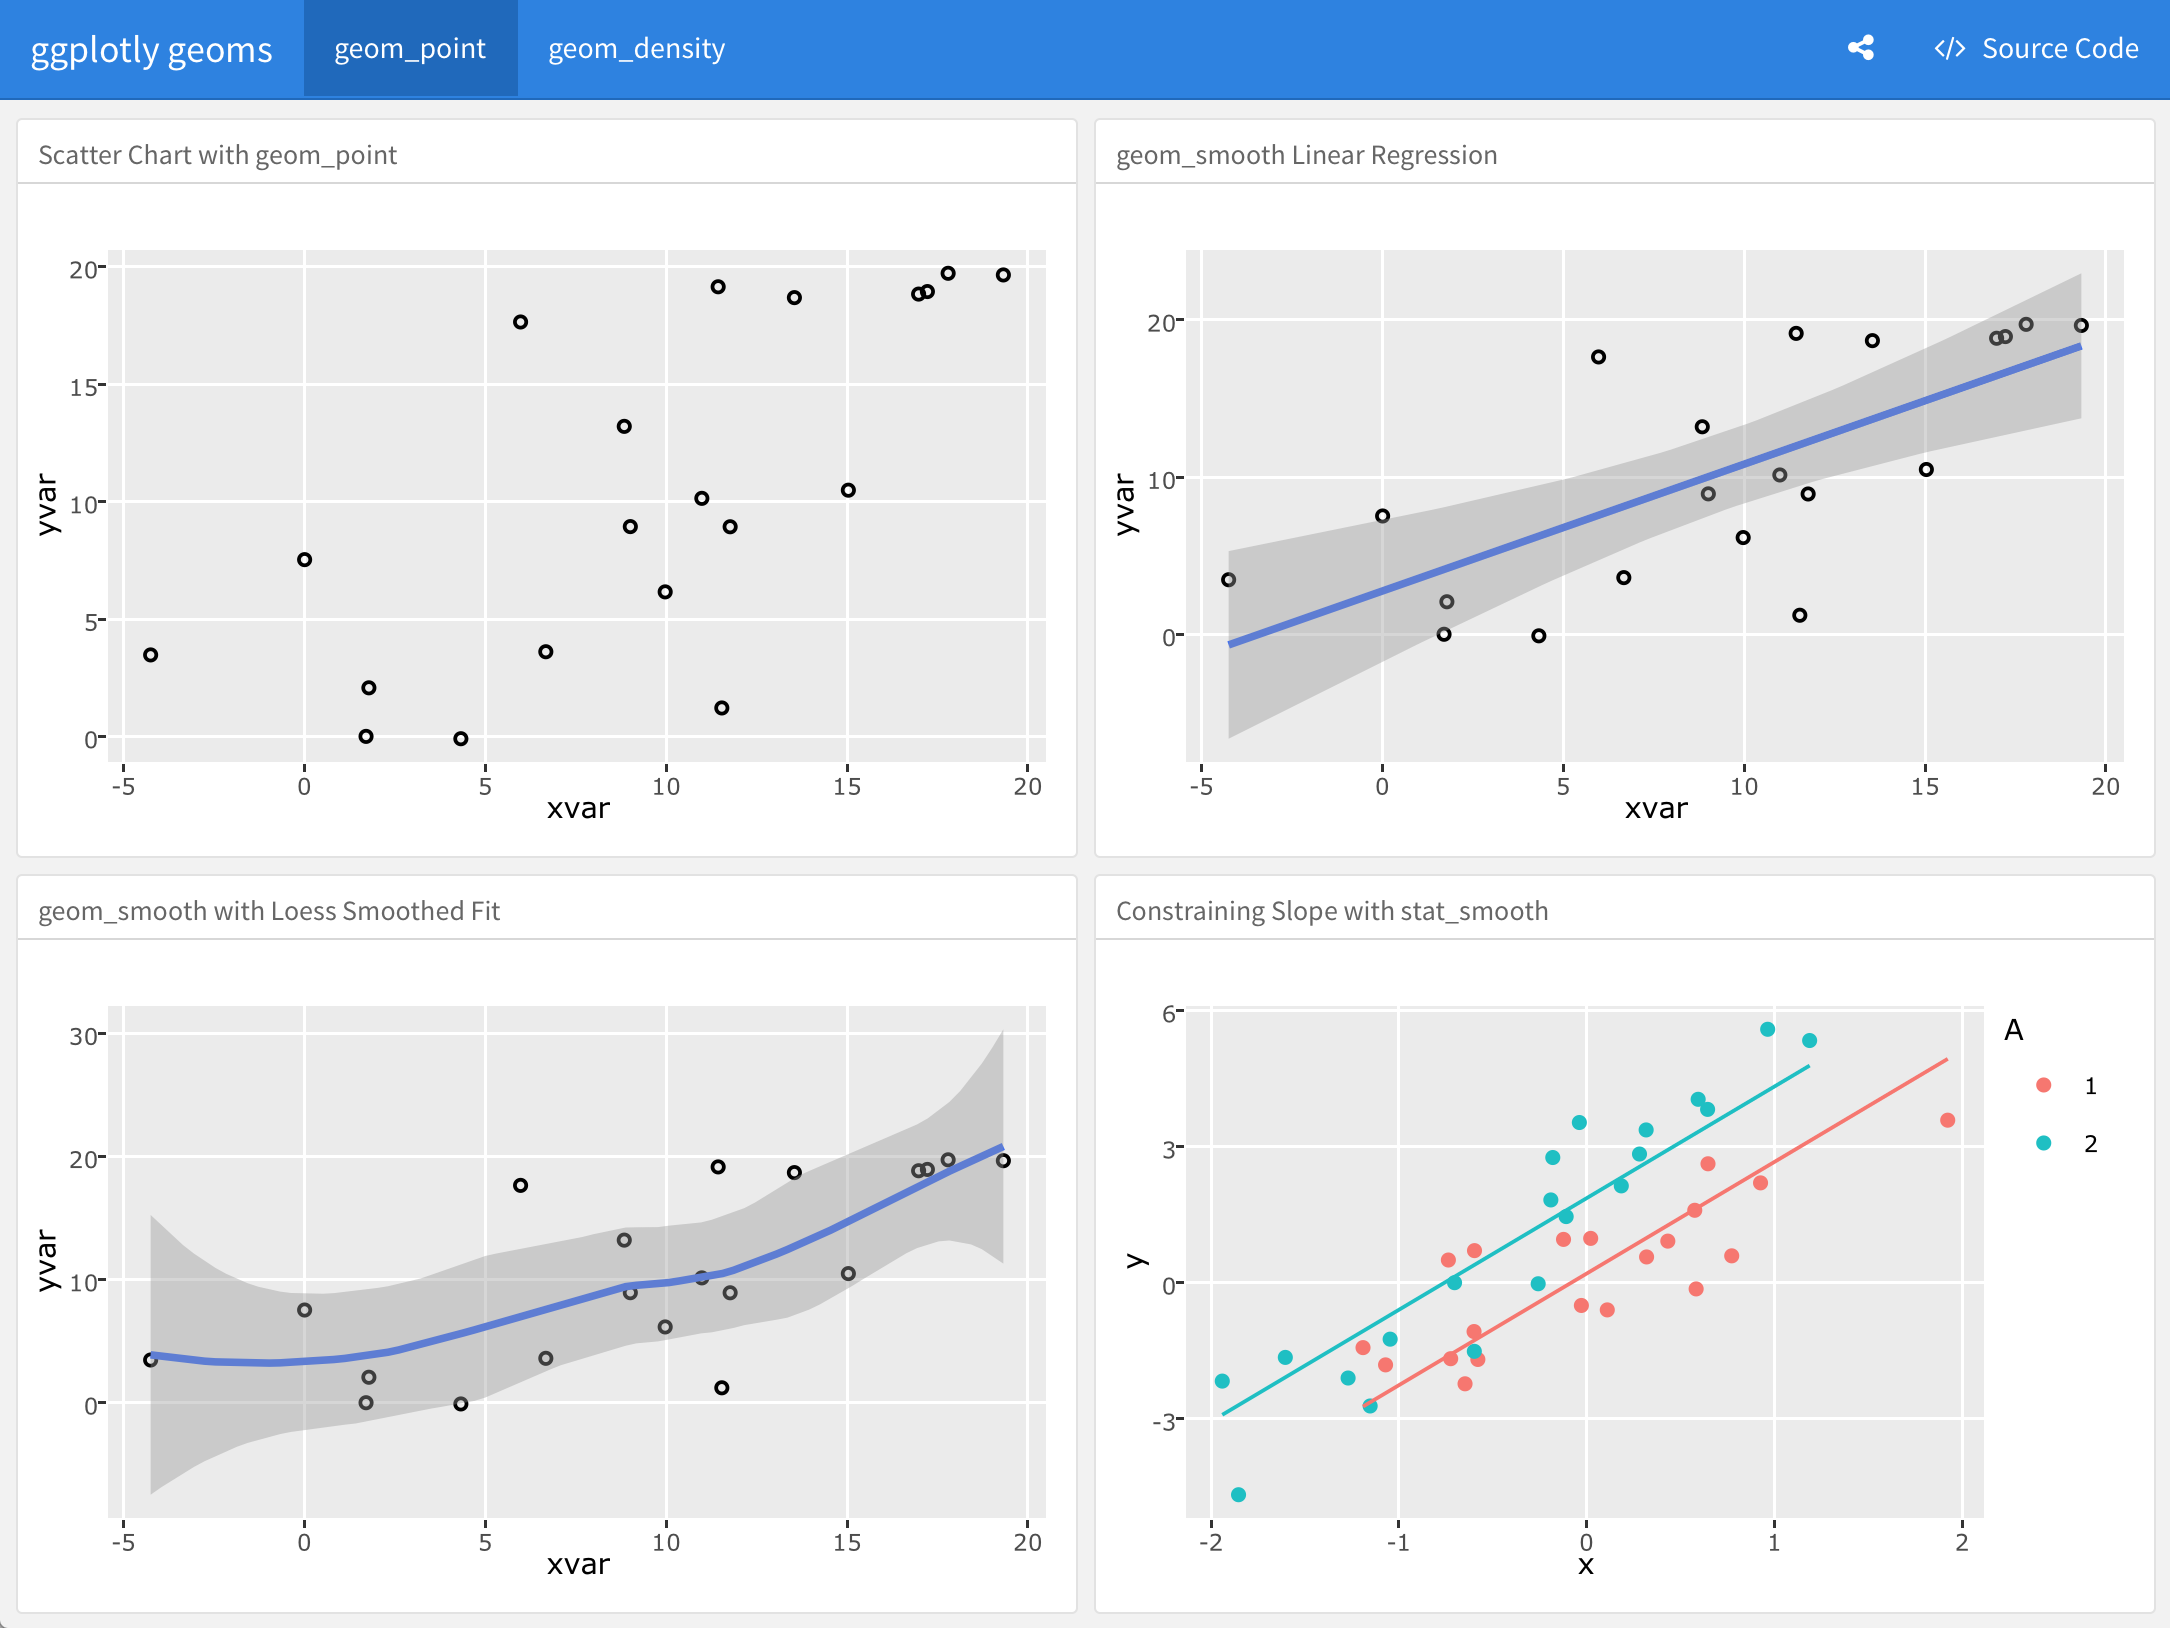
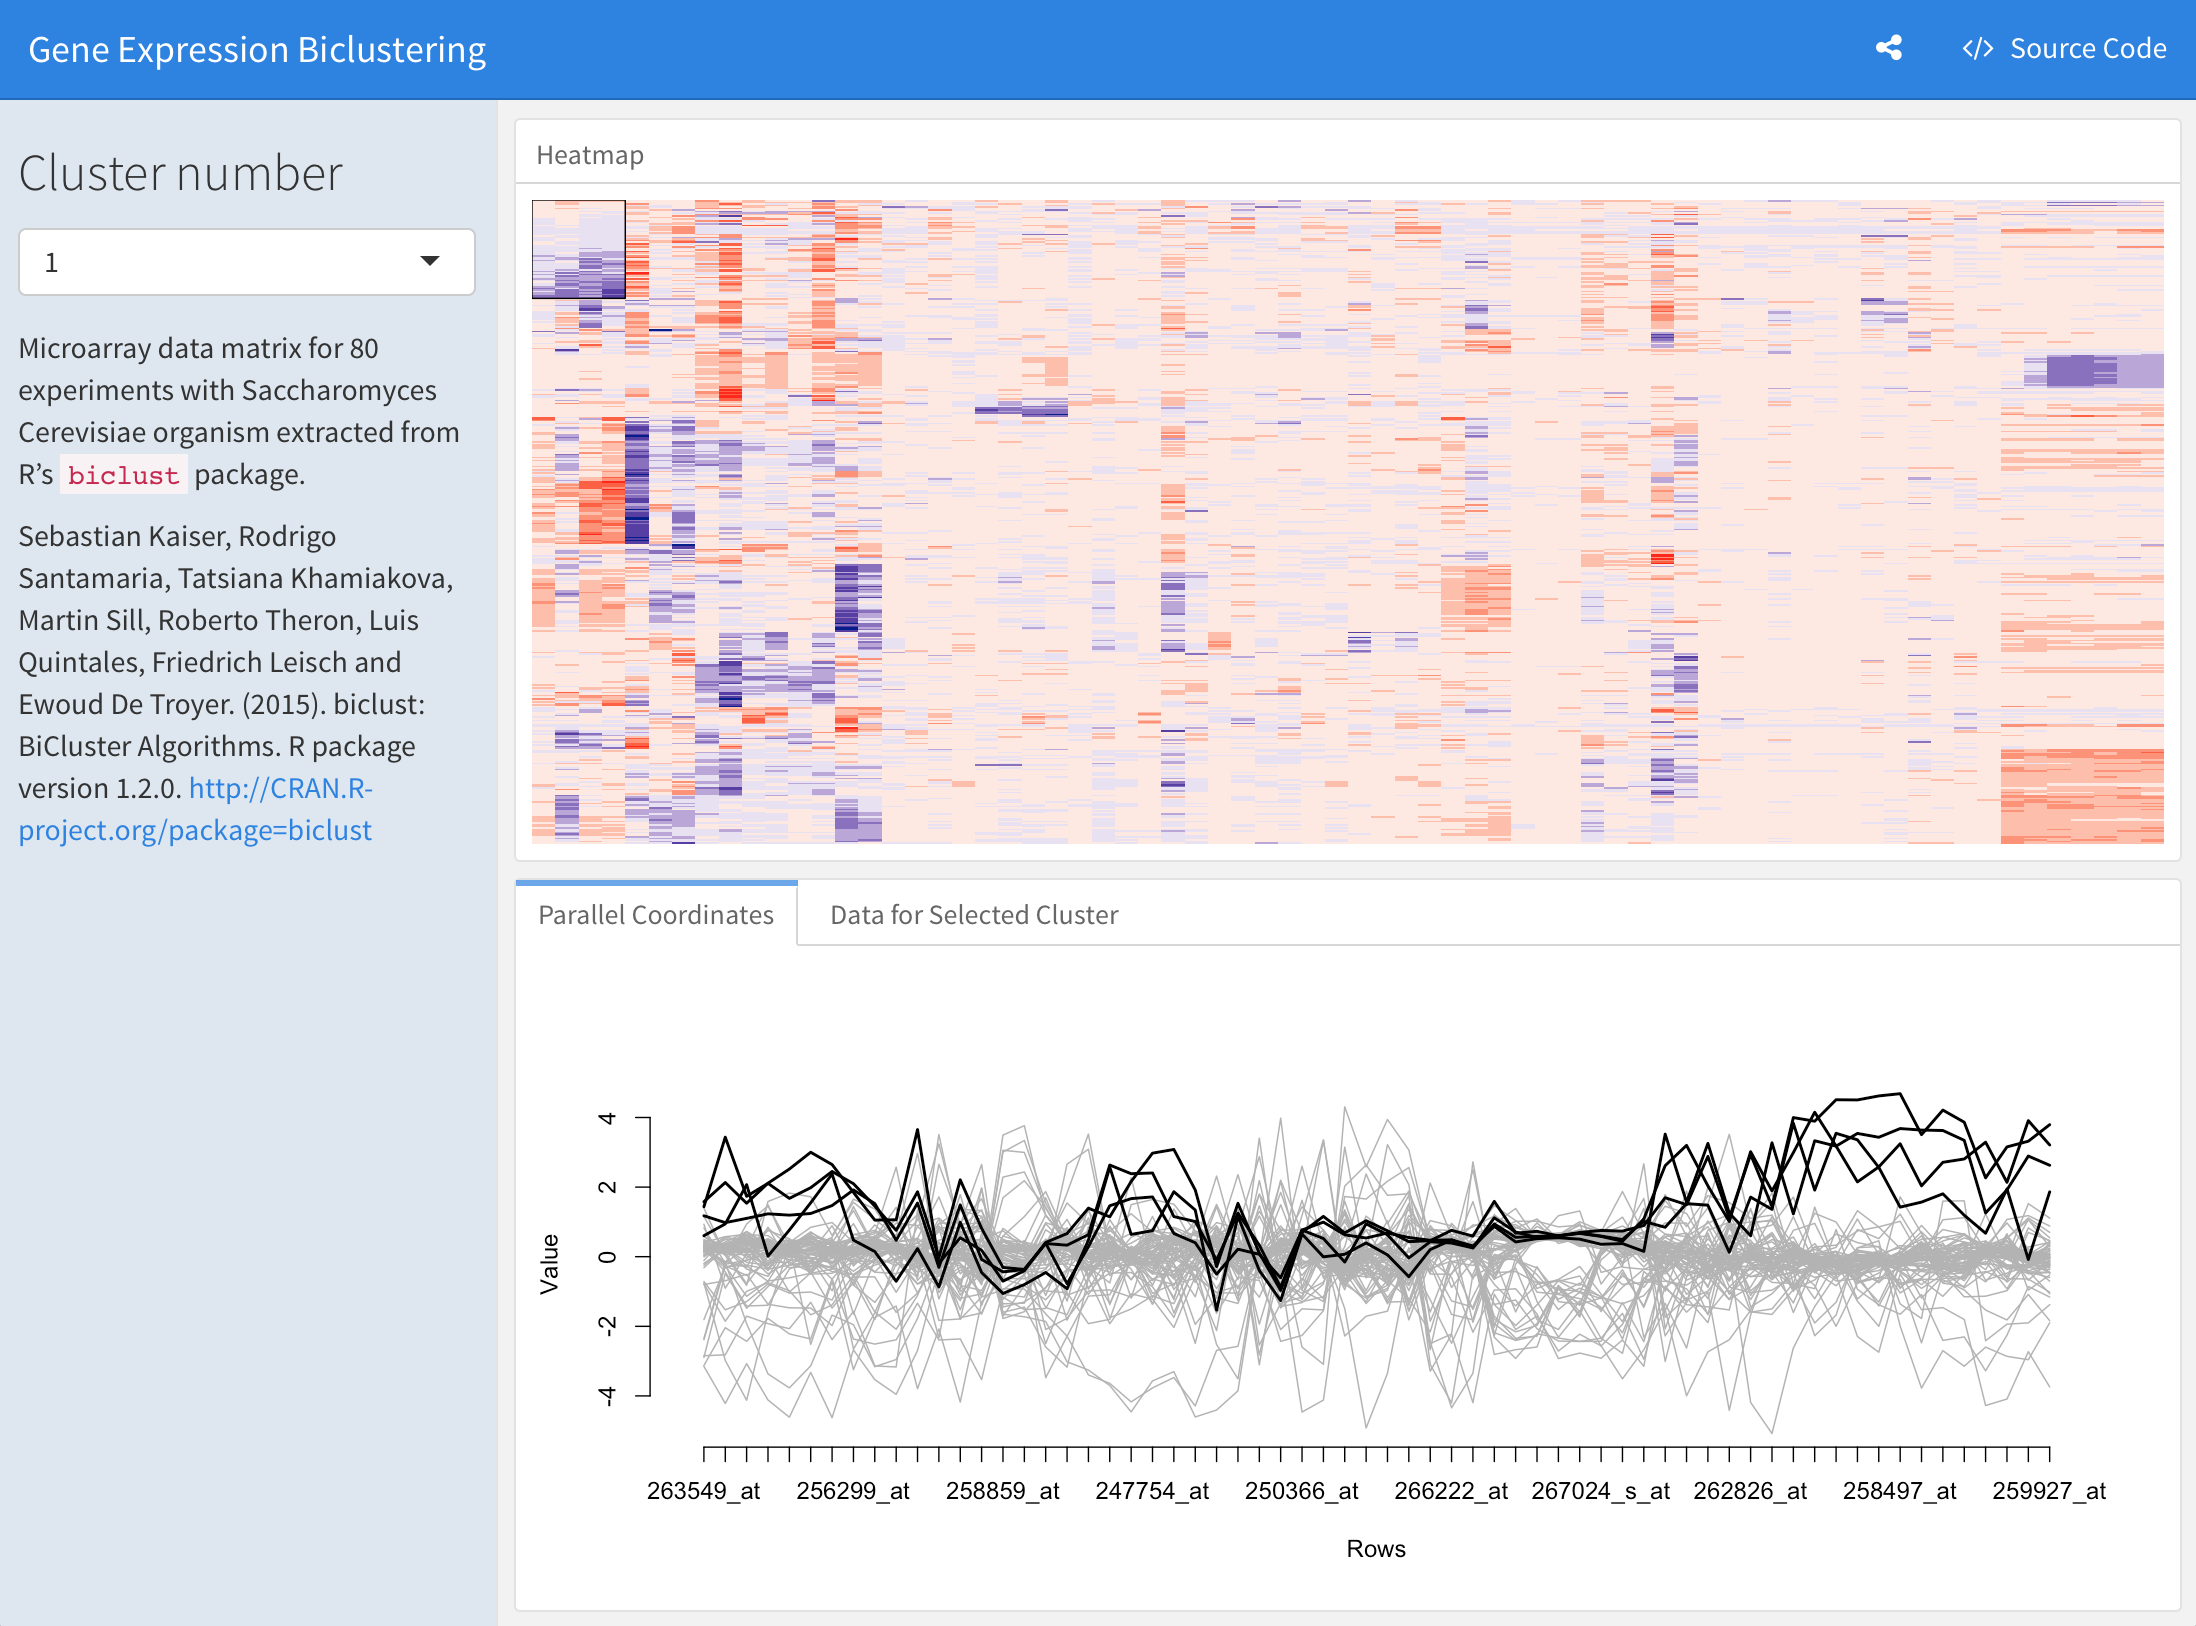
Support for a wide variety of components including htmlwidgets; base, lattice, and grid graphics; tabular data; gauges and value boxes; and text annotations.
-
Flexible and easy to specify row and column-based layouts. Components are intelligently re-sized to fill the browser and adapted for display on mobile devices.
-
Storyboard layouts for presenting sequences of visualizations and related commentary.
-
Optionally use Shiny to drive visualizations dynamically.
-
Optionally use bslib to easily customize main colors, fonts, and more.
Learn more about flexdashboard: https://pkgs.rstudio.com/flexdashboard
View more examples here.
Install the flexdashboard package from CRAN as follows:
install.packages("flexdashboard")If you want to use the development version of the flexdashboard package, you can install the package from GitHub via the remotes package:
remotes::install_github('rstudio/flexdashboard')To author a flexdashboard you create an R
Markdown document with the
flexdashboard::flex_dashboard output format. You can do this from
within RStudio using the New R Markdown dialog:

If you are not using RStudio, you can create a new flexdashboard R
Markdown file from the R console. Currently there are two templates:
-
"flex_dashboard"(basic) and -
"flex_dashboard_bslib"(an example of theming with{bslib}):
rmarkdown::draft("dashboard.Rmd",
                 template = "flex_dashboard_bslib",
package = "flexdashboard")There are two main places to get help with flexdashboard:
-
The RStudio community is a friendly place to ask any questions about flexdashboard. Be sure to use the
flexdashboardtag. Add also theshinytag is you are using a Shiny runtime. -
Stack Overflow is a great source of answers to common flexdashboard questions. It is also a great place to get help, once you have created a reproducible example that illustrates your problem. Use the tags
[r][flexdashboard]if you ask a question. Add the tag[shiny]if you are using a Shinyy runtime.
Please note that the flexdashboard project is released with a Contributor Code of Conduct. By contributing to this project, you agree to abide by its terms.