![]()
This repository contains the computational pipeline of the GRN-inference analysis based on expression of single cells. scRNA-sequencing datasets capture rich information about the transciptomic gene levels across thousands of cells and thus could be used to describe the gene interaction. All gene interactions could be depicted as gene regulatory networks (GRNs) that summarize genetic communication and regulation as a graph network. The focus of this repository is to provide an end-to-end pipeline to infer and analyze the GRNs that were computed based on scRNA-sequencing data.
As a case study, we focus on the COVID-19 patient dataset (Liao et al., 2020). The data is available on GEO (GSE145926) and contains 10xGenomics pipeline samples from the lung immune microenvironment in the bronchoalveolar lavage fluid (BALF) from 6 severe and 3 moderate COVID-19 patients and 3 healthy controls (look below).
- Single cell processing using
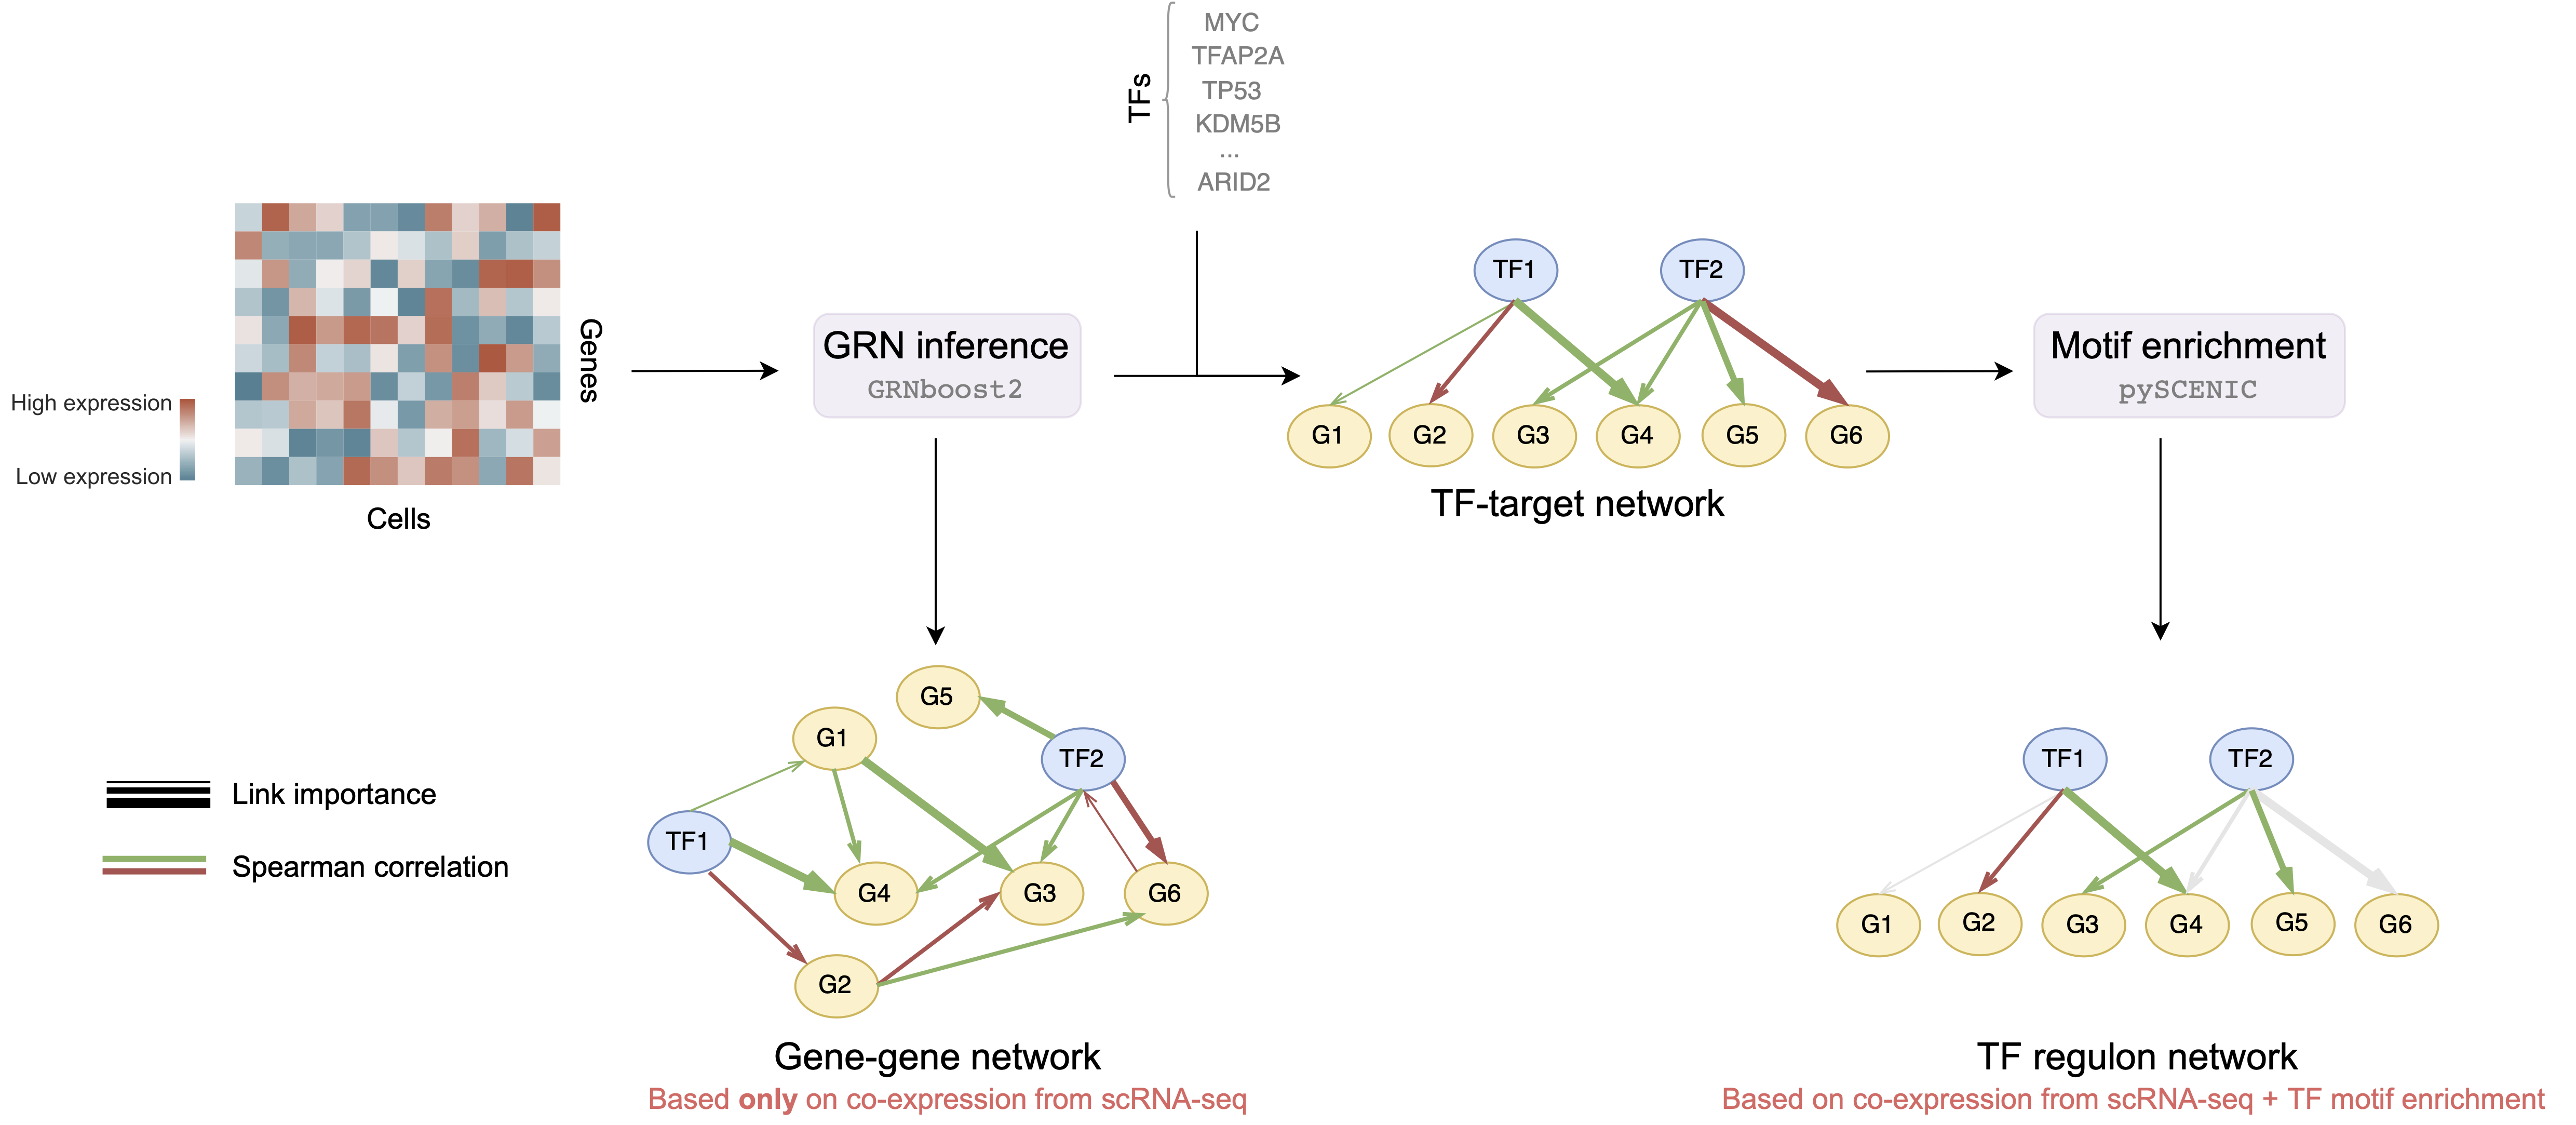
Seuratand cell type identification usingSingleR - Gene regulatory network inference using
arboretoandpyscenic(particularly withGRNBoost2algorithm) - Exploratory data analysis (EDA) of the inferred GRNs, description of nodes, edges and other GRN properties
- Rich data visualization of GRNs, on-the-fly comparison with known singaling networks from NDEx
- Community detection analysis of inferred GRN using Louvain or Leiden algorithms supported with wordcloud visualization
- Enrichment analysis of gene set clusters using
EnrichRandclusterProfiler, generation of functional gene networks - Identification of clinical relevance based on gene-gene interaction, linking tailored gene communcation structure to patient phenotype
We will work with two types of networks:
- Gene-gene networks - GRNs that are generated based on co-expression between all genes, i.e. we consider all possible pair-wise gene connections are possible
- TF regulon networks - GRNs that are generated based on co-expression and motif enrichment, i.e. consider only connections between transcription factors and corresponding targets a.k.a. regulons
The source code is available in the scGRN folder which consists of the following submodules:
single_cell_processing- processing of single cell RNA-sequencing datasc_pipeline-Seuratpipeline for single cell data processing, includes quality control, normalization, dimensionality reduction, clustering, cell type identification and data aggregationregulon_pipeline- regulon enrichment pipeline usingVIPER. Regulon is a set of genes that are regulated by a common regulatory protein, e.g. transcription factor.VIPERmeasures the activity of different regulons based on the co-expression of corresponding genes. EitherpyscenicorDoRothEAregulons can be used
network_inference- gene regulatory network inference pipeline usingpySCENIC, look in Types of inferred networks section for more detailsnetwork_analysis- analysis of inferred networks, includes exploratory data analysis (EDA), visualization, community detection and enrichment analysis
The work is heavily based on the Marenostrum supercomputer, thus the code is optimized for working in the HPC environment (i.e. Slurm). The single_cell_processing pipeline is implemented in R, while network_inference and network_analysis are implemented in Python. Both pipelines are wrapped in bash scripts for easy execution. Some scripts are tailored to the Marenostrum file system (file names conventions, Slurm-based workload commands), but could be easily adapted to other HPC environments. The community analysis provided in network_analysis could be also run at scale using Slurm manager. You can see the examples of the sbatch and greasy commands in the notebooks/Generate_sbatch_commands.ipynb notebook. For more details of the pipeline usage, please look in the corresponding README.md files in the submodules.
The network_analysis pipeline is implemented as a Python package that the user can use to analyze the inferred networks. It includes utilities for I/O operations, graph analysis, data aggregation and visualization. As an example, to read the patient sample metadata:
import scGRN

# Setting file system, also defined in config.py
_PROJ_HOME = (
    "/gpfs/projects/bsc08/shared_projects/scGRN_analysis"
)
_FMETA = (
    f"{_PROJ_HOME}/Data_home/data/GSE145926_RAW/metadata.tsv"
)
_DATA_HOME = f"{_PROJ_HOME}/Data_home/res/covid_19"

# Loading full metadata for all patients
full_meta = scGRN.ana.get_meta(_DATA_HOME, _FMETA)

print(full_meta.shape)
print(full_meta.columns)(12, 4)
Index(['group', 'file', 'num_cells', 'Macrophage', 'T_cells', 'DC',
'Pre-B_cell_CD34-', 'Monocyte', 'NK_cell', 'B_cell', 'Epithelial_cells',
'BM', 'Pro-B_cell_CD34+', 'HSC_-G-CSF', 'CMP', 'Neutrophils', 'GMP',
'Erythroblast', 'Gametocytes', 'Neurons', 'Fibroblasts',
'Smooth_muscle_cells', 'Hepatocytes', 'Keratinocytes', 'Pro-Myelocyte'],
dtype='object')Let's display some patient samples and their cell type composition:
print(full_meta)Output:
| id | group | file | num_cells | Macrophage | T_cells | DC | Pre-B_cell_CD34- | Monocyte | NK_cell | B_cell | Epithelial_cells | BM | Pro-B_cell_CD34+ | HSC_-G-CSF | CMP | Neutrophils | GMP | Erythroblast | Gametocytes | Neurons | Fibroblasts | Smooth_muscle_cells | Hepatocytes | Keratinocytes | Pro-Myelocyte |
|---|---|---|---|---|---|---|---|---|---|---|---|---|---|---|---|---|---|---|---|---|---|---|---|---|---|
| C51 | C | /gpfs/projects/bsc08/shared_projects/scGRN_analysis/Data_home/data/GSE145926_RAW/GSM4475048_C51_filtered_feature_bc_matrix.h5 | 9431 | 8348 | 608 | 215 | 98 | 70 | 68 | 9 | 7 | 4 | 3 | 1 | nan | nan | nan | nan | nan | nan | nan | nan | nan | nan | nan |
| C52 | C | /gpfs/projects/bsc08/shared_projects/scGRN_analysis/Data_home/data/GSE145926_RAW/GSM4475049_C52_filtered_feature_bc_matrix.h5 | 8696 | 8611 | 13 | 23 | 3 | 14 | 5 | 2 | 25 | nan | nan | nan | nan | nan | nan | nan | nan | nan | nan | nan | nan | nan | nan |
| C100 | C | /gpfs/projects/bsc08/shared_projects/scGRN_analysis/Data_home/data/GSE145926_RAW/GSM4475050_C100_filtered_feature_bc_matrix.h5 | 907 | 338 | 411 | 45 | 5 | 51 | 20 | 12 | 18 | nan | 2 | nan | 5 | nan | nan | nan | nan | nan | nan | nan | nan | nan | nan |
| C141 | M | /gpfs/projects/bsc08/shared_projects/scGRN_analysis/Data_home/data/GSE145926_RAW/GSM4339769_C141_filtered_feature_bc_matrix.h5 | 1449 | 197 | 932 | 48 | 5 | 86 | 96 | 33 | 37 | nan | nan | nan | 3 | 11 | 1 | nan | nan | nan | nan | nan | nan | nan | nan |
| C142 | M | /gpfs/projects/bsc08/shared_projects/scGRN_analysis/Data_home/data/GSE145926_RAW/GSM4339770_C142_filtered_feature_bc_matrix.h5 | 1790 | 482 | 996 | 39 | 13 | 67 | 113 | 20 | 38 | 1 | 1 | 2 | 3 | 14 | 1 | nan | nan | nan | nan | nan | nan | nan | nan |
| C144 | M | /gpfs/projects/bsc08/shared_projects/scGRN_analysis/Data_home/data/GSE145926_RAW/GSM4339772_C144_filtered_feature_bc_matrix.h5 | 452 | 37 | 181 | 41 | 8 | 73 | 34 | 14 | 54 | 2 | 1 | 1 | 1 | 3 | nan | 2 | nan | nan | nan | nan | nan | nan | nan |
| C143 | S | /gpfs/projects/bsc08/shared_projects/scGRN_analysis/Data_home/data/GSE145926_RAW/GSM4339771_C143_filtered_feature_bc_matrix.h5 | 14933 | 2048 | 1394 | 154 | 33 | 7489 | 562 | 72 | 145 | nan | 1 | 24 | 1 | 3005 | 2 | nan | 2 | 1 | nan | nan | nan | nan | nan |
| C145 | S | /gpfs/projects/bsc08/shared_projects/scGRN_analysis/Data_home/data/GSE145926_RAW/GSM4339773_C145_filtered_feature_bc_matrix.h5 | 15550 | 6960 | 719 | 859 | 46 | 5616 | 421 | 58 | 207 | nan | 1 | 26 | nan | 635 | 2 | nan | nan | nan | nan | nan | nan | nan | nan |
| C146 | S | /gpfs/projects/bsc08/shared_projects/scGRN_analysis/Data_home/data/GSE145926_RAW/GSM4339774_C146_filtered_feature_bc_matrix.h5 | 2545 | 247 | 61 | 36 | nan | 127 | 14 | 3 | 417 | nan | nan | 2 | nan | 1632 | nan | nan | 1 | nan | 2 | 1 | 1 | 1 | nan |
| C148 | S | /gpfs/projects/bsc08/shared_projects/scGRN_analysis/Data_home/data/GSE145926_RAW/GSM4475051_C148_filtered_feature_bc_matrix.h5 | 1165 | 98 | 122 | 24 | nan | 641 | 36 | 8 | 52 | nan | 1 | nan | 3 | 178 | 1 | nan | 1 | nan | nan | nan | nan | nan | nan |
| C149 | S | /gpfs/projects/bsc08/shared_projects/scGRN_analysis/Data_home/data/GSE145926_RAW/GSM4475052_C149_filtered_feature_bc_matrix.h5 | 1936 | 176 | 681 | 80 | 1 | 691 | 59 | 38 | 41 | nan | nan | 5 | nan | 164 | nan | nan | nan | nan | nan | nan | nan | nan | nan |
| C152 | S | /gpfs/projects/bsc08/shared_projects/scGRN_analysis/Data_home/data/GSE145926_RAW/GSM4475053_C152_filtered_feature_bc_matrix.h5 | 2557 | 466 | 397 | 41 | 176 | 795 | 74 | 317 | 201 | 6 | 40 | nan | nan | 30 | 13 | nan | nan | nan | nan | nan | nan | nan | 1 |
You can also visualize the cell count for different patients and cell types using various visualization utilities:
scGRN.ana.plot_avail_cell_types(
    save_as="EDA_cell_type_dist.pdf"
)
For more examples of use look into examples and notebooks.
For further information please contact by mail at [email protected].