JASPE stands for Just Another Stereoplot§ in a Python Environment. This is a pet project that I develop at my own pace and according to my needs. The script is therefore not primarily intended for general use but my own. You should not expect updates, new features, or bug fixes in reasonable times, nor can I assure you that the project will be abandoned for a large period of time. My main goal with this is to include stereographic/equal-area projections in my Python workflow and learn. If you are looking for a software specifically dedicated to this task there are other options out there, for example here, here, or here. In any case, if you decide to use it or want to access the source code out of curiosity, do so at your own risk and responsibility downloading the script here. You can also fork the project on GitHub since it is free and open-source.
So far, the script only performs basic tasks. One function tweaks the default features of matplotlib plots (i.e. the standard Python plotting library) to generate single or multiple stereoplots, another is for importing tabular-like data, and the rest to transform between different reference frames; from spherical to equal-area or stereographic (equal-angle) coordinates or from spherical to cartesian coordinates and vice versa.
§ As stated above, the JASPE script is intended to produce both stereographic (Wulff) and equal-area (a.k.a. Schmidt net or Lambert azimuthal) projections. I chose the word stereoplot because is very familiar in geosciences and used by geoscientists to refer, somewhat loosely, to both projections. Strictly speaking the equal-area projection is not a stereographic projection, but you can exchange the word Stereoplot for Schmidt net plot and the acronym JASPE will remain the same.
The script requires Python 3.5 or higher and the scientific libraries Numpy (1.11 or higher), Matplotlib (2.0 or higher) and Pandas. For this, we recommend installing the Continuum Anaconda or the Enthought Canopy and use the Spyder or the Canopy IDEs respectively.
The script operates through the command line. The example below requires v0.3 or higher for correct operation.
# Create a simple stereoplot
fig, ax = stereoplot()

# Plot some data using the function plot_data
plot_eq_area(ax, 180, 45)  # plot in equal-area projection
plot_eq_angle(ax, 180, 45)  # plot in equal-angle projection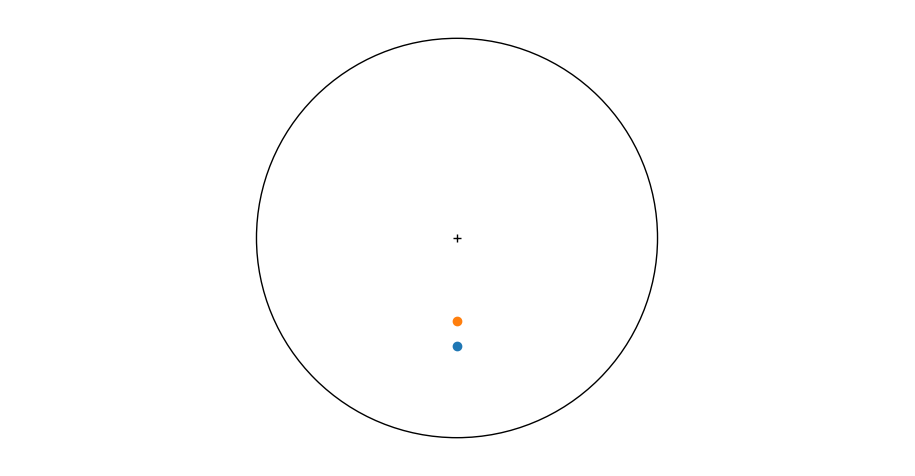
# Create dataset
azimuths = [0, 45, 90, 135, 180, 225, 270, 315, 360]
dips = [0, 10, 20, 30, 40, 50, 70, 80, 90]

# plot
fig, ax = stereoplot()  # create plot
plot_eq_area(ax, azimuths, dips, marker='h', color='C3', markersize=9)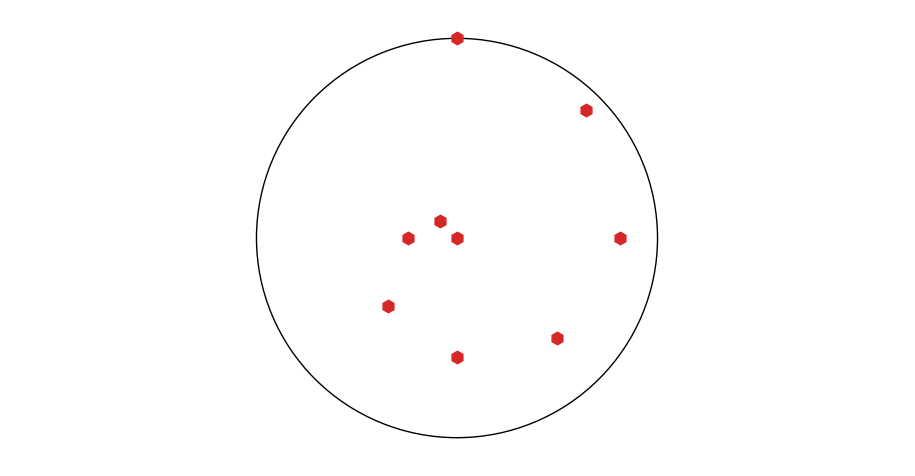
# Import data. The function will ask you for the location of the file through a file selection dialog
dataset = import_data()

Trend  Plunge Type
0    5.0    67.0    C
1    9.0     9.0    C
2   22.0    64.0    C
3   27.0    16.0    C
4   27.0    52.0    C
...
  Trend  Plunge Type
107  331.0    81.0    C
108  340.0    63.0    C
109  345.0    16.0    C
110  352.0    26.0    C
111  355.0    24.0    C

fig, ax = stereoplot()  # create plot
plot_eq_area(ax, dataset['Trend'], dataset['Plunge'], marker='o', markersize=8, label='Kamb (1959) data')
ax.legend()  # add legend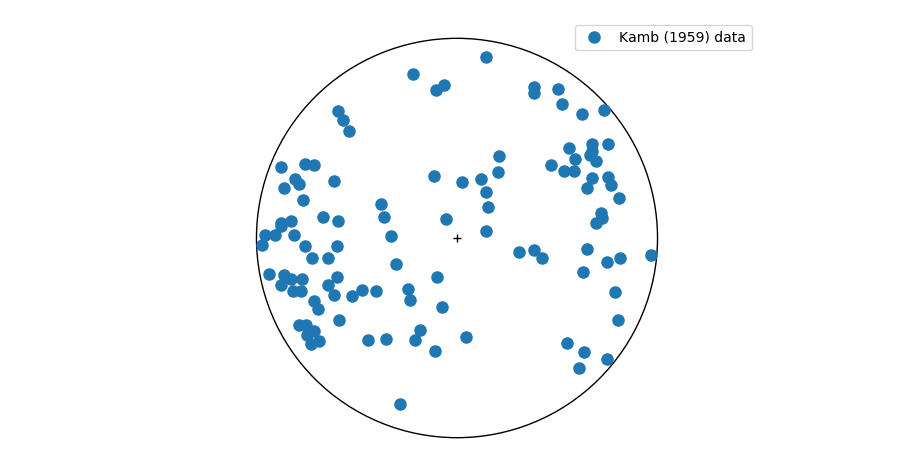
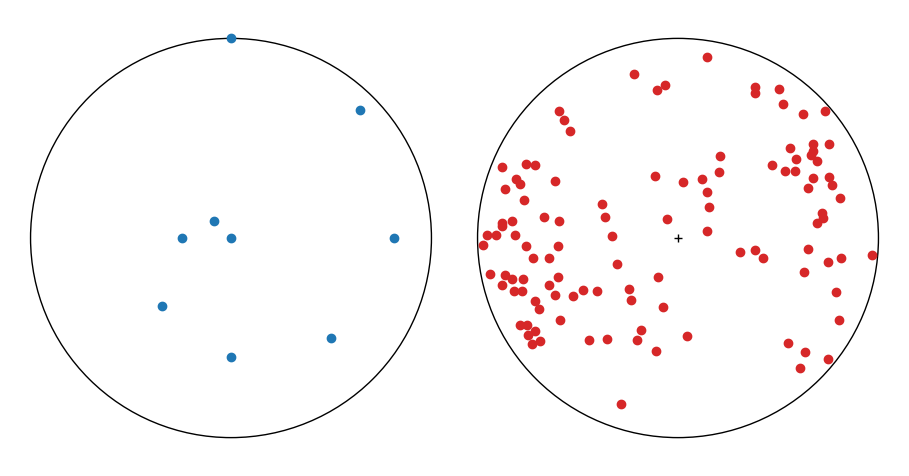
# Create a figure with two stereos (1 row * 2 columns)
fig, (ax1, ax2) = stereoplot(nrows=1, ncols=2)

# plot linear data in the left (ax1) stereo
plot_eq_area(ax1, azimuths, dips)

# plot Kamb data in the right (ax2) stereo
plot_eq_area(ax2, dataset['Trend'], dataset['Plunge'], color='C3')