
This is an open source library used to draw charts in Android with Jetpack Compose with a simple and easy to use. Just couples of lines.
-
Add this line to your project
gradlefile:maven { url 'https://jitpack.io' } -
Add this dependency to your app
gradlefile:implementation 'com.github.MahmoudIbrahim3:android-compose-charts:<latest-release>'
val barChartData = listOf(
  BarChartEntity(150.0f, Color(0xFF618A32), "1"),
  BarChartEntity(450.0f, Color(0xFFC32A33), "2"),
  BarChartEntity(300.0f, Color.Blue, "3"),
  BarChartEntity(150.0f, Color.Cyan, "4"),
  BarChartEntity(500.0f, Color.Magenta, "5")
)

val verticalAxisValues = listOf(0.0f, 100.0f, 200.0f, 300.0f, 400.0f, 500.0f)

BarChart(
    barChartData = barChartData,
    verticalAxisValues = verticalAxisValues
)
The following code snippet demonstrates a lot of attributes to custom and design your Bar Chart as you like:
BarChart(
  barChartData = barChartData,
  verticalAxisValues = verticalAxisValues,
  axisColor = Color.Red,
  verticalAxisLabelColor = Color.Blue,
  verticalAxisLabelFontSize = 20.sp,
  horizontalAxisLabelColor = Color.Magenta,
  horizontalAxisLabelFontSize = 24.sp,
  paddingBetweenBars = 16.dp,
  isShowVerticalAxis = true,
  isShowHorizontalLines = false,
)

val lineChartData = listOf(
LineChartEntity(150.0f, "A"),
LineChartEntity(250.0f, "B"),
LineChartEntity(50.0f, "C"),
LineChartEntity(300.0f, "D"),
LineChartEntity(400.0f, "E")
)
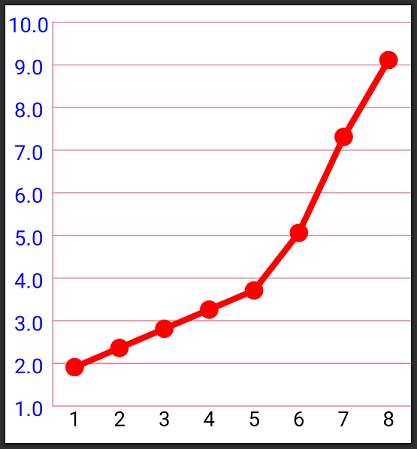
LineChart(
lineChartData = lineChartData,
verticalAxisValues = verticalAxisValues
)LineChart(
lineChartData = lineChartData2,
verticalAxisValues = verticalAxisValues2,
lineColor = Color.Red,
strokeWidth = 6.dp,
axisColor = Color(0xF0E47A8A),
verticalAxisLabelColor = Color.Blue,
verticalAxisLabelFontSize = 20.sp,
horizontalAxisLabelColor = Color.Black,
horizontalAxisLabelFontSize = 20.sp,
isShowVerticalAxis = true,
isShowHorizontalLines = true,
)
val columnChartSeriesData = listOf(
    SeriesData(listOf(4f, 2.5f, 3.5f, 4.5f), Color(0xff4472c4), "Series1"),
    SeriesData(listOf(2.5f, 4.5f, 1.5f, 3f), Color(0xffed7d31), "Series3"),
    SeriesData(listOf(2.0f, 2f, 3f, 5f), Color(0xFF8BC34A), "Series3"),
)

val columnChartCategoriesData = listOf("Cat1", "Cat2", "Cat3", "Cat4")

ColumnChart(
    seriesData = columnChartSeriesData,
    categories = columnChartCategoriesData,
)val columnChartSeriesData2 = listOf(
SeriesData(listOf(4f, 3.5f), Color.Red, "Series1"),
SeriesData(listOf(1.5f, 4.5f), Color.Green, "Series2")
)
val columnChartCategoriesData2 = listOf("Category1", "Category2")
ColumnChart(
modifier = Modifier.padding(start = 4.dp, end = 8.dp, top = 16.dp, bottom = 16.dp),
seriesData = columnChartSeriesData2,
categories = columnChartCategoriesData2,
chartElements = ChartElements(
showVerticalLine = true,
showGridLines = false,
showHorizontalLabels = false,
showLegend = false,
gridLinesColor = Color.DarkGray,
labelColor = Color.Black,
barWidth = 40.dp,
legendWidth = 6.dp,
fontSize = 16.sp
)
)


