![]()


Lux is a Python library that facilitate fast and easy data exploration by automating the visualization and data analysis process. By simply printing out a dataframe in a Jupyter notebook, Lux recommends a set of visualizations highlighting interesting trends and patterns in the dataset. Visualizations are displayed via an interactive widget that enables users to quickly browse through large collections of visualizations and make sense of their data.
Here is a 1-min video introducing Lux, and slides from a more extended talk.
Check out our notebook gallery with examples of how Lux can be used with different datasets and analyses.
Or try out Lux on your own in a live Jupyter Notebook!
To start using Lux, simply add an extra import statement along with your Pandas import.
import lux
import pandas as pd
Lux can be used without modifying any existing Pandas code. Here, we use Pandas's read_csv command to load in a dataset of colleges and their properties.
df = pd.read_csv("https://raw.githubusercontent.com/lux-org/lux-datasets/master/data/college.csv")
df
When the dataframe is printed out, Lux automatically recommends a set of visualizations highlighting interesting trends and patterns in the dataset.
Voila! Here's a set of visualizations that you can now use to explore your dataset further!
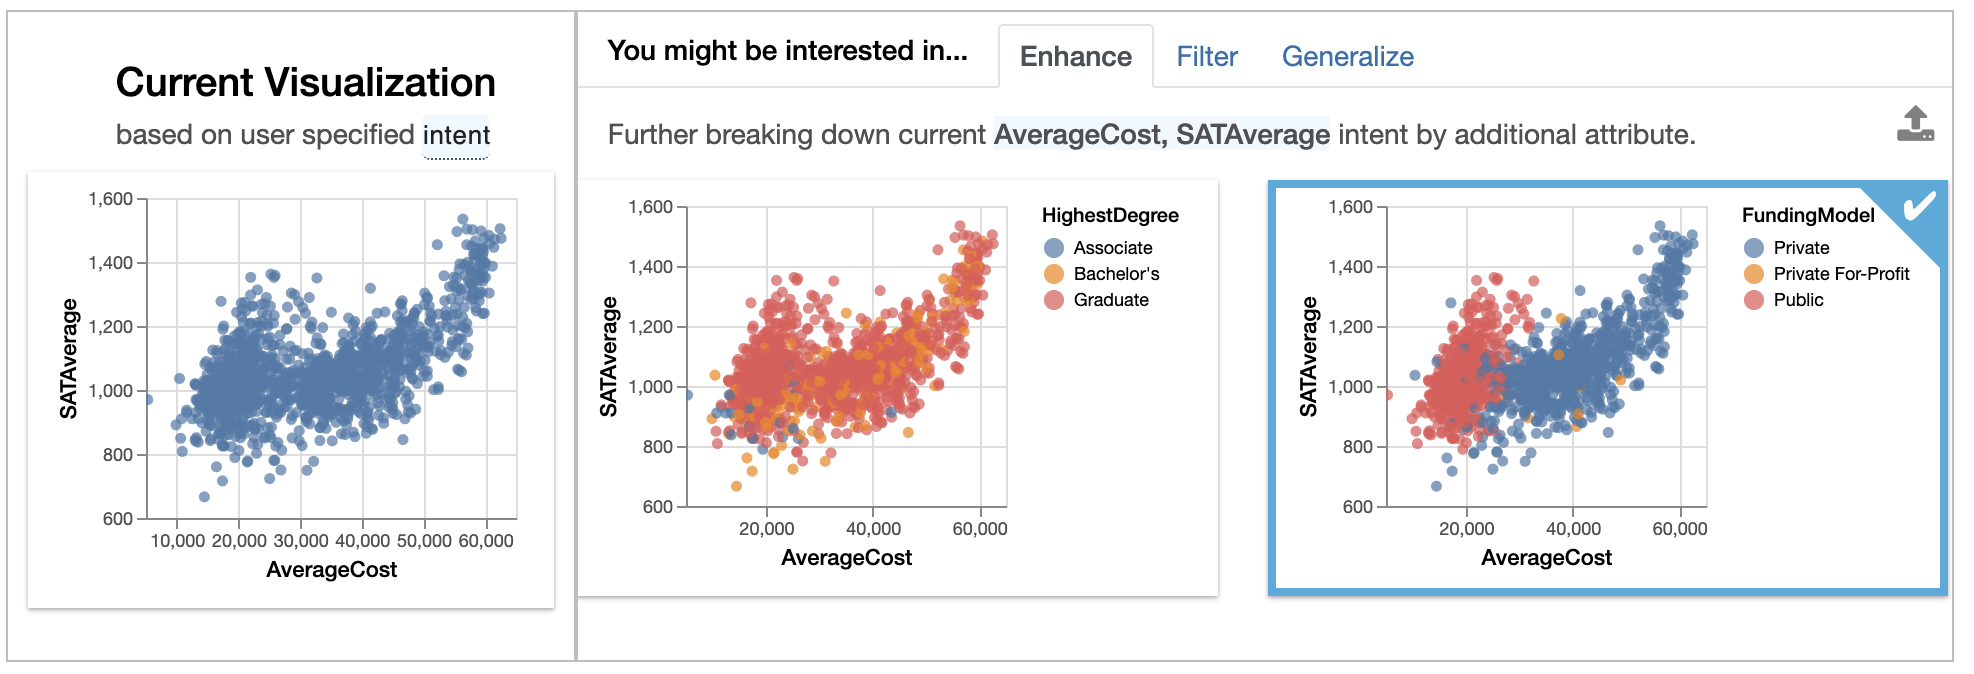
In addition to dataframe visualizations at every step in the exploration, you can specify to Lux the attributes and values you're interested in. Based on this intent, Lux guides users towards potential next-steps in their exploration.
For example, we might be interested in the attributes AverageCost and SATAverage.
df.intent = ["AverageCost","SATAverage"]
df
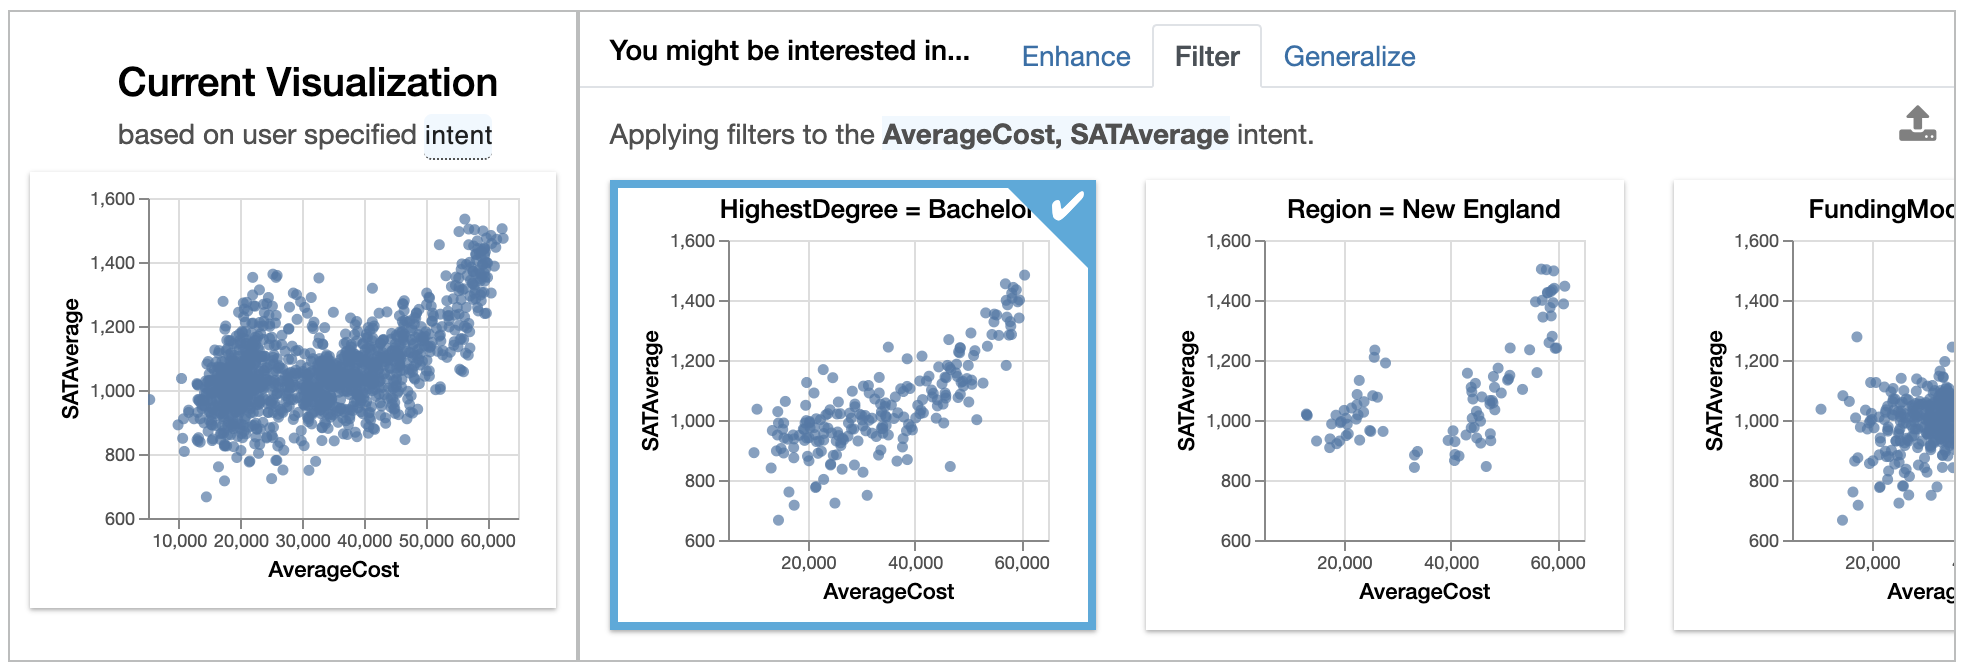
The left-hand side of the widget shows the current visualization, i.e., the current visualization generated based on what the user is interested in. On the right, Lux generates three sets of recommendations, organized as separate tabs on the widget:
Enhanceadds an additional attribute to the current selection, essentially highlighting how additional variables affect the relationship ofAverageCostandSATAverage. We see that if we breakdown the relationship byFundingModel, there is a clear separation between public colleges (shown in red) and private colleges (in blue), with public colleges being cheaper to attend and with SAT average of lower than 1400.
Filteradds a filter to the current selection, while keeping attributes (on the X and Y axes) fixed. These visualizations show how the relationship ofAverageCostandSATAveragechanges for different subsets of data. For instance, we see that colleges that offer Bachelor's degree as its highest degree show a roughly linear trend between the two variables.
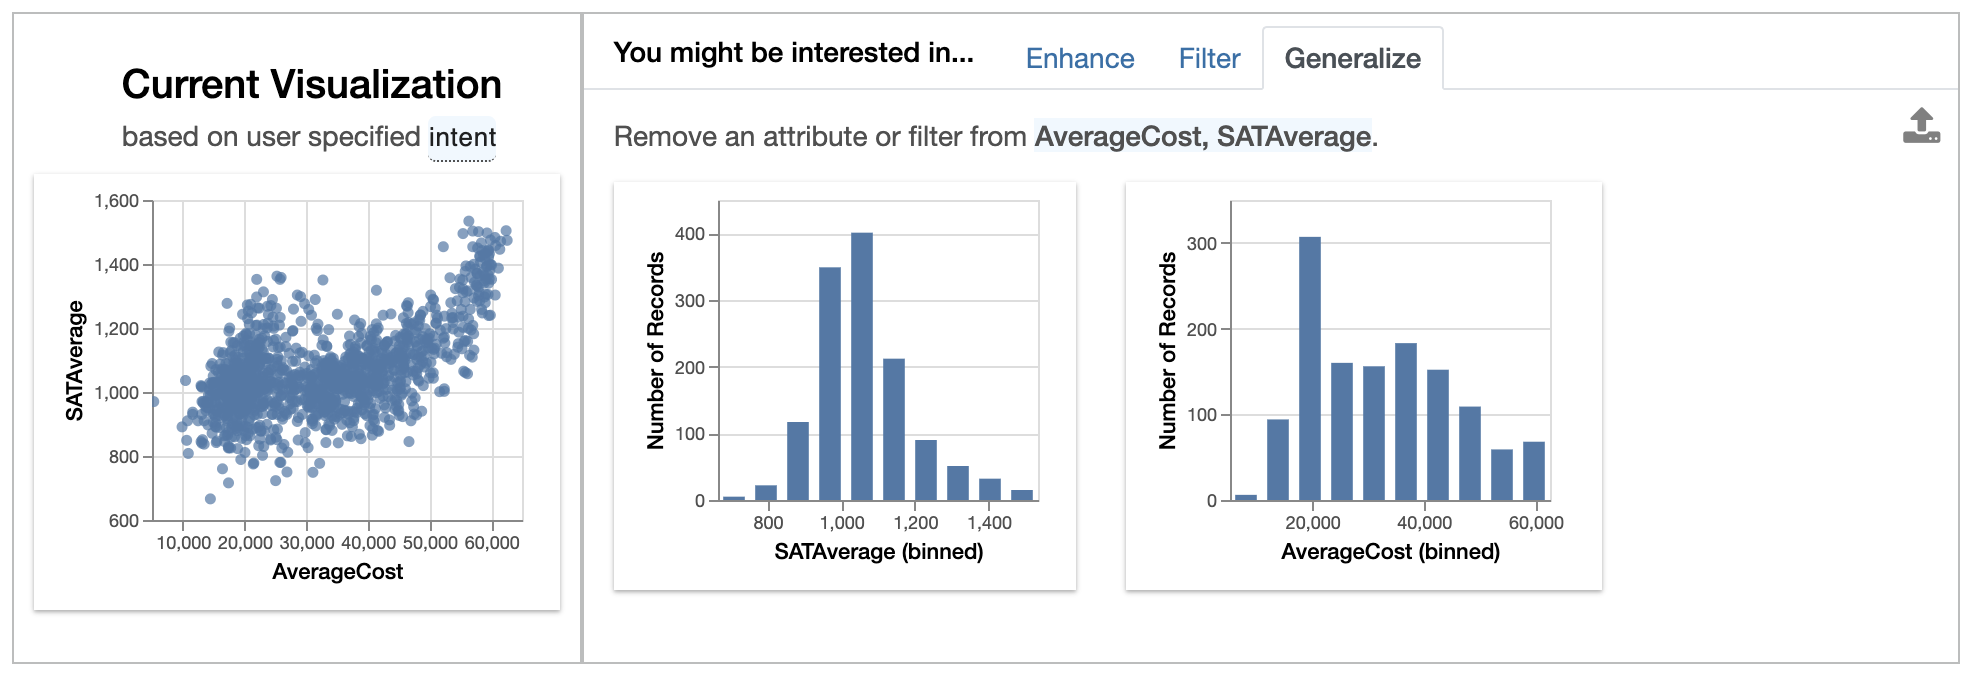
Generalizeremoves an attribute to display a more general trend, showing the distributions ofAverageCostandSATAverageon its own. From theAverageCosthistogram, we see that many colleges with average cost of around $20000 per year, corresponding to the bulge we see in the scatterplot view.
See this page for more information on additional ways for specifying the intent.
Now that we have found some interesting visualizations through Lux, we might be interested in digging into these visualizations a bit more or sharing it with others. We can save the visualizations generated in Lux as a static, shareable HTML or programmatically access these visualizations further in Jupyter. Selected Vis objects can be translated into Altair, Matplotlib, or Vega-Lite code, so that they can be further edited.
Learn more about how to save and export visualizations here.
We've seen how Viss are automatically generated as part of the recommendations. Users can also create their own Vis via the same syntax as specifying the intent. Lux is built on the philosophy that users should always be able to visualize anything they want, without having to think about how the visualization should look like. Lux automatically determines the mark and channel mappings based on a set of best practices. The visualizations are rendered via Altair into Vega-Lite specifications.
from lux.vis.Vis import Vis
Vis(["Region=New England","MedianEarnings"],df)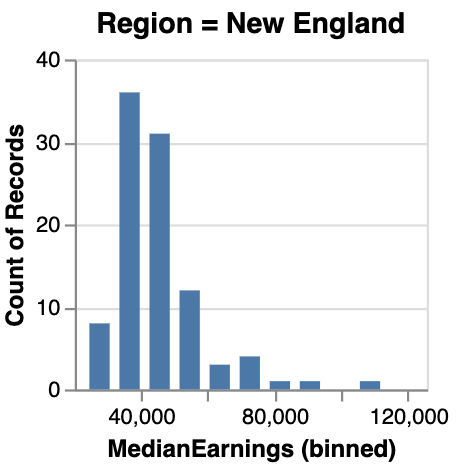
Lux provides a powerful abstraction for working with collections of visualizations based on a partially specified queries. Users can provide a list or a wildcard to iterate over combinations of filter or attribute values and quickly browse through large numbers of visualizations. The partial specification is inspired by existing work on visualization query languages, including ZQL and CompassQL.
For example, we are interested in how the AverageCost distribution differs across different Regions.
from lux.vis.VisList import VisList
VisList(["Region=?","AverageCost"],df)
To find out more about other features in Lux, see the complete documentation on ReadTheDocs.
Note: Lux's official package name is
lux-api(notlux). After installing the package, remember to run the setup instructions for your notebook IDE, e.g., jupyter notebook and jupyter lab.
To get started, please follow both the installation and setup instructions in your command line.
lux-api can be installed through PyPI or conda-forge.
pip install lux-apiIf you use conda, you can install lux-api via:
conda install -c conda-forge lux-apiBoth the PyPI and conda installation include includes the Lux Jupyter widget frontend, lux-widget.
To use Lux with any Jupyter notebook-based frontends (e.g., Jupyter notebook, JupyterHub, or VSCode), activate the notebook extension:
jupyter nbextension install --py luxwidget
jupyter nbextension enable --py luxwidget
If the installation happens correctly, you should see two - Validating: OK after executing the two lines above.
Note that you may have to restart the Jupyter Notebook server to ensure that the widget is displaying correctly.
Lux is compatible with both Jupyter Lab version 2 and 3. To use Lux in Jupyter Lab, activate the lab extension:
jupyter labextension install @jupyter-widgets/jupyterlab-manager
jupyter labextension install luxwidget
Note that JupyterLab and VSCode is supported only for lux-widget version >=0.1.2, if you have an earlier version, please upgrade to the latest version of lux-widget. Lux has only been tested with the Chrome browser.
If you encounter issues with the installation, please refer to this page to troubleshoot the installation. Follow these instructions to set up Lux for development purposes.
Lux is undergoing active development. If you are using Lux, we would love to hear from you!
Drop us a note here to share your experiences — any feedback, suggestions, and contributions are welcome!
Links to additional resources:
- Follow us on Twitter or sign up to our mailing list to stay tuned for upcoming releases and updates.
- Visit ReadTheDoc for more detailed documentation.
- Try out these hands-on exercises or tutorials on Binder. Or clone and run lux-binder locally.
- Join our community Slack to discuss and ask questions.
- Check out our paper for more details on how Lux works under the hoods.
- Report any bugs, issues, or requests through Github Issues.