In this lab we will introduce Dash, a Python framework for building analytical web applications that uses other libraries and frameworks like Plotly, React, and Flask. More simply, Dash is an easy-to-use tool that allows us to display both HTML and graphs in our browser. Dash enables us to integrate data visualization tools into our web applications, thus bringing us another step forward to being data scientists. We will start off with a simple example of how to set up a page and graph some data in Dash. Let's get started!
- Install all the necessary libraries and frameworks and import them into our application
- Initialize a new Dash app
- Create a layout with Dash's html components
- Add a graph to our Dash app with Dash's core components
First things first, we will need to install all the parts of Dash that we will be using. We will need to pip install:
- dash -- dash's backend
- dash-renderer -- dash's front-end
- dash-html-components -- dash's components for creating HTML layouts and tags on the web page
- dash-core-components -- dash's components for creating data visualizations and other tools
- plotly -- the plotly graphing library
We can install all of these by running one command in our terminal:
pip install dash dash-renderer dash-html-components dash-core-components plotly
To create a new Dash Application, we need to first define our imports in our app.py file, which will be the following:
import dash # importing the dash framework
import dash_core_components as dcc # importing the core components from dash
import dash_html_components as html # importing the html components from dash
Once we have our imports set-up, we can create a new instance of a Dash app with the following line of code:
# creating a new instance of Dash
app = dash.Dash()

# telling our app to start the server if we are running this file
if __name__ == '__main__':
    app.run_server(debug=True)
Okay, once we've done the above, we have ourselves a Dash app! It doesn't do much (or show much in our browser), but we can certainly run the server and look at in our browser. Let's try it by running the following command in our terminal and then opening a new tab in our browser and navigating to http://localhost:8050/
python app.py
Uh oh! We got an error; AttributeError: 'NoneType' object has no attribute 'traverse'. Dash is expecting some html, specifically a layout, to display, but we haven't yet given it a layout. Let's keep going and fix this issue.
Okay, we have our Dash app almost working. Let's see how we add a layout to our app.
You already might have guessed it at this point, but it's as simple as:
app.layout = # some codeUnfortunately, we can't just assign the layout to some HTML or even a string of HTML, we need to use dash's html components. So, since we imported the dash_html_components as html, we will reference it as such. To start, we will assign the layout to an html element. Usually we will chose a div to start.
app.layout = html.Div("Hello World")We can add this in directly underneath where we instantiated our dash app and above where we start the server. Now, when we refresh the browser, we should see a div with the text "Hello World". Great!
Since we will be adding more than just a simple div to our page, we should re-format this layout slightly. Instead of giving our layout's most outer div tag just a string of "Hello World", we should give it a children attribute and assign it to a list.
app.layout = html.Div(children=[])Note: You can give any dash html element a children attribute; however, you should only do this if you are nesting multiple html elements within that element (i.e. our page layout, an ordered or unordered list of elements, etc.)
Inside this list we are going to add all the other html elements we want to display on our page. Let's add an h1 tag that reads "Hello, this is my first dash app" and below that let's add a p tag that reads "Still under construction... :)".
Note: as our layout grows, it is important to have a clean formatting so that we can more easily read and manage our code base. Below is an illustration of how we should format the dash html elements in our list of html children.
app.layout = html.Div(children=[
    html.ExampleElement("Example Text"),
    html.AnotherElement("More text")
])
Now, when we visit our app in the browser, we should see a page that looks like this:
Still under construction... :)
Okay okay, we can display HTML. That is fun and all, but let's get to the good stuff and get some cool graphs on the page already!
Remember when we imported dash's core components? Well, we are going to finally use them! We will use the dcc import to create a graph. To do this, we will simply add a third element to our list of children in our app's outer most div.
Creating a graph with dash's core components is very similar to creating a graph using the plotly library. First, we will create a new graph object with dcc.Graph(). The graph object takes a few different attributes. Below we see an example graph object:
dcc.Graph( id = "Example Graph", figure = { data: [ {'x': [1,2,3], 'y': [4,5,6], 'type': "bar", 'name': "Example"}, {'x': [3,2,1], 'y': [6,5,4], 'type': "line", 'name': "Another Example"} ], layout: { 'title': "Example Graph" } }
As we can see, our graph has an `id` attribute. Although we wont be using the ID in this lab, this is a necessary attribute. Next, our graph has a dictionary called `figure`, which has two attributes, `data` and `layout`. Data, is the stuff we want to plot on our graph -- it has data points for the `x` and `y` axes as well as the type of graph and the name of each grouping of data. The figure's layout attribute takes a title so we can give our graph a descriptive title -- pretty simple.
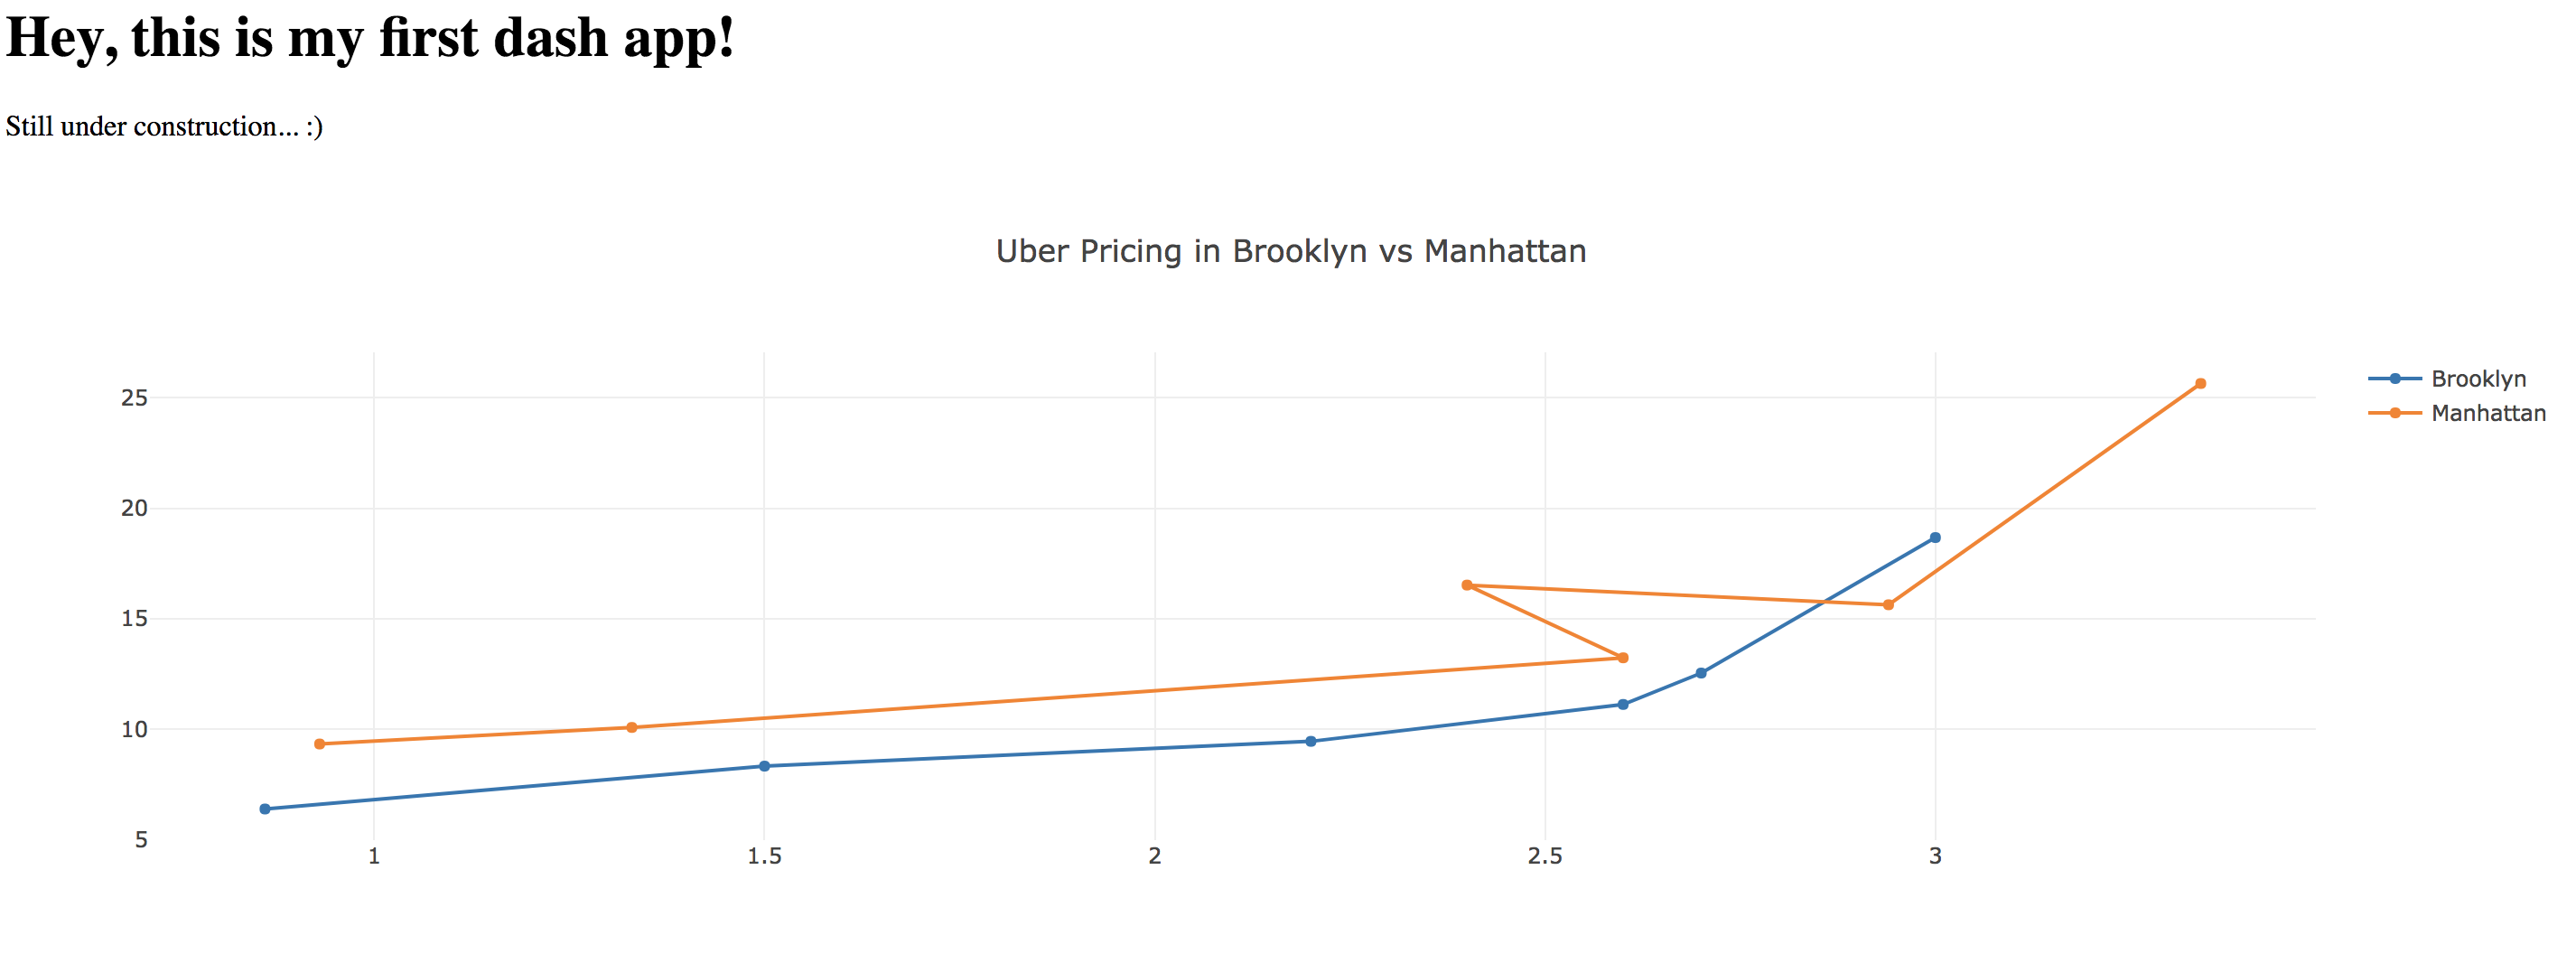
Let's try building this out with the data we already have provided for us in the uber_data.py file. We can either import this data or copy it over to our app.py file. Let's give our graph an `id` of `"uber_pricing_data"`. Also, our graph's title should be `"Uber Pricing in Brooklyn and Manhattan"`. Save our work and view our dash app in the browser again.
## Summary
Great work! We learned how to set up a Dash app in this lab. Then, we added a layout using dash's html components and learned how to create nested html tags on our layout. Finally, we practiced data visualization using dash's core components to create a graph with pre-populated data showing the relationship between distance and price in taxi fares in Brooklyn and Manhattan.


