- Use the debugging features in IntelliJ
We will use IntelliJ as the IDE for walking through a sample debugging session. This guide is assuming that you have already installed IntelliJ and configured it to run some of the sample code we have been going through in this module.
An IDE debugger is a great tool for going through code step by step to try to figure out why something may not be working the way that it is anticipated.
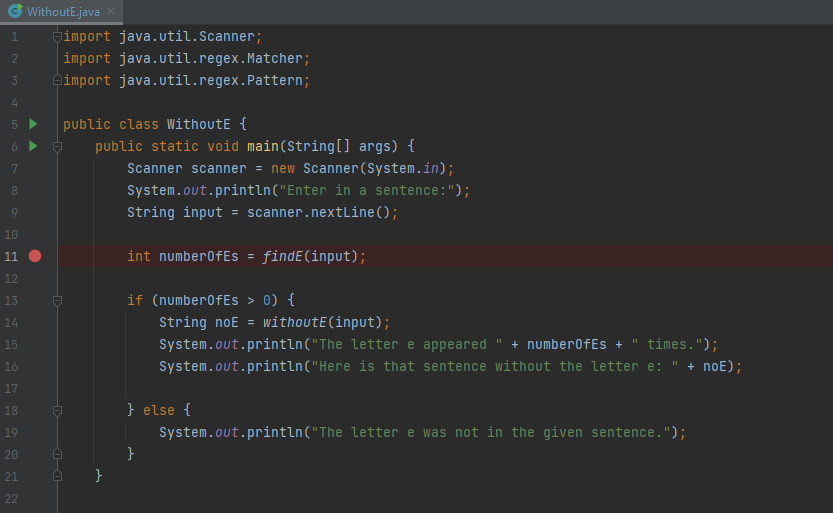
In your project view, navigate to the class you would like to debug and open it
by double-clicking it. Here we have opened our last lab using regular
expressions, WithoutE, from earlier in this module:

Let's run the debugger on this class! When we run the debugger, it will run just like it would if we were to run it with the run command, except that it can stop on specific lines of code and pause the execution of the program. The lines it stops on are lines that we define! These are called breakpoints and can be specified anywhere in the source code.
When a debugger comes across a breakpoint, it will stop and give you control over the execution of the subsequent lines of code.
Before we even set a breakpoint, let us first run our WithoutE class through
the debugger without any breakpoints. To run the debugger, right click on any
empty area in the open file and select the debug option:

You will then the following output:

Notice a different window at the bottom of the IDE with some buttons we haven't seen before. This is a debug console and this will allow us to control what happens when we set a breakpoint. So let's go ahead and set up a breakpoint and have it pause this time, so we can learn more about the options the debugger provides when our program is paused.
In order to set a breakpoint, click anywhere in the open space to the right of the line number in the editor window - a red dot will appear to indicate that you successfully set a breakpoint on that line:
Now run the debugger again, and this time we should see the IDE pause the execution of the program once it gets to that line:
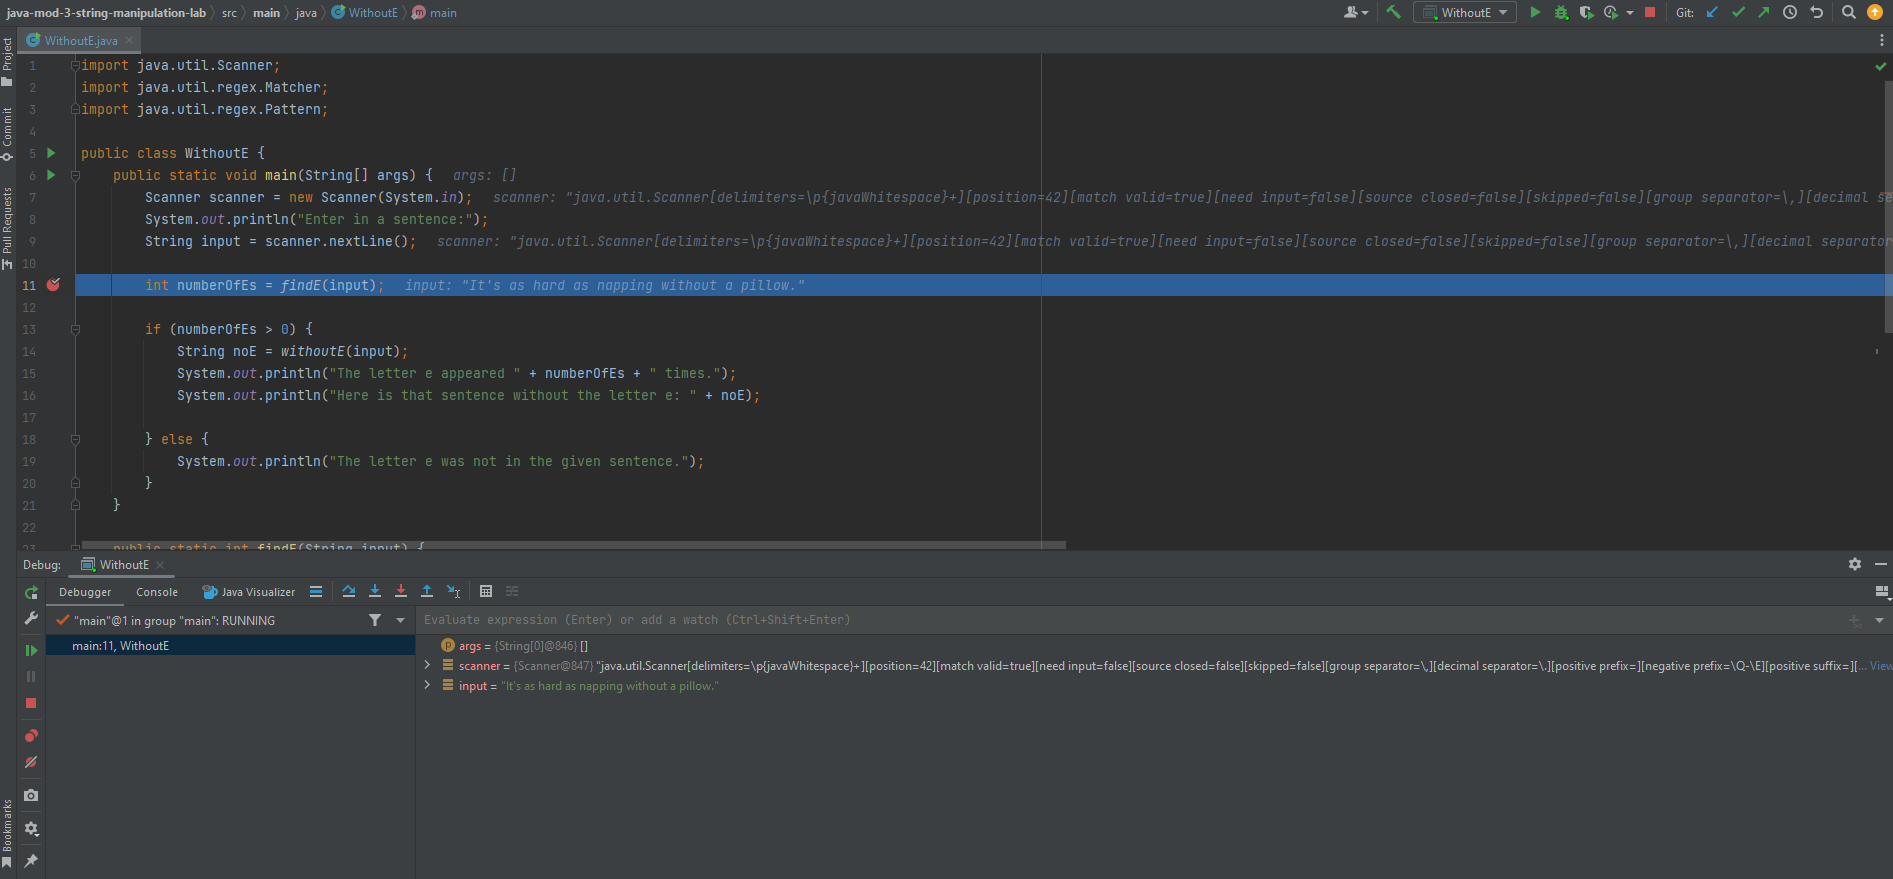
The panel at the bottom of IntelliJ now shows a lot of information to help us understand what's happening in the program and gives us options on how to proceed.
- Execution is currently on line 11.
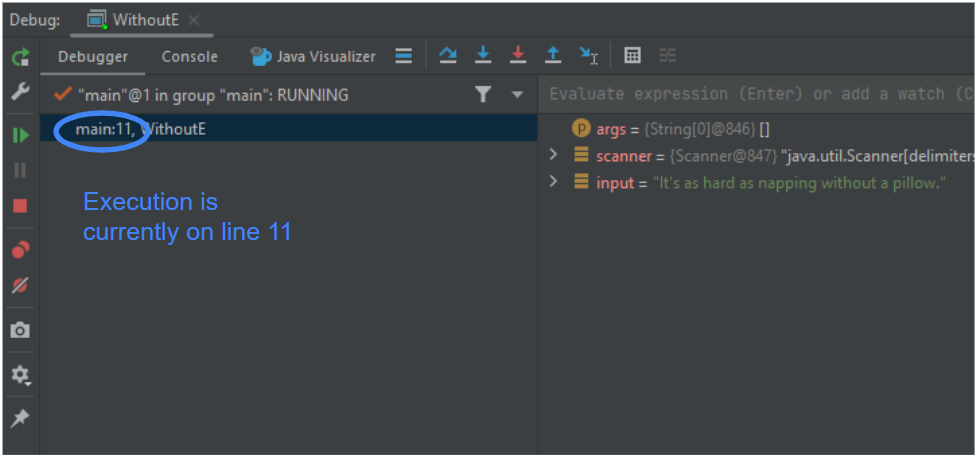
- We can inspect any of the variable values in our program.
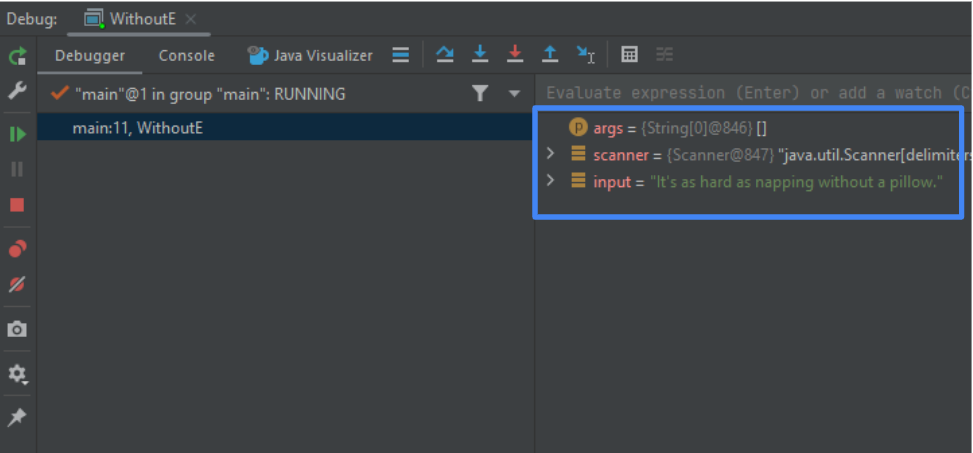
- Once we have inspected all the values we may be interested in, we can choose how to proceed with the execution of the program:

- Step Over (
): runs the current line of code and stops again on the next line.
- Step Into (
): follows the instruction on the current line of code by going into the method that is being called. If the current line does not call a method, then it will behave the same way as the "step over" action.
- Force Step Into (
): use when Step Into doesn't actually go into the call - this happens when the call is to a method in a compiled class (like a
System.out.println()for example). - Step Out (
): finishes the execution of the current method and pauses on the next line in the calling method.
- Run to cursor (
): continues the execution of the program until the debugger reaches the instruction where your cursor is currently positioned.


For our purposes when debugging, we will mostly be using the first two actions: "step-over" and "step-into".
To continue our example, we will proceed by using the "Step Into" option, which
takes us to the findE() method and pauses on the first line:

We can continue running the debugger in this way to step through every line of code and inspect every value in the program.
We can also choose to resume execution of the program or stop the debugger all together. To do so, consider the left-hand side of the debugger panel:

The green play button will resume the execution of the program until it sees another breakpoint or until the program has fully executed if it does not run into another breakpoint. The red stop button will stop the entire execution at that point.
Debugging a great tool to understand what the program is actually doing and to help find the reason(s) it's not doing what we may expect it to do.


