Code Monkey home page Code Monkey logo

stock_analysis_for_quant's Introduction

Hi there. I'm Tin. ๐Ÿ‘‹

Welcome to my page!

๐Ÿ“ซ

Contact

tin-hang

Gmail

If you're finding value in my work and would like to show your appreciation, consider supporting me by 'buying me a coffee.' Your contribution goes a long way in fueling my passion for creating and maintaining quality projects. I truly appreciate any support you can offer. Thank you!

๐Ÿ’ป ๐Ÿ”ข ๐Ÿ”ฃ ๐Ÿค– I love mathematics, statistics, data, programming, data science, machine learning, and deep learning.

๐Ÿ’ต ๐Ÿ’ฐ ๐Ÿ’ธ ๐Ÿ“ˆ ๐Ÿ“‰ I am into investment, finance, and quantitative research.

๐ŸŒฑ I'm addict to learning and growing everyday.

๐Ÿ† GitHub Profile Trophy:

Summary Cards

๐Ÿ“‰ ๐Ÿ“ˆ ๐Ÿ“Š GitHub Stats

Tin's github stats

๐Ÿ’ป GitHub Most Languages Used

Top Langs

Github Top Languages by Repo

Github Top Languages by Commit

GitHub Commit

Repository
Stock Analysis for Quant
Deep Learning Maching Learning Stock
Mathematics for Maching Learning
Simple Stock Analysis in Python
Simple Stock Analysis in R
Data Science

Open source projects

๐Ÿ“ Projects โญ Stars ๐Ÿ’ป Forks โŒ Issues ๐Ÿ“ฌ Pull requests
Stock Analysis For Quant Stars Forks Issues Pull Requests
Deep Learning & Machine Learning for Stock Analysis Stars Forks Issues Pull Requests
Simple Stock Analysis in Python Tutorial Stars Forks Issues Pull Requests

Investment Projects

Repository Links โญ Stars ๐Ÿ’ป Forks
Covid-19 Vaccines Investment Stars Forks
Beverages Long Term Investment Stars Forks
Electrics Cars Investment Stars Forks
Housing & Home Building Investment Stars Forks
Technology Investment Stars Forks
Services Industry Restaurants Investment Stars Forks
AMD vs NVDA Investment Stars Forks

Connect with me:

tin-hang

Gmail

Programming Languages:

Python

R

Matlab

VBA (Visual Basic for Applications)

Software Applications and Tools:

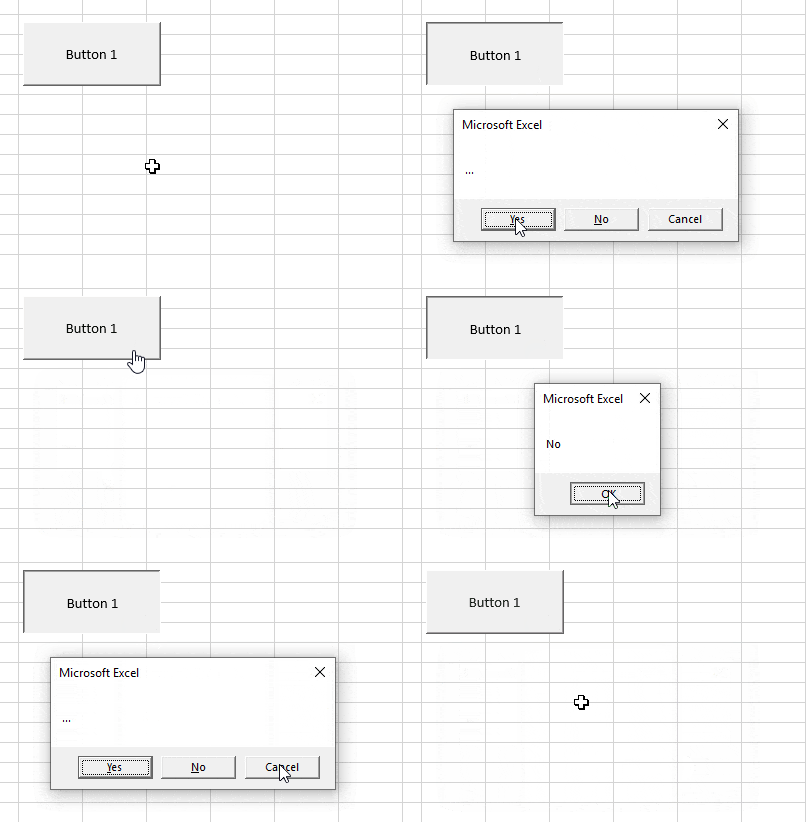
Excel

Power BI

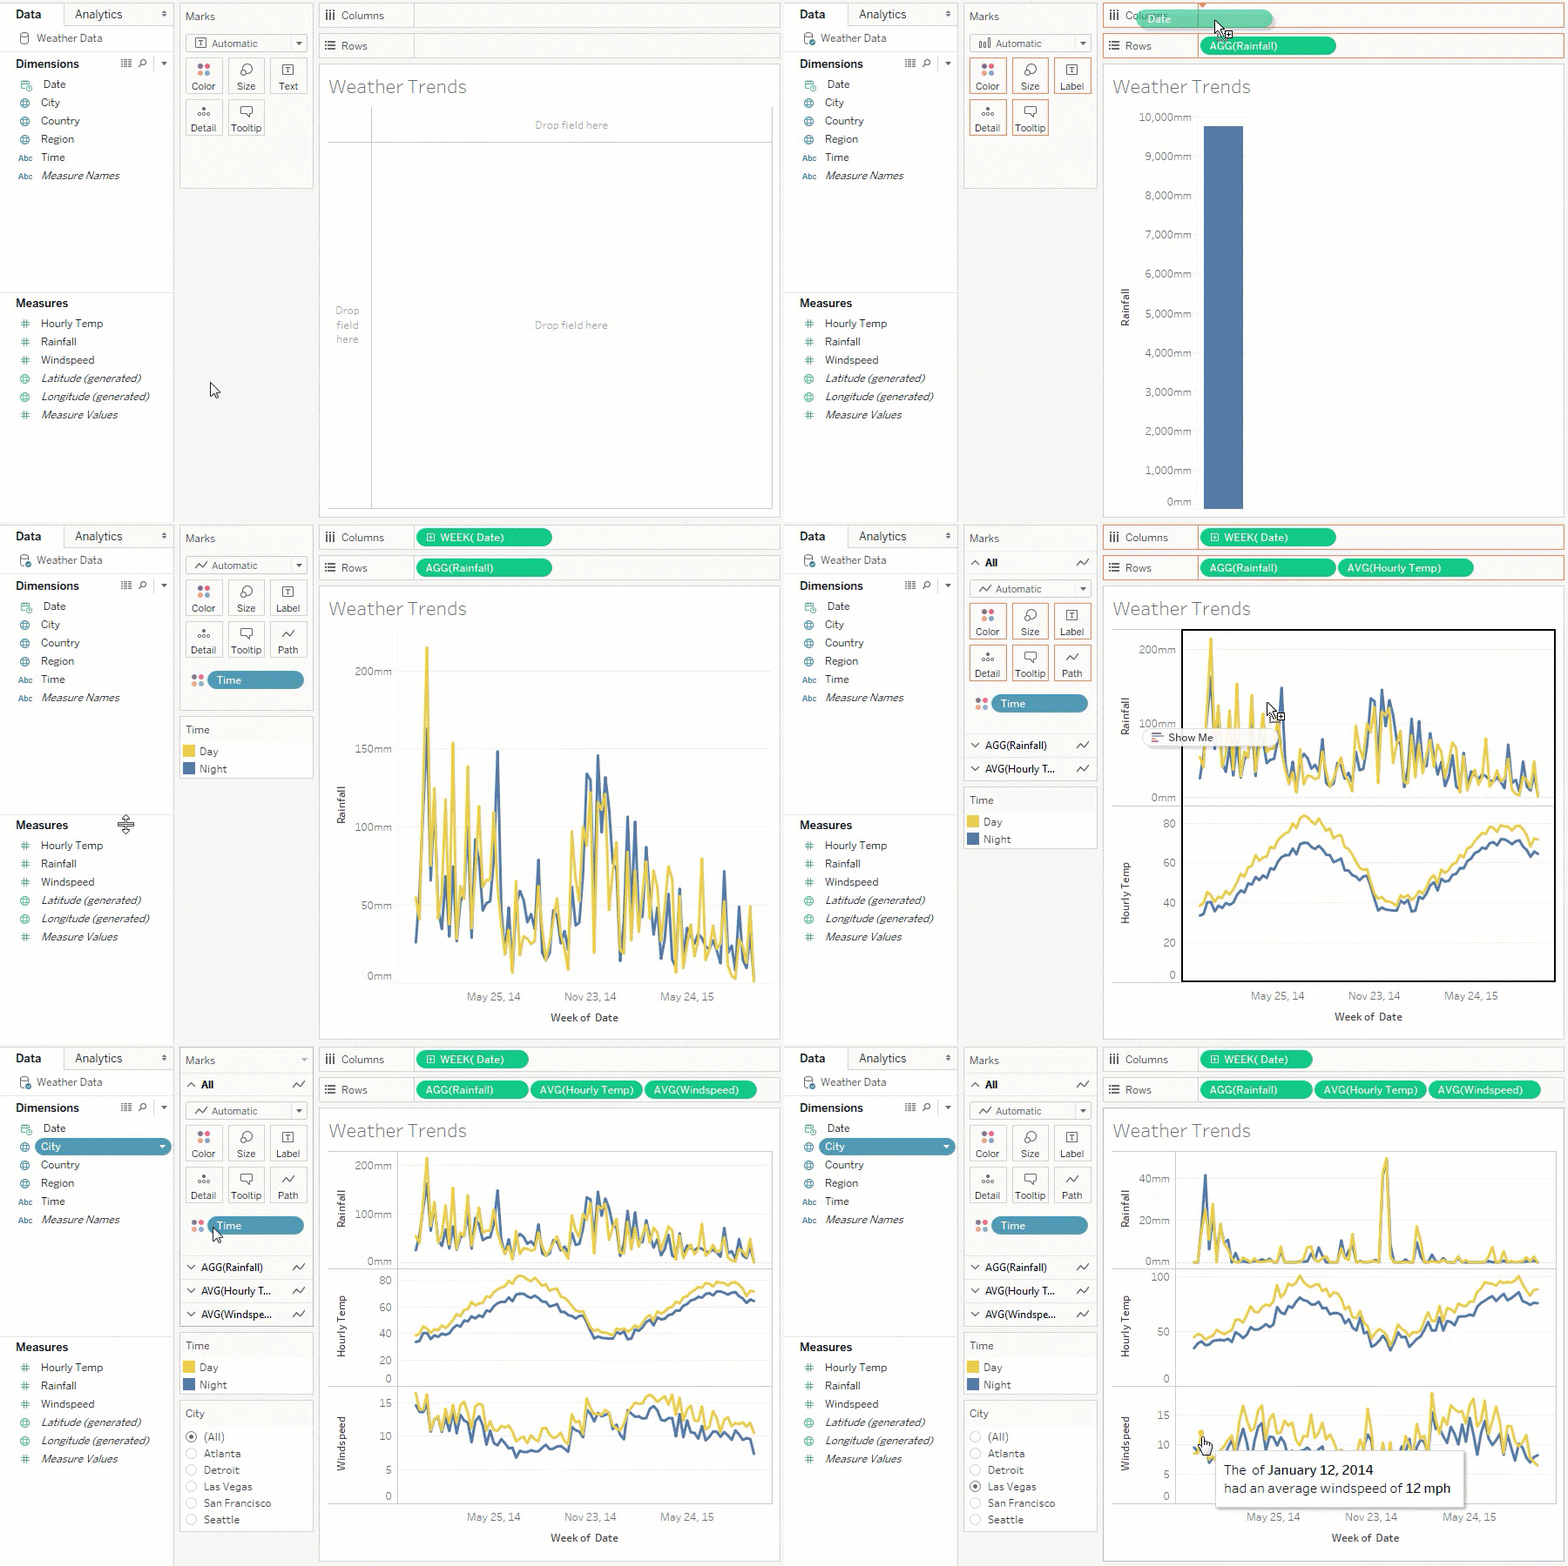
Tableau

Operations System and Software:

Windows 10 Linux Virtual Box Ubuntu

Windows 10 Linux Virtual Box Ubuntu

Programming Languages and Sofwares:

python R Matlab Excel VBA Power BI tableau Nteract Anaconda Spyder Jupyter Notebook Notepad++

python R Matlab Excel VBA Power BI tableau Nteract Anaconda Spyder Jupyter Notebook Notepad++

Please leave a โญ๏ธ if you like or fork my codes or using my repositories for yourself to modify!

๐ŸŒŸ Your Support Matters! ๐ŸŒŸ

If you find my work valuable and wish to contribute, your support means the world to me! You can help fuel my creativity and dedication with a simple gesture โ€“ buying me a coffee! โ˜•

Your generosity goes beyond just a beverage; it's a vote of confidence in my efforts. Whether it's a coffee, a kind comment, or a โญ๏ธ on my work, every bit of support fuels my passion and helps me keep going.

When you choose to donate, your message will be cherished and prominently displayed on my main site. However, please only contribute if it's comfortable for you, as there's no refund system in place. Your donation is entirely optional and deeply appreciated.

Thank you immensely for considering supporting my work. Together, we can keep the creativity flowing!

visitors

stock_analysis_for_quant's People

Contributors

lastancientone avatar

Stargazers

 avatar  avatar  avatar  avatar  avatar  avatar  avatar  avatar  avatar  avatar  avatar  avatar  avatar  avatar  avatar  avatar  avatar  avatar  avatar  avatar  avatar  avatar  avatar  avatar  avatar  avatar  avatar  avatar  avatar  avatar  avatar  avatar  avatar  avatar  avatar  avatar  avatar  avatar  avatar  avatar  avatar  avatar  avatar  avatar  avatar  avatar  avatar  avatar  avatar  avatar  avatar  avatar  avatar  avatar  avatar  avatar  avatar  avatar  avatar  avatar  avatar  avatar  avatar  avatar  avatar  avatar  avatar  avatar  avatar  avatar  avatar  avatar  avatar  avatar  avatar  avatar  avatar  avatar  avatar  avatar  avatar  avatar  avatar  avatar  avatar  avatar  avatar  avatar  avatar  avatar  avatar  avatar  avatar  avatar  avatar  avatar  avatar  avatar  avatar  avatar

Watchers

 avatar  avatar  avatar  avatar  avatar  avatar  avatar  avatar  avatar  avatar  avatar  avatar  avatar  avatar  avatar  avatar  avatar  avatar  avatar  avatar  avatar  avatar  avatar  avatar  avatar  avatar  avatar  avatar  avatar  avatar  avatar  avatar  avatar  avatar  avatar  avatar  avatar  avatar  avatar  avatar  avatar  avatar  avatar  avatar  avatar  avatar  avatar  avatar  avatar  avatar  avatar  avatar  avatar  avatar  avatar  avatar  avatar  avatar  avatar  avatar  avatar  avatar  avatar  avatar

stock_analysis_for_quant's Issues

new complementary tool

My name is Luis, I'm a big-data machine-learning developer, I'm a fan of your work, and I usually check your updates.

I was afraid that my savings would be eaten by inflation. I have created a powerful tool that based on past technical patterns (volatility, moving averages, statistics, trends, candlesticks, support and resistance, stock index indicators).
All the ones you know (RSI, MACD, STOCH, Bolinger Bands, SMA, DEMARK, Japanese candlesticks, ichimoku, fibonacci, williansR, balance of power, murrey math, etc) and more than 200 others.

The tool creates prediction models of correct trading points (buy signal and sell signal, every stock is good traded in time and direction).
For this I have used big data tools like pandas python, stock market libraries like: tablib, TAcharts ,pandas_ta... For data collection and calculation.
And powerful machine-learning libraries such as: Sklearn.RandomForest , Sklearn.GradientBoosting, XGBoost, Google TensorFlow and Google TensorFlow LSTM.

With the models trained with the selection of the best technical indicators, the tool is able to predict trading points (where to buy, where to sell) and send real-time alerts to Telegram or Mail. The points are calculated based on the learning of the correct trading points of the last 2 years (including the change to bear market after the rate hike).

I think it could be useful to you, to improve, I would like to share it with you, and if you are interested in improving and collaborating I am also willing, and if not file it in the box.

pyflux error

wind 10
python 3.10

1).pycharm 2022.2:
-note: This error originates from a subprocess, and is likely not a problem with pip.
-error: legacy-install-failure

2).win10 CMD
-note: This error originates from a subprocess, and is likely not a problem with pip.
-error: legacy-install-failure
ร— Encountered error while trying to install package.
โ•ฐโ”€> pyflux

note: This is an issue with the package mentioned above, not pip.
hint: See above for output from the failure.

Trade Intensity indicator (TII)

Hi all, it would be useful to also have the Trade Intensity Indicator (TII) in the Technical_Analysis.xlsx spredsheet, do you think it is possible to implement it? many tks

Considered including Options?

You have done a great job including almost everything there is. I would love to help you with this repo and include Options and options trading strategies in this wonderful repo. @LastAncientOne

RSI.ipynb: TypeError: dtype '<class 'datetime.date'>' not understood

First of all, thanks for this large compendium of technical indicators, it's very useful.

I'm trying to run RSI.ipynb and when opened and ran in Colab, and I've got the following error:

TypeError: dtype '<class 'datetime.date'>' not understood

in the following cell:

from matplotlib import dates as mdates
import datetime as dt

dfc = df.copy()
dfc['VolumePositive'] = dfc['Open'] < dfc['Adj Close']
#dfc = dfc.dropna()
dfc = dfc.reset_index()
dfc['Date'] = mdates.date2num(dfc['Date'].astype(dt.date)) // <!-- Issue with this line.
dfc.head()

My questions:

  • What version of datetime you've used to run this notebook?
  • What do you suggest to fix it? Downgrading datetime to a different version, or the code should fixed forward?

Colab: https://colab.research.google.com/github/LastAncientOne/Stock_Analysis_For_Quant/blob/master/Python_Stock/Technical_Indicators/RSI.ipynb

Thanks.

Questions regarding the document

  1. For the "lazy portfolio" strategies, what are the fastest way to do backtesting and analysis? Lists like This, This, and This exists https://github.com/LastAncientOne/Stock_Analysis_For_Quant/blob/master/README.md#list-of-portfolio-strategies
  2. Are all of the risk factors in QuantStats essential, or are some of them correlated enough such that some are redundant? https://github.com/LastAncientOne/Stock_Analysis_For_Quant/blob/master/README.md#list-of-risk-adjusted-returns-ratios-measurement
  3. Are visualization a good idea for explaining stocks like PCA, Temporal Heatmaps, Correlative Networks, and Other Tools?
  4. How does the state of the market correlate with risk and return? https://gmarti.gitlab.io/qfin/2020/02/03/sp500-sharpe-vs-corrmats.html

Python TA HeatMap Analysis/Inference

Hello @LastAncientOne , you have done really great work in maintaining this repository.
I was wondering if you can share any reference or any reading item so we can understand how to analyse heat map generated by python TA notebook.
As a beginner, the amount of data seems intimidating :)

Recommend Projects

  • React photo React

    A declarative, efficient, and flexible JavaScript library for building user interfaces.

  • Vue.js photo Vue.js

    ๐Ÿ–– Vue.js is a progressive, incrementally-adoptable JavaScript framework for building UI on the web.

  • Typescript photo Typescript

    TypeScript is a superset of JavaScript that compiles to clean JavaScript output.

  • TensorFlow photo TensorFlow

    An Open Source Machine Learning Framework for Everyone

  • Django photo Django

    The Web framework for perfectionists with deadlines.

  • D3 photo D3

    Bring data to life with SVG, Canvas and HTML. ๐Ÿ“Š๐Ÿ“ˆ๐ŸŽ‰

Recommend Topics

  • javascript

    JavaScript (JS) is a lightweight interpreted programming language with first-class functions.

  • web

    Some thing interesting about web. New door for the world.

  • server

    A server is a program made to process requests and deliver data to clients.

  • Machine learning

    Machine learning is a way of modeling and interpreting data that allows a piece of software to respond intelligently.

  • Game

    Some thing interesting about game, make everyone happy.

Recommend Org

  • Facebook photo Facebook

    We are working to build community through open source technology. NB: members must have two-factor auth.

  • Microsoft photo Microsoft

    Open source projects and samples from Microsoft.

  • Google photo Google

    Google โค๏ธ Open Source for everyone.

  • D3 photo D3

    Data-Driven Documents codes.