Code Monkey home page Code Monkey logo

tableau-dashboard-with-amazing-mart's Introduction

Tableau-Dashboard-with-Amazing-Mart

Analyzing the data and finding which customers are profitable, creating the dashboard.

Step by Step Analysis of Data

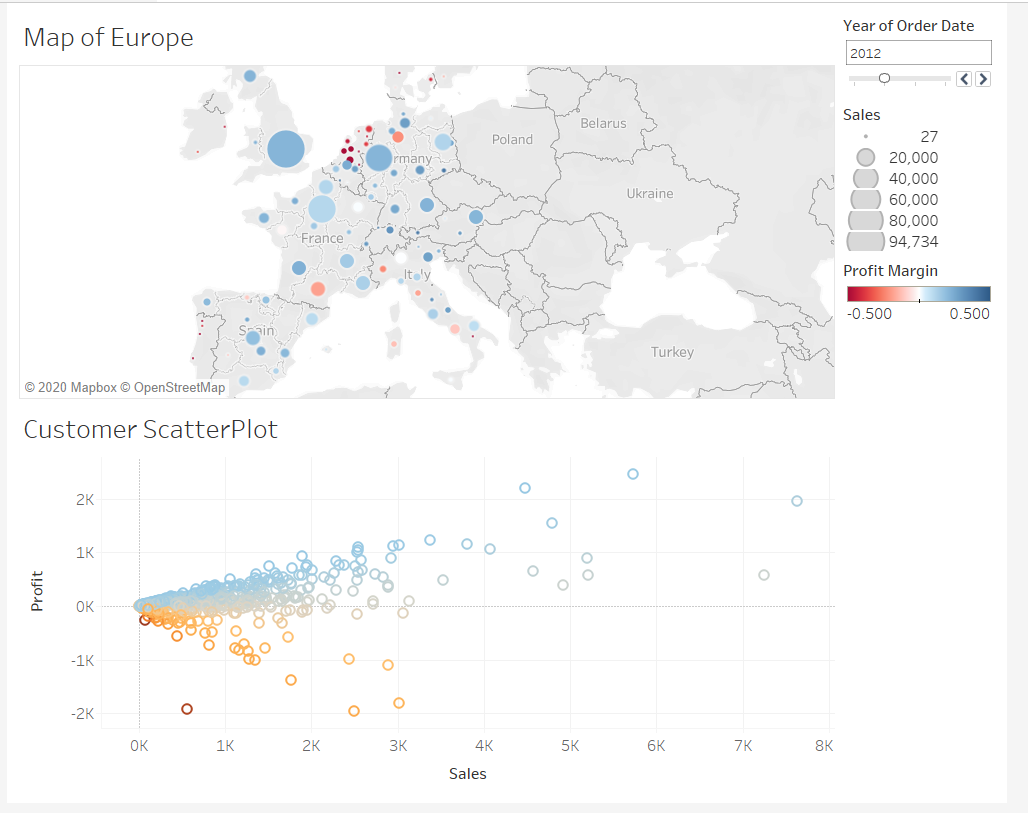
  1. Map Based on Longititude and Latitude. Color Shows Profit Margin. Size shows sum of Sales. Details are shown for Country and State. The data is filtered on Order Date Year, which keeps 2012

alt text

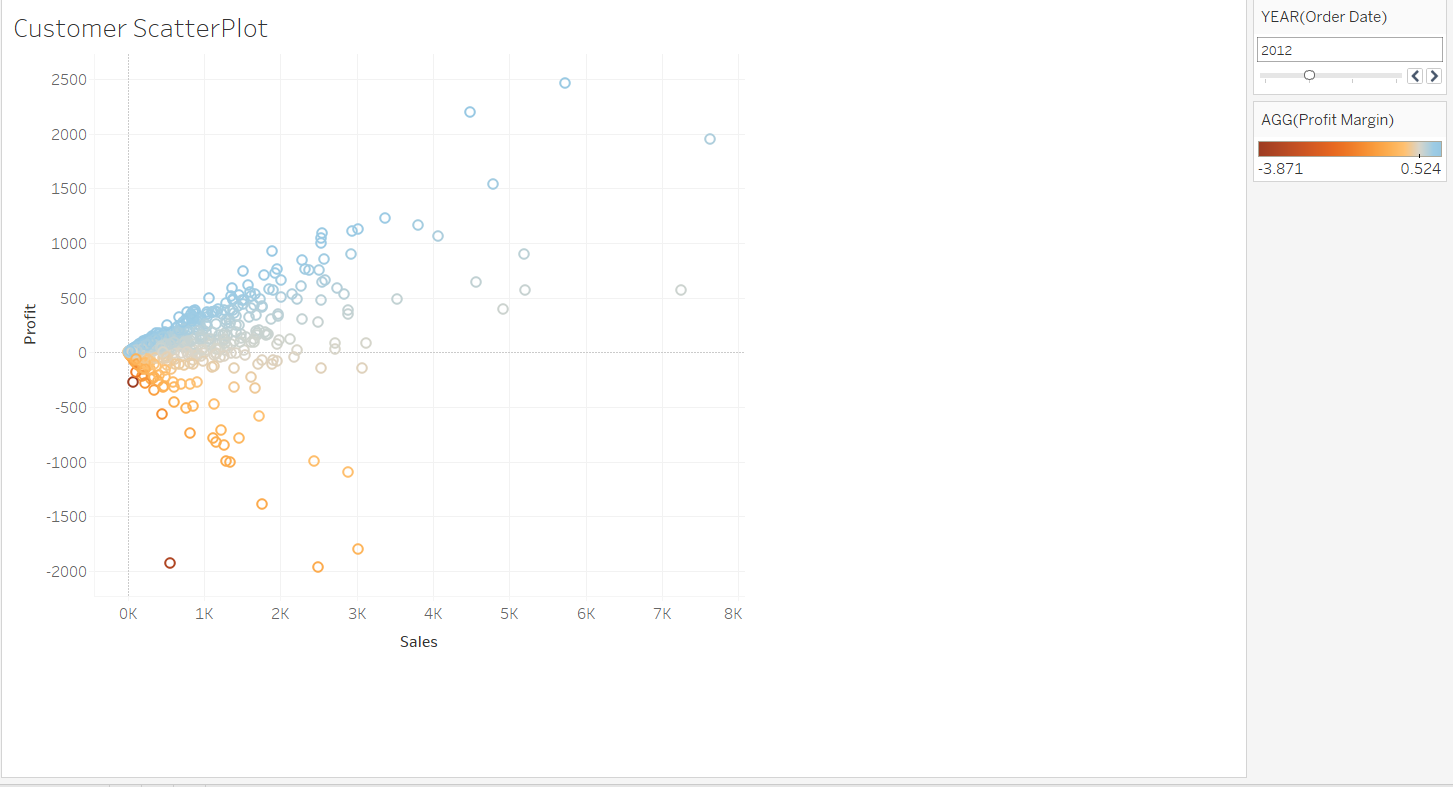
  1. Sum of Sales vs Sum of Profit. Color shows profit margin. Details are shown for Customer Name, Country and State. The data is filtered on Order Date Year, which keeps 2012

alt text

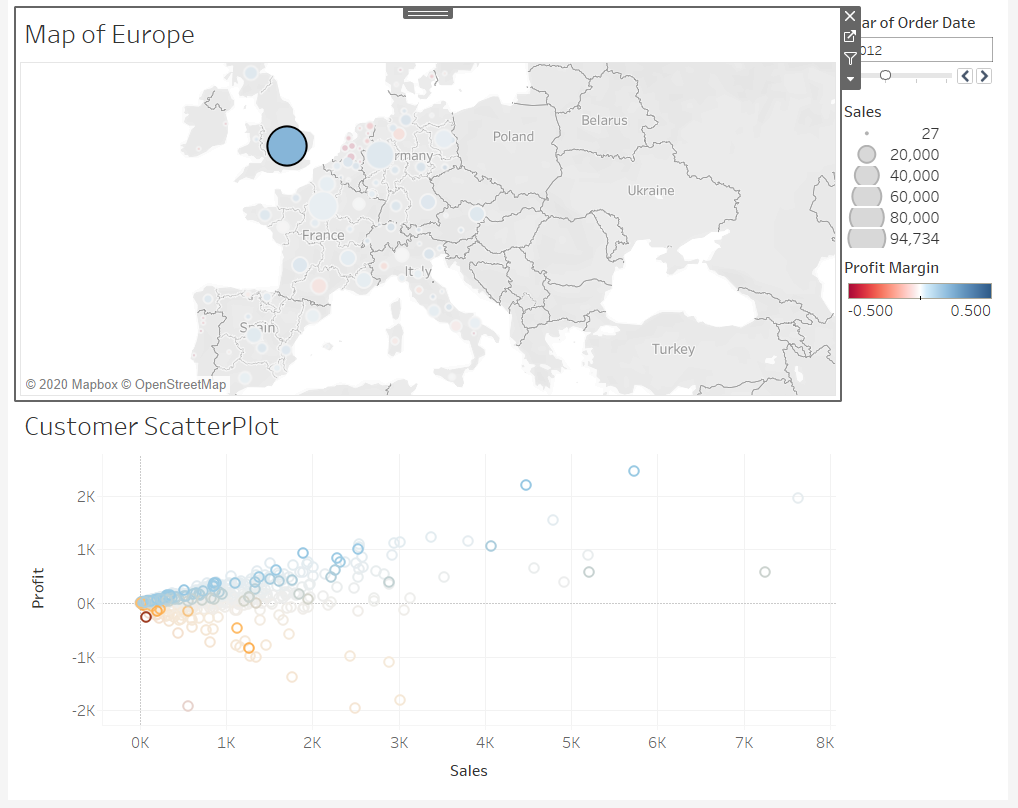
  1. Dashboard, Combination of both Map of Europe and Customer Scatter Plot.

alt text

  1. Actions of Filters, By selecting particular region data will be filtered in the Customer Scatter Plot.

alt text

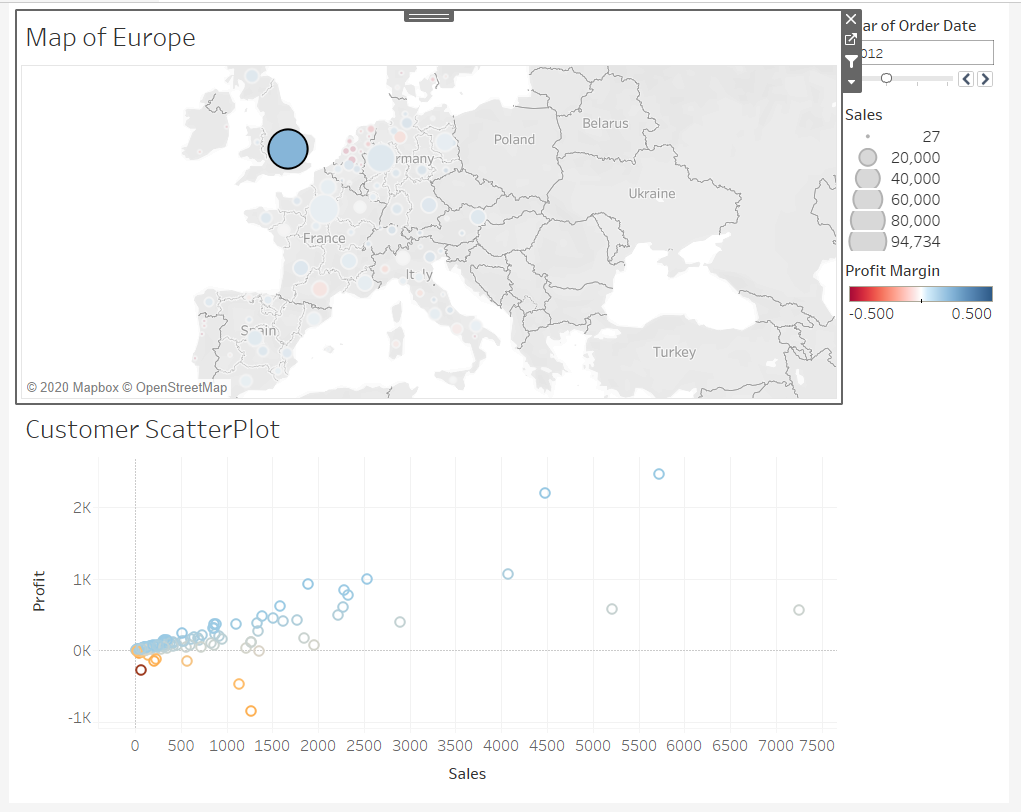
  1. Actions of Highlight, By selecting particular region data will be highlighted in the Customer Scatter Plot.

alt text

tableau-dashboard-with-amazing-mart's People

Contributors

kishore117 avatar

Watchers

 avatar

Recommend Projects

  • React photo React

    A declarative, efficient, and flexible JavaScript library for building user interfaces.

  • Vue.js photo Vue.js

    ๐Ÿ–– Vue.js is a progressive, incrementally-adoptable JavaScript framework for building UI on the web.

  • Typescript photo Typescript

    TypeScript is a superset of JavaScript that compiles to clean JavaScript output.

  • TensorFlow photo TensorFlow

    An Open Source Machine Learning Framework for Everyone

  • Django photo Django

    The Web framework for perfectionists with deadlines.

  • D3 photo D3

    Bring data to life with SVG, Canvas and HTML. ๐Ÿ“Š๐Ÿ“ˆ๐ŸŽ‰

Recommend Topics

  • javascript

    JavaScript (JS) is a lightweight interpreted programming language with first-class functions.

  • web

    Some thing interesting about web. New door for the world.

  • server

    A server is a program made to process requests and deliver data to clients.

  • Machine learning

    Machine learning is a way of modeling and interpreting data that allows a piece of software to respond intelligently.

  • Game

    Some thing interesting about game, make everyone happy.

Recommend Org

  • Facebook photo Facebook

    We are working to build community through open source technology. NB: members must have two-factor auth.

  • Microsoft photo Microsoft

    Open source projects and samples from Microsoft.

  • Google photo Google

    Google โค๏ธ Open Source for everyone.

  • D3 photo D3

    Data-Driven Documents codes.