Paper: Di Jin, Ryan A. Rossi, Eunyee Koh, Sungchul Kim, Anup Rao, Danai Koutra. Latent Network Summarization: Bridging Network Embedding and Summarization. ACM SIGKDD International Conference on Knowledge Discovery and Data Mining (KDD), 2019.
Link: https://gemslab.github.io/papers/jin-2019-latent.pdf
Citation (bibtex):
@inproceedings{DBLP:conf/kdd/JinRKKRK19,
author = {Di Jin and
Ryan A. Rossi and
Eunyee Koh and
Sungchul Kim and
Anup Rao and
Danai Koutra},
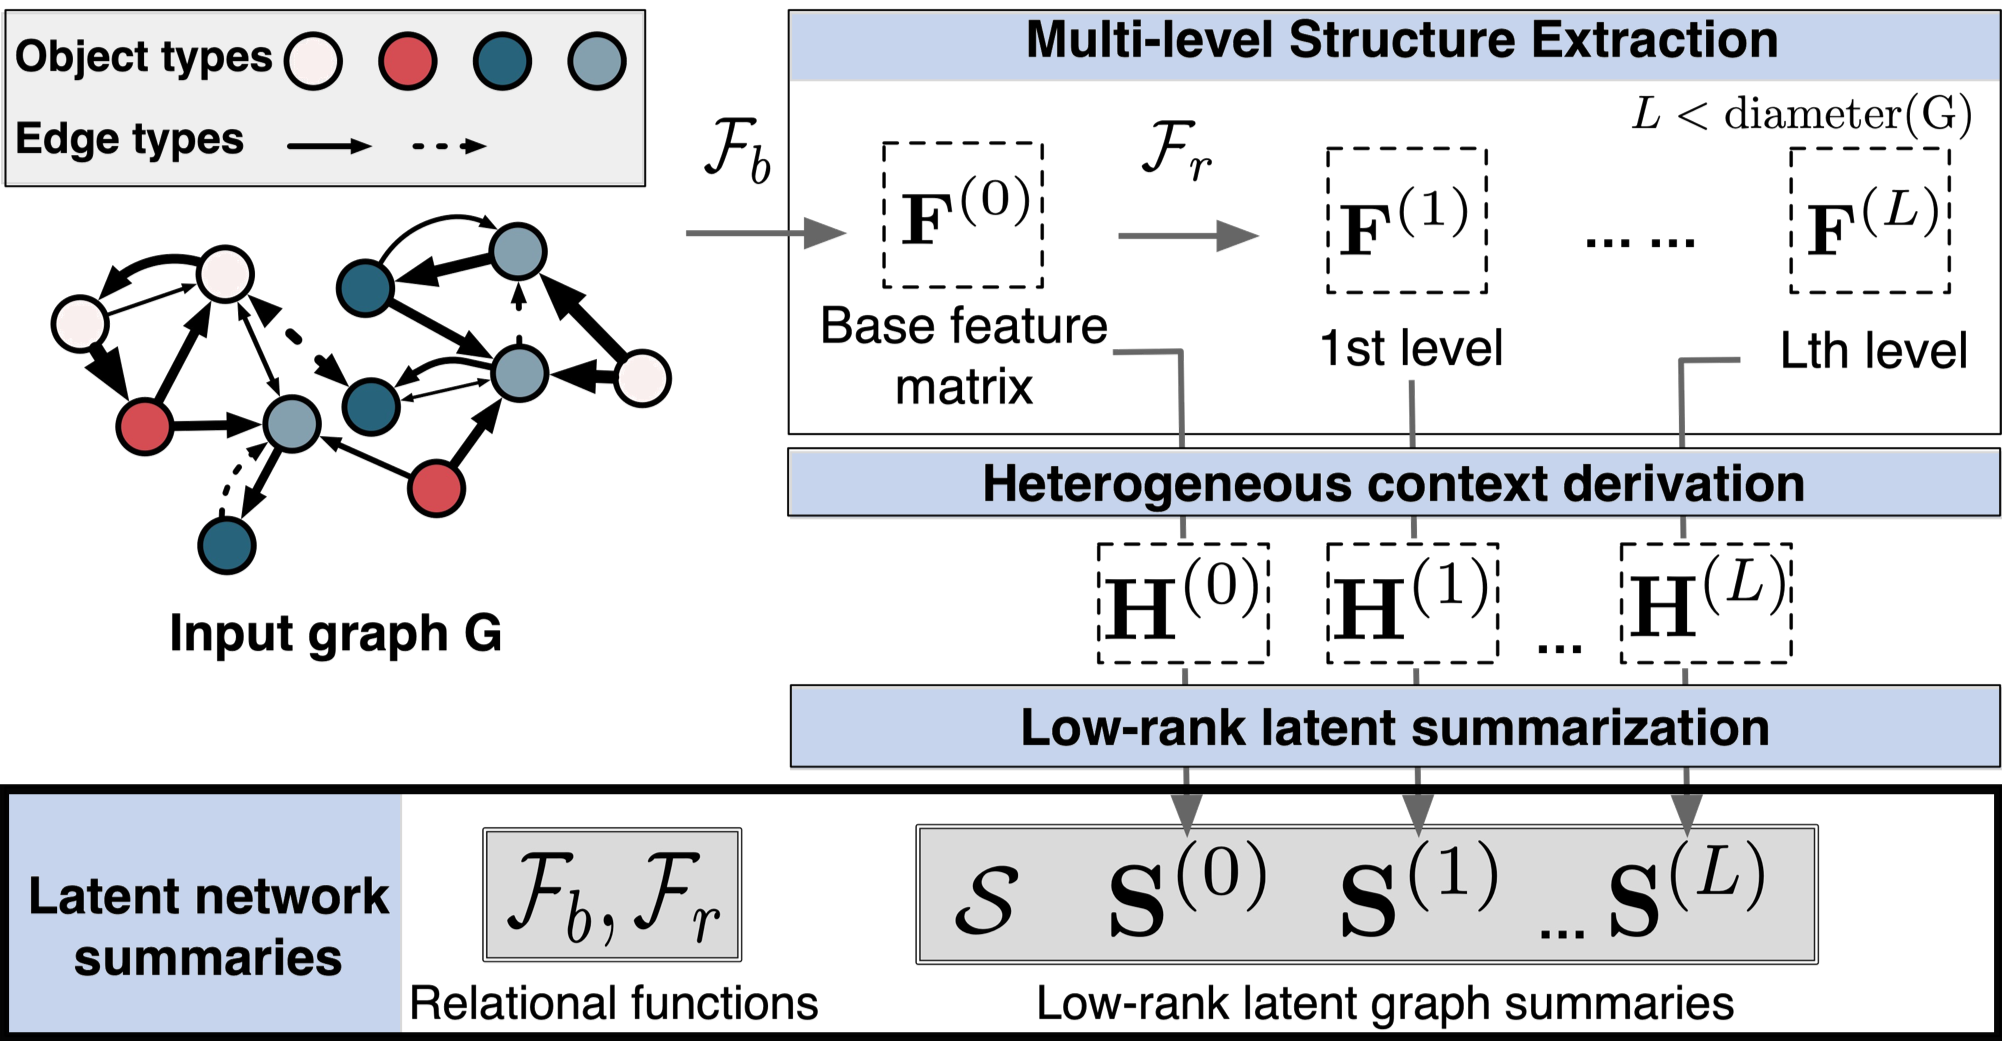
title = {Latent Network Summarization: Bridging Network Embedding and Summarization},
booktitle = {Proceedings of the 25th {ACM} {SIGKDD} International Conference on
Knowledge Discovery {\&} Data Mining, {KDD} 2019, London, UK,
August 4-8, 2019},
year = {2019},
}
MultiLENS takes two files as input, the graph file and the category file.
The input graph file can be either static or temporal edge list in the following format separated by tab:
<src> <dst> <weight> <timestamp> (optional)
MultiLENS will automatically determine if the input graph is static or temporal. The edge list is assumed to be re-ordered consecutively from 0, i.e., the minimum node ID is 0, and the maximum node ID is <#node - 1>. A toy static graph is under "/graph/" directory.
The category file is a mapping between the node ID and its type (e.g., IP, cookie, web agent) with the following format separated by tab:
<category> <id_initial> <id_ending>
if the node IDs are grouped by the type, where <id_initial> and <id_ending> are the starting and ending node ids in type <category>
For example,
0 0 279629
1 279630  283182
means node 0, 1, ... 279629 are in type 0, node 279630, 279631, ... 283182 are in type 1.
But if the node IDs are not grouped by the types, this implementation also supports the following format separated by tab:
<category> <node_id>
which is just the 1-1 mapping. The code accepts either format.
The complete command to run MultiLENS is as follows.
python main.py --input <graph_file_path> --cat <category_file_path> --output <embedding_file_path> --dim <embedding_dimension>
  --L <#level> --base <constant of logarithm binning> --operators <relational_operators_to_use>
- input, the input graph file stated under the "Graph Input" section above. Default value: '../graph/test.tsv'
- cat, the input category file stated under the "Graph Input" section above. Default value: '../graph/test_cat.tsv'
- output, the ouput file path of the embeddings. Default value: '../emb/test_emb.txt'
- dim, the dimension of the embeddings. Default value: 128
- L, the maximum subgraph order. Default value: 2
- base, the base constant of logarithm binning. Default value: 4
- operators, a list of relational operators to use. Use the command such as
--operators 'mean','sum'to specify which operators to use. Default value: ['mean', 'var', 'sum', 'max', 'min', 'L1', 'L2']
In addition to embedding file indicated in the path output, MultiLENS also outputs "latent_summary.pkl", which is the latent graph summary file that can be used for inductive learning tasks.
This repo also provides the python script to perform inductive learnings, i.e., deriving node embeddings from the latent summary on the fly. The commands to run it is as follows:
python main_inducitve.py --input <graph_file_path> --cat <category_file_path> --summary <latent_summary_file> --output <embedding_file_path>
  --dim <embedding_dimension> --L <#level> --base <constant of logarithm binning> --operators <relational_operators_to_use>
In addition to the identical arguments shown above, MultiLENS takes summary as the input:
- summary, the input latent graph summary file derived on the (same/different) graph. Default value: './latent_summary.pkl'
- output. Default value: './emb/test_emb_ind.txt'
One may also set the variable "check_difference" in "main_inducitve.py" to compute the sum of node-wise distances (Frobenius norm) to measure graph difference.
If you encounter any problems running the code, pls feel free to contact Di Jin ([email protected])