Code Monkey home page Code Monkey logo

jygraphview's Introduction

JYGraphView


29.03.15 - Updated for Apple Watch!

I've added a method to the class (graphImage) that can return a snapshot of the graph (as a UIImage) which can be used on the Apple Watch. You'll need to make some adjustments to the font size and stroke width but it's fun to experiment! Take a look at the sample app for examples.

Typical usage:

 JYGraphView *graph = [[JYGraphView alloc] initWithFrame:rect];
 graph.graphData = data;
 graph.strokeColor = [UIColor orangeColor];
 graph.hidePoints = YES;
 graph.hideLabels = YES;
 graph.barColor = [UIColor clearColor];
 [graph plotGraphData];
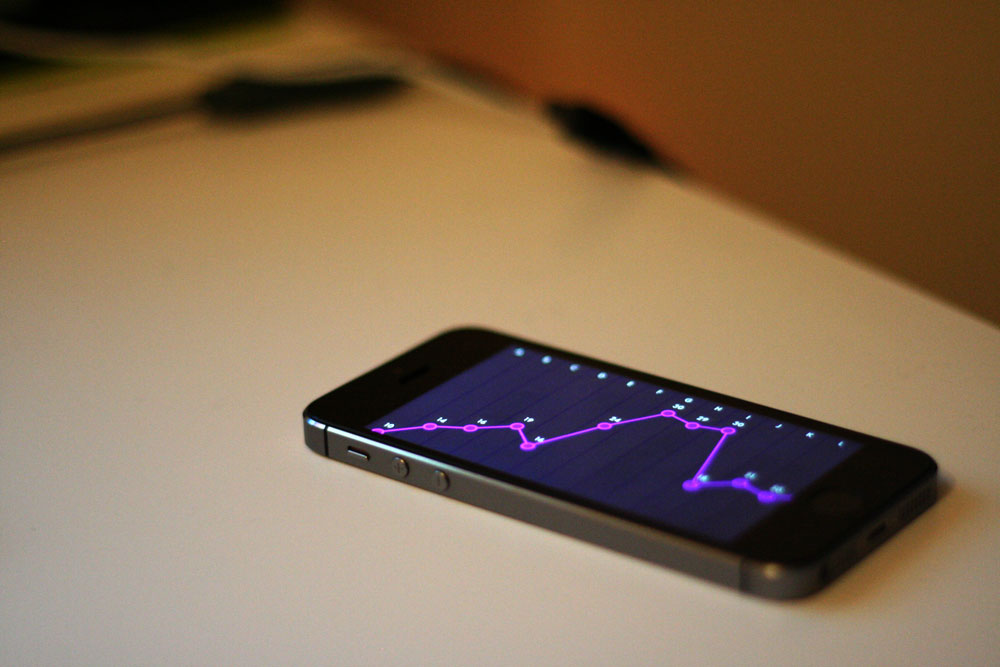
 [interfaceGroup setBackgroundImage:[graph graphImage]];

JYGraphView is an easy way to graph data in a simple, minimalist style and is highly customisable.

Intro

JYGraphView is a slightly adapted version of the graph that appears in Tempo/Weather. JYGraphView is a sublass of UIScrollView.

You can get one on screen easily using code:

JYGraphView *graphView = [[JYGraphView alloc] initWithFrame:frame];

// Set the data for the graph
graphView.graphData = @[@2,@4,@5,@7,@8,@10,@10,@10,@12,@10,@20,@21];

// Set the xAxis labels (optional)
graphView.graphXAxisLabels = @[@"Jan",@"Feb",@"Mar",@"Apr",@"May",@"Jun",@"Jul",@"Aug",@"Sep",@"Oct",@"Nov",@"Dec"];

[self.view addSubview:graphView];

Alternatively, if you use xibs you can drop a UIView into your xib > Identity Inspector > change the class name to JYGraphView.

If you don't set any of the colours, fonts, etc, the graph will be displayed in its default style (same as Tempo/Weather).

The default content width of the graphView is twice the width of the frame. You can set your own width to either narrower or wider values simply by setting graphWidth before calling .

NB The graph gets drawn on UIView's didMoveToSuperview, but in case you need to manually refresh the graph (if new data comes in) you can call it using plotGraphData like so:

graphView.graphData = newDataArray;

[graphView plotGraphData];

Files you'll need

Drag the following files into your project:

  • JYGraphView.h
  • JYGraphView.m
  • JYGraphPoint.h
  • JYGraphPoint.m

By default the graph uses a UIView subclass (JYGraphPoint) to draw each point.

Customisation

NB. I highly recommend you download the sample project and run it on a device or in the simulator to play around with the customisation options (it looks better on iPad).

If you wish to customise the look of the graph a bit, you can set the strokeColor and fillColor with any UIColor before you present the graph.

graphView.pointFillColor = [UIColor colorWithRed:0.21 green:0.00f blue:0.40 alpha:1.0];
graphView.strokeColor = [UIColor colorWithRed:0.53 green:0.00 blue:0.98 alpha:1.0];

You can further customise the graphView by setting the following before calling plotGraphData:

backgroundColor, barColor, labelFont, labelFontColor, labelBackgroundColor, strokeWidth, hidePoints, useCurvedLine and hideLabels.

You can opt to hide the lines, points or labels setting their respective properties to NO.

You can opt for the curved line that uses the Catmull-Rom spline by setting useCurvedLine to YES. Default is NO.

So a fully customised graph might look something like this:

// Customisation options
graphView.fillColor = [UIColor colorWithRed:0.94 green:0.32 blue:0.59 alpha:1.0];
graphView.strokeColor = [UIColor darkGrayColor];
graphView.useCurvedLine = YES;
graphView.graphWidth = 720;
graphView.backgroundColor = [UIColor grayColor];
graphView.barColor = [UIColor lightGrayColor];
graphView.labelFont = [UIFont fontWithName:@"AvenieNextCondensed-Regular" size:12];
graphView.labelFontColor = [UIColor whiteColor];
graphView.labelBackgroundColor = [UIColor grayColor];

Some examples of customised graphs:

What the graph view actually does

The graph takes your numbers, works out the range, translates them into coordinates, then draws the elements:

  • background bar (which is actually a label)
  • the line joining the points
  • the label above each point
  • and finally, the points

Possible use case

  1. Use the motion chip on the iPhone to show step counter data for the last 7/10/30 days
  2. Link it to your app sales and show the trend for the last 30 days/12 months
  3. Use it in your weather app to show predicted temperature for the next 24 hours/7 days

Known issues

  1. No tests. I know. I'm a bad programmer.

Thanks

First of all I would be thrilled if someone used this in their project and let me know about it. Secondly, I would be equally thrilled if someone gets in touch with ways in which to improve JYGraphView.

You can email me ([email protected]) or get in touch on Twitter @johnyorke

License

MIT License (enclosed in project folder). So in other words...fill ya' boots!

jygraphview's People

Stargazers

 avatar  avatar  avatar  avatar  avatar  avatar  avatar  avatar  avatar  avatar  avatar  avatar  avatar  avatar  avatar  avatar  avatar  avatar  avatar  avatar  avatar  avatar  avatar  avatar  avatar  avatar  avatar  avatar  avatar  avatar  avatar  avatar  avatar  avatar  avatar  avatar  avatar  avatar  avatar  avatar  avatar  avatar  avatar  avatar  avatar  avatar  avatar  avatar  avatar  avatar  avatar  avatar  avatar  avatar  avatar  avatar  avatar  avatar  avatar  avatar  avatar  avatar  avatar  avatar  avatar  avatar  avatar  avatar  avatar  avatar  avatar  avatar  avatar  avatar  avatar  avatar  avatar  avatar  avatar  avatar  avatar  avatar  avatar  avatar  avatar  avatar  avatar  avatar  avatar  avatar  avatar  avatar  avatar  avatar  avatar  avatar  avatar  avatar  avatar  avatar

Watchers

 avatar  avatar  avatar  avatar  avatar  avatar  avatar  avatar  avatar

jygraphview's Issues

Cocoapod?

It would be great if this library was published as a Cocoapod.

Clear View before plot a second time

I have noticed that if you call plotGraphData more than one time, the view maintains the previous drawing plus the new one.
How can avoid this?
I would like use this for a real time graph.
Thank you!

Removing Previously Drawn Graph Lines Without Reallocated (Programmatic Allocation)

Hey guys! I have to first say, this is a GREAT and easy-to-use custom class. A job well done!

One issue I had with it though. When programmatically defining a JYGraphView, and throwing it into a ViewDidLoad, I didn't want to reallocate my instance every time to remove the previously drawn lines with the updated Graph Data. So I created this method inside of JYGraphView. I was going to make a pull request, but I found out this was a private repo. So, here's the code. Figured anyone else that ran into the same problem could use it too:

// Used to clear previously drawn sublayers, or lines, and replots graph
// Be sure to update your JYGraphView's graphData and graphDataLabels before calling this

  • (void)redrawGraphAfterUpdatingGraphData
    {
    [[self layer] setSublayers: nil];
    [self plotGraphData];
    }

Feel free to add this to your repo for JYGraphView!

screen shot 2016-01-25 at 6 46 06 pm

The mechanism about drawing curving lines

Great work. I have been reading the code and quite interested in

drawCurvedLineBetweenPoints

What is the theory behind the following code? I understand it is drawing curving lines. But I am wondering why the following code draws smooth curving lines. Maths! ;)

    for (int index = 1; index < points.count - 2 ; index++) {

        CGPoint point0 = [self pointAtIndex:index - 1 ofArray:points];
        CGPoint point1 = [self pointAtIndex:index ofArray:points];
        CGPoint point2 = [self pointAtIndex:index + 1 ofArray:points];
        CGPoint point3 = [self pointAtIndex:index + 2 ofArray:points];

        for (int i = 1; i < granularity ; i++) {
            float t = (float) i * (1.0f / (float) granularity);
            float tt = t * t;
            float ttt = tt * t;

            CGPoint pi;
            pi.x = 0.5 * (2*point1.x+(point2.x-point0.x)*t +
                          (2*point0.x-5*point1.x+4*point2.x-point3.x)*tt +
                          (3*point1.x-point0.x-3*point2.x+point3.x)*ttt)
            ;
            pi.y = 0.5 * (2*point1.y+(point2.y-point0.y)*t +
                          (2*point0.y-5*point1.y+4*point2.y-point3.y)*tt +
                          (3*point1.y-point0.y-3*point2.y+point3.y)*ttt);

            if (pi.y > self.graphView.frame.size.height) {
                pi.y = self.graphView.frame.size.height;
            }
            else if (pi.y < 0){
                pi.y = 0;
            }

            if (pi.x > point0.x) {
                [path addLineToPoint:pi];
            }
        }

        [path addLineToPoint:point2];
    }

Append/dynamic values?

Hi. I was wondering if this is set up to handle dynamically adding data. I would like to add real time capabilities to it and wanted to check first if that's something included

Thanks!

Having trouble using it on the watch

I'm trying to use the graphing on the watch but when I copy the four files you mention I'll need it runs into compile error saying that it can't find UIView. From what I read UIView is not available on the WatchKit. I'm trying to compare with your demo app but can't see where/how I can make the changes so that JYGraphView and JYGraphPoint files don't give me errors. Your help is much appreciated.

Recommend Projects

  • React photo React

    A declarative, efficient, and flexible JavaScript library for building user interfaces.

  • Vue.js photo Vue.js

    ๐Ÿ–– Vue.js is a progressive, incrementally-adoptable JavaScript framework for building UI on the web.

  • Typescript photo Typescript

    TypeScript is a superset of JavaScript that compiles to clean JavaScript output.

  • TensorFlow photo TensorFlow

    An Open Source Machine Learning Framework for Everyone

  • Django photo Django

    The Web framework for perfectionists with deadlines.

  • D3 photo D3

    Bring data to life with SVG, Canvas and HTML. ๐Ÿ“Š๐Ÿ“ˆ๐ŸŽ‰

Recommend Topics

  • javascript

    JavaScript (JS) is a lightweight interpreted programming language with first-class functions.

  • web

    Some thing interesting about web. New door for the world.

  • server

    A server is a program made to process requests and deliver data to clients.

  • Machine learning

    Machine learning is a way of modeling and interpreting data that allows a piece of software to respond intelligently.

  • Game

    Some thing interesting about game, make everyone happy.

Recommend Org

  • Facebook photo Facebook

    We are working to build community through open source technology. NB: members must have two-factor auth.

  • Microsoft photo Microsoft

    Open source projects and samples from Microsoft.

  • Google photo Google

    Google โค๏ธ Open Source for everyone.

  • D3 photo D3

    Data-Driven Documents codes.