Add different type of maps to your application, using Leaflet.js! This widget is almost the same as the GoogleMaps widget, without the typical interaction you have in Google Maps, but with a wide variety of maps available.
Showing an overview where all your branches/members/clients/orders/etc. are.
Easy to implement. Can use both a context object as well as without.
The maptypes come from a separate Leaflet plugin: Leaflet-providers.
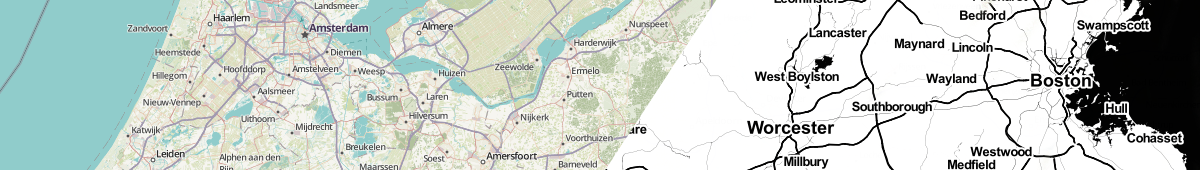
A preview of the various map types can be seen here.
Note that some of the map types have been disabled in this widget (you will see more examples in the previous link). This is because:
- They are too localized (limited to a certain region)
- Need extra configuration (HERE and MapBox need API keys, not implemented yet)
- Are not very functional yet (is an overlay instead of a full map. Overlays might be enabled in the future)
We will be adding more maps in the future. This is the current list of map providers:
Providers:
    OpenStreetMap
        .Mapnik (this is the default map)
        .BlackAndWhite
        .DE
        .France
        .HOT
    OpenTopoMap
    Thunderforest
        .OpenCycleMap
        .Transport
        .TransportDark
        .SpinalMap
        .Landscape
        .Outdoors
        .Pioneer
    Hydda
        .Full
        .Base
        .RoadsAndLabels
    Stamen
        .Toner
        .TonerBackground
        .TonerHybrid
        .TonerLines
        .TonerLabels
        .TonerLite
        .Watercolor
        .Terrain
        .TerrainBackground
        .TopOSMRelief
        .TopOSMFeatures
    Esri
        .WorldStreetMap
        .DeLorme
        .WorldTopoMap
        .WorldImagery
        .WorldTerrain
        .WorldShadedRelief
        .WorldPhysical
        .OceanBasemap
        .NatGeoWorldMap
        .WorldGrayCanvas
    HERE
        .normalDay
        .normalDayCustom
        .normalDayGrey
        .normalDayMobile
        .normalDayGreyMobile
        .normalDayTransit
        .normalDayTransitMobile
        .normalNight
        .normalNightMobile
        .normalNightGrey
        .normalNightGreyMobile
        .basicMap
        .mapLabels
        .trafficFlow
        .carnavDayGrey
        .hybridDay
        .hybridDayMobile
        .pedestrianDay
        .pedestrianNight
        .satelliteDay
        .terrainDay
        .terrainDayMobile
    BasemapAT
        .basemap
        .grau
        .overlay
        .highdpi
        .orthofoto
    nlmaps
        .standaard
        .pastel
        .grijs
        .luchtfoto
    NASAGIBS
        .ModisTerraTrueColorCR
        .ModisTerraBands367CR
        .ViirsEarthAtNight2012
        .ModisTerraLSTDay
        .ModisTerraSnowCover
        .ModisTerraAOD
        .ModisTerraChlorophyll
    NLS
    Bing
        Aerial
        Aerial imagery with a road overlay
        Roads without additional imagery
Mendix 5.18 or higher.
There are 3 use-cases for which this widget can be used.
    Outside a dataview: Will just retrieve the objects specified and show them on the map.
    Inside a dataview not matching the Objects property: Will show the objects specified, can use '[%CurrentObject%]' in XPath Constraint.
    Inside a dataview matching the Objects property: Will show the objects specified, can NOT use '[%CurrentObject%]'. Can set up the dataview to listen to a matching datagrid. If 'Pan to context' is set to true, it will focus on the marker of the object that is selected in the datagrid.
To finish up, just enter the correct values into the widget. For more information on the different input properties, read below.
- Pan to context: Set this only to true if your object containing the address matches your dataview. With this you can have your dataview listen to a datagrid of your Users objects containing the addresses and it will jump to the matching marker on the map.
- Default latitude: The default latitude the map should use when no objects are found or there is no object found (when using an XPath with CurrentObject)
- Default longitude: The default longitude the map should use when no objects are found or there is no object found (when using an XPath with CurrentObject)
- Single item zoom level: The zoom level to be used when showing a single item or the default location. Level 1 shows the entire globe, 15 is city level and 20 is house level.
- Refresh on entity changes: When set to true, the map refreshes on any changes to the mapped entity (and/or 1-deep entity). This includes on create/delete/change. Do note that it simply reloads the entire map, so this is not recommended when mapping a lot of objects.
- Objects: The widget retrieves its own objects based on the entity specified here.
- XPath constraint: The XPath constraint to be used for retrieving the objects. Important: Even though the Modeler lets you, you can't use '[%CurrentObject%]' if your dataview entity matches the entity of the objects you are retrieving. Doing so will result in an error.
- Marker attribute: The attribute that contains the text to display in the info window at the location. No info window will be shown if this is left empty. Tip: The window displays HTML, you can use the Rich Text Editor widget to create your styled text and have it saved as HTML. This can then be directly used for the info window! This can be 1-deep association.
- Latitude attribute: The attribute containing the latitudes of the objects. This can be 1-deep association.
- Longitude attribute: The attribute containing the longitudes of the objects. This can be 1-deep association.
- On click microflow: Microflow to be executed when clicking on a marker. The Microflow will have the corresponding object as an input parameter
- Marker category: Category of the marker. This is used as a label together with "Show Categories" in Controls.
- Marker image key: Used to find the image associated with specified key in the marker images. (This attribute should contain a string that will correspond to a key set in Marker images, set in Appearance)
- Height: The height the widget will have (in pixels) . This attribute is required.
- Width: The width of the widget, can be in pixels or percentage.
- Marker template: If you set the Marker attribute in Data Source, you can control the html that is used inside the popup that is shown when clicking a marker
- Default marker image: Use this image as default image if the key (set in Data Source -> Marker image key) cannot be found.
- Marker images: Images that can be specified with a key. If the value of the attribute set in Data Source -> 'Marker image key' corresponds to this key, it will use this image as marker.
- Maptype: Map type, see features
- Use custom map type: If you want to use your own map type, set this to 'Yes'
- Custom Map Url: Set the URL for the custom map type*
- Custom Map Options: Set extra options for the custom map type. Make sure this is a valid JSON object. Open with
{and close with}. The keys and values need to be strings, so surrounded by double quotes"key":"value"*
More information about the Custom Map Url and the Custom Map Options can be found on the Leaflet Reference.
- Mouse dragging: Enable/disable dragging the map using the mouse
- Touch zoom: Enable/disable zooming by touch-dragging two fingers (mobile)
- Mouse scrolling: Enable/disable scrolling by using the mouse wheel
- Zoom control: Enable/disable zoom control (+/- buttons on the map)
- Attribution control: Enable/disable attribution control (credits that are shown on the bottom right of the map)
- Fullscreen control: Enable/disable fullscreen button
- Show categories: Add a layers button tot the map where you can switch categories on and off. You will need to set the Marker category in Data Source
This tab contains the positions on the map for various controls that you can switch on/off in "Controls"
- Add geolocation button: This will add a button that you can use to find your location
- Geolocation control position: Position of the geolocation button on the map
- Draw an uncertainty circle: Draw a circle around the location, indicating how big the uncertainty is
- Keep zoom level: When locating, keep the current zoom level. If this is set to false, it will use the maximimum zoom level
- Add scale: Add a scale indicator on the map
- Scale position
- Show metric scale line (m/km)
- Show imperial scale line (mi/ft)
- Max width (in pixels, dynamically rounded)
For HERE and Bing you will need keys. These can be created here:
- If your map does not load on Cloud deployment, it usually means it tries to download map files from a HTTP source, instead of HTTPS. This is usually blocked. If that happens, please report this as an issue, so we can disable the map type. If you use a custom Map Type, make sure the URL starts with
https://or//.


