Code Monkey home page Code Monkey logo

makielayout.jl's Introduction

MakieLayout.jl

Note: MakieLayout has been absorbed by AbstractPlotting. Don't install it separately, instead use it via using AbstractPlotting.MakieLayout

Stable Dev Build Status Codecov

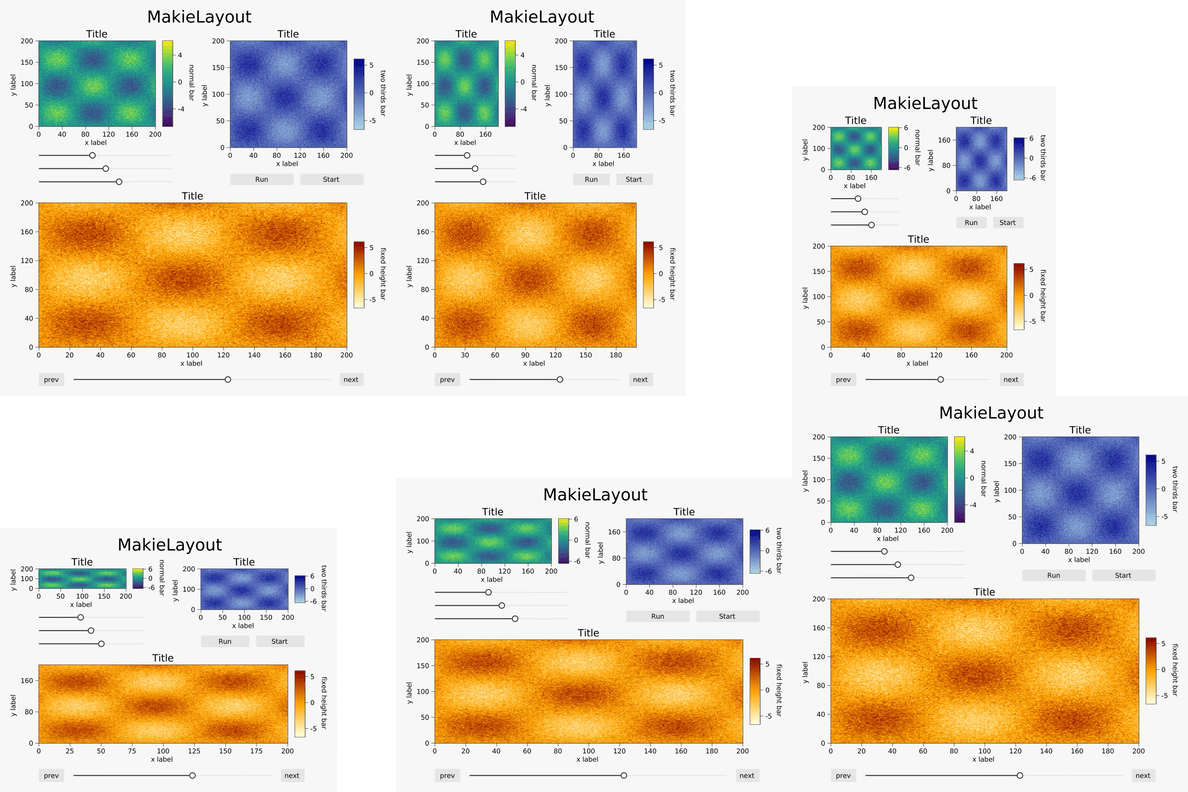
layout demo

Purpose

MakieLayout.jl brings grid layouts, a new 2D axis, and widgets like sliders and buttons that behave well in a layout to Makie.jl. You can create any 2D layout you want with the flexible combination of these features:

  • fixed, relative, aspect preserving or automatic row and column sizes
  • fixed or relative size gaps
  • elements spanning multiple rows and columns
  • automatically determine the size of objects like text so no space is wasted
  • automatic alignment along "important edges" like axis spines

Most layout parameters are instantly adjustable using Observables, as in Makie.jl. Also, the layout automatically readjusts if you change visual attributes of your content elements.

makielayout.jl's People

Contributors

asinghvi17 avatar github-actions[bot] avatar jkrumbiegel avatar juliatagbot avatar simondanisch avatar

Stargazers

 avatar  avatar  avatar  avatar  avatar  avatar  avatar  avatar  avatar  avatar  avatar  avatar  avatar  avatar  avatar  avatar  avatar  avatar  avatar  avatar  avatar  avatar  avatar  avatar  avatar  avatar  avatar  avatar  avatar  avatar  avatar  avatar  avatar  avatar  avatar  avatar  avatar  avatar  avatar  avatar  avatar  avatar  avatar  avatar  avatar  avatar  avatar  avatar  avatar

Watchers

 avatar  avatar  avatar  avatar  avatar  avatar

makielayout.jl's Issues

What is limiting the size of my elements here?

I've updated to 0.7 (but not sure whether this is an issue in 0.6 as well), and I want to ask 2 things.

  1. What is limiting the size of the elements I create in the below code?
  2. Why are the buttons without text...?

Code:

using Makie, MakieLayout, Observables

scene, layout = layoutscene()
display(scene)

function observable_slider!(layout, i, j, scene, ltext, r; wl = nothing, wr = nothing)
    slider = LSlider(scene, range = r)
    text_prev = LText(scene, "$ltext =", halign = :right)
    text_after = LText(scene, lift(a -> "$(round(a))", slider.value),
    halign = :left)
    layout[i, j] = hbox!(text_prev, slider, text_after)
    return slider
end
function controlwindow(scene, D, i0, parname)
    controllayout = GridLayout()
    # Sliders
    nslider = observable_slider!(controllayout, 1, :, scene, "n", 1000:1000:1000000)
    Tslider = observable_slider!(controllayout, 2, :, scene, "Ttr", 1000:1000:1000000)
    dslider = observable_slider!(controllayout, 3, :, scene, "d", 100:100:10000)
    αslider = observable_slider!(controllayout, 4, :, scene, "α", 0:0.001:1)
    # Buttons (incl. variable chooser)
    ▢update = LButton(scene, label = "update")
    ▢back = LButton(scene, label = "← back")
    ▢reset = LButton(scene, label = "reset")
    imenu = LMenu(scene, options = [string(j) for j in 1:D])
    controllayout[5, :] = hbox!(▢update, ▢back, ▢reset, LText(scene, "variable:"), imenu)
    # Limit boxes. Unfortunately can't be made observables yet...
    ⬜p₋, ⬜p₊, ⬜u₋, ⬜u₊ = Observable.((0.0, 1.0, 0.0, 1.0))
    text_p₋ = LButton(scene, label = lift(o -> "$(parname)₋ = $(o)", ⬜p₋))
    text_p₊ = LButton(scene, label = lift(o -> "$(parname)₊ = $(o)", ⬜p₊))
    text_u₋ = LButton(scene, label = lift(o -> "u₋ = $(o)", ⬜u₋))
    text_u₊ = LButton(scene, label = lift(o -> "u₊ = $(o)", ⬜u₊))
    controllayout[6, :] = hbox!(text_p₋, text_p₊)
    controllayout[7, :] = hbox!(text_u₋, text_u₊)

    return controllayout, nslider.value, Tslider.value, dslider.value, αslider.value,
           imenu.selection, ▢update.clicks, ▢back.clicks, ▢reset.clicks,
           ⬜p₋, ⬜p₊, ⬜u₋, ⬜u₊
end

# ax = layout[1,1] = LAxis(scene)

controllayout, = controlwindow(scene, 5, 1, "p")

layout[:, :] = controllayout

output:

image

Formatting images

Hey! I am wondering if you can try out an image example given that imho, it's one of the few things in Makie currently that does not work well. Check out MakieOrg/Makie.jl#397 for a visual of the issue. Thanks!

Contour plot goes outside axis limits

I came across an apparent bug in how contour plots are handled by MakieLayout. Basically, the plots do not seem to respect the axis limits. The following example should illustrate what I mean

using Makie, MakieLayout, Distributions, LinearAlgebra
#generate some data in a very clunky way
#test
P1 = MvNormal([-0.5, 0.5], 0.5*Diagonal([1.0, 1.0]))
P2 = MvNormal([0.5, -0.5], 0.5*Diagonal([1.0, 1.0]))
PP = fill(0.0, 100,100)
xx = range(-1.0, length=100, stop=1.0)
yy = range(-1.0, length=100, stop=1.0)
for j in 1:100
    for i in 1:100
        PP[i,j] += pdf(P1, [xx[j], yy[i]]) + pdf(P2, [xx[j],yy[i]])
    end
end

#plot the distributions using a contour plot, with the top panel empty
scene = Scene()
maingl = GridLayout(
           2, 1,
           parent = scene,
           colsizes = [Relative(1.0)],
           alignmode = Outside(20, 20, 20, 20))
    las = [maingl[i, j] = LayoutedAxis(scene) for i in 1:2, j in 1:1]
contour!(las[2,1], xx,yy,PP)
scene

test1

Stack overflow crash on using sliders

There seems to be a bug in the current master which often causes crashes while using sliders (although perhaps other widgets are affected as well).

using Makie, MakieLayout
sc = Scene(resolution=(1000,1000), camera=campixel!);
gl = GridLayout(sc, 2, 1, alignmode=Outside(10));
ax = gl[1,1] = LAxis(sc);
sl = gl[2,1] = LSlider(sc, range=1:10);
plot!(ax, [1,2], lift(x->[1,x],sl.value));
display(sc)

This simple example sometimes runs, sometimes crashes as soon as the slider is clicked, and sometimes crashes after a while. The console either gets flooded with messages before crashing the Julia runtime or just crashes silently. Here is an example output:

[9321] #setindex!#1(::Observables.var"#2#4", ::typeof(setindex!), ::Observables.Observable{AbstractPlotting.Mouse.DragEnum}, ::AbstractPlotting.Mouse.DragEnum) at C:\Users\vilim\.julia\packages\Observables\qCJWB\src\Observables.jl:87     [9322] setindex! at C:\Users\vilim\.julia\packages\Observables\qCJWB\src\Observables.jl:83 [inlined]
 [9323] #710 at C:\Users\vilim\.julia\packages\AbstractPlotting\SHHqT\src\interaction\events.jl:29 [inlined]
 [9324] (::Observables.var"#g#15"{AbstractPlotting.var"#710#711"{Base.RefValue{Bool},Base.RefValue{AbstractPlotting.Mouse.Button},Base.RefValue{AbstractPlotting.Mouse.DragEnum},Events},Tuple{Observables.Observable{Tuple{Float64,Float64}},Observables.Observable{Set{AbstractPlotting.Mouse.Button}}}})(::Set{AbstractPlotting.Mouse.Button}) at C:\Users\vilim\.julia\packages\Observables\qCJWB\src\Observables.jl:136
 [9325] #setindex!#1(::Observables.var"#2#4", ::typeof(setindex!), ::Observables.Observable{Set{AbstractPlotting.Mouse.Button}}, ::Set{AbstractPlotting.Mouse.Button}) at C:\Users\vilim\.julia\packages\Observables\qCJWB\src\Observables.jl:87
 [9326] setindex!(::Observables.Observable{Set{AbstractPlotting.Mouse.Button}}, ::Set{AbstractPlotting.Mouse.Button}) at C:\Users\vilim\.julia\packages\Observables\qCJWB\src\Observables.jl:83
 [9327] addbuttons(::Scene, ::Symbol, ::GLFW.MouseButton, ::GLFW.Action, ::Type{AbstractPlotting.Mouse.Button}) at C:\Users\vilim\.julia\packages\GLMakie\DK7aq\src\events.jl:36
 [9328] (::GLMakie.var"#mousebuttons#50"{Scene})(::GLFW.Window, ::GLFW.MouseButton, ::GLFW.Action, ::Int32) at C:\Users\vilim\.julia\packages\GLMakie\DK7aq\src\events.jl:109
 [9329] _MouseButtonCallbackWrapper(::GLFW.Window, ::GLFW.MouseButton, ::GLFW.Action, ::Int32) at C:\Users\vilim\.julia\packages\GLFW\e257h\src\callback.jl:43
 [9330] PollEvents at C:\Users\vilim\.julia\packages\GLFW\e257h\src\glfw3.jl:585 [inlined]
 [9331] #renderloop#42(::Float64, ::GLMakie.var"#43#45", ::typeof(GLMakie.renderloop), ::GLMakie.Screen) at C:\Users\vilim\.julia\packages\GLMakie\DK7aq\src\rendering.jl:7
 [9332] renderloop(::GLMakie.Screen) at C:\Users\vilim\.julia\packages\GLMakie\DK7aq\src\rendering.jl:2StackOverflowError:
Stacktrace:
 [1] getproperty(::ModernGL.GLFunc, ::Symbol) at .\Base.jl:20
 [2] glBindFramebuffer(::UInt32, ::UInt32) at C:\Users\vilim\.julia\packages\ModernGL\Cr1A7\src\functionloading.jl:59   [3] pick_native(::GLMakie.Screen, ::Vec{2,Float64}) at C:\Users\vilim\.julia\packages\GLMakie\DK7aq\src\screen.jl:359  [4] pick at C:\Users\vilim\.julia\packages\GLMakie\DK7aq\src\screen.jl:371 [inlined]
 [5] pick(::Scene, ::Tuple{Float64,Float64}) at C:\Users\vilim\.julia\packages\AbstractPlotting\SHHqT\src\interaction\interactive_api.jl:89
 [6] mouseover(::Scene, ::LineSegments{...}) at C:\Users\vilim\.julia\packages\AbstractPlotting\SHHqT\src\interaction\interactive_api.jl:36
 [7] (::MakieLayout.var"#156#157"{Scene,Tuple{LineSegments{...}},Module,Base.RefValue{Bool},Base.RefValue{Bool},Base.RefValue{Bool},Base.RefValue{Point{2,Float32}},Base.RefValue{Float64},Base.RefValue{Float64},Float64,Base.RefValue{Bool},Observables.Observable{MakieLayout.MouseState}})(::Tuple{Float64,Float64}, ::AbstractPlotting.Mouse.DragEnum) at C:\Users\vilim\.julia\packages\MakieLayout\YoIGV\src\mousestatemachine.jl:85
 [8] (::Observables.var"#g#15"{MakieLayout.var"#156#157"{Scene,Tuple{LineSegments{...}},Module,Base.RefValue{Bool},Base.RefValue{Bool},Base.RefValue{Bool},Base.RefValue{Point{2,Float32}},Base.RefValue{Float64},Base.RefValue{Float64},Float64,Base.RefValue{Bool},Observables.Observable{MakieLayout.MouseState}},Tuple{Observables.Observable{Tuple{Float64,Float64}},Observables.Observable{AbstractPlotting.Mouse.DragEnum}}})(::Tuple{Float64,Float64}) at C:\Users\vilim\.julia\packages\Observables\qCJWB\src\Observables.jl:136
 [9] #setindex!#1(::Observables.var"#2#4", ::typeof(setindex!), ::Observables.Observable{Tuple{Float64,Float64}}, ::Tuple{Float64,Float64}) at C:\Users\vilim\.julia\packages\Observables\qCJWB\src\Observables.jl:87
 [10] setindex! at C:\Users\vilim\.julia\packages\Observables\qCJWB\src\Observables.jl:83 [inlined]
 [11] (::MakieLayout.var"#156#157"{Scene,Tuple{LineSegments{...}},Module,Base.RefValue{Bool},Base.RefValue{Bool},Base.RefValue{Bool},Base.RefValue{Point{2,Float32}},Base.RefValue{Float64},Base.RefValue{Float64},Float64,Base.RefValue{Bool}ers\vilim\.julia\packages\MakieLayout\YoIGV\src\mousestatemachine.jl:115
 ... (the last 4 lines are repeated 2327 more times)
 [9320] (::Observables.var"#g#15"{MakieLayout.var"#156#157"{Scene,Tuple{LineSegments{...}},Module,Base.RefValue{Bool},Base.RefValue{Bool},Base.RefValue{Bool},Base.RefValue{Point{2,Float32}},Base.RefValue{Float64},Base.RefValue{Float64},Float64,Base.RefValue{Bool},Observables.Observable{MakieLayout.MouseState}},Tuple{Observables.Observable{Tuple{Float64,Float64}},Observables.Observable{AbstractPlotting.Mouse.DragEnum}}})(::AbstractPlotting.Mouse.DragEnum) at C:\Users\vilim\.julia\packages\Observables\qCJWB\src\Observables.jl:136
 [9321] #setindex!#1(::Observables.var"#2#4", ::typeof(setindex!), ::Observables.Observable{AbstractPlotting.Mouse.DragEnum}, ::AbstractPlotting.Mouse.DragEnum) at C:\Users\vilim\.julia\packages\Observables\qCJWB\src\Observables.jl:87     [9322] setindex! at C:\Users\vilim\.julia\packages\Observables\qCJWB\src\Observables.jl:83 [inlined]
 [9323] #710 at C:\Users\vilim\.julia\packages\AbstractPlotting\SHHqT\src\interaction\events.jl:29 [inlined]
 [9324] (::Observables.var"#g#15"{AbstractPlotting.var"#710#711"{Base.RefValue{Bool},Base.RefValue{AbstractPlotting.Mouse.Button},Base.RefValue{AbstractPlotting.Mouse.DragEnum},Events},Tuple{Observables.Observable{Tuple{Float64,Float64}},Observables.Observable{Set{AbstractPlotting.Mouse.Button}}}})(::Set{AbstractPlotting.Mouse.Button}) at C:\Users\vilim\.julia\packages\Observables\qCJWB\src\Observables.jl:136
 [9325] #setindex!#1(::Observables.var"#2#4", ::typeof(setindex!), ::Observables.Observable{Set{AbstractPlotting.Mouse.Button}}, ::Set{AbstractPlotting.Mouse.Button}) at C:\Users\vilim\.julia\packages\Observables\qCJWB\src\Observables.jl:87
 [9326] setindex!(::Observables.Observable{Set{AbstractPlotting.Mouse.Button}}, ::Set{AbstractPlotting.Mouse.Button}) at C:\Users\vilim\.julia\packages\Observables\qCJWB\src\Observables.jl:83
 [9327] addbuttons(::Scene, ::Symbol, ::GLFW.MouseButton, ::GLFW.Action, ::Type{AbstractPlotting.Mouse.Button}) at C:\Users\vilim\.julia\packages\GLMakie\DK7aq\src\events.jl:36
 [9328] (::GLMakie.var"#mousebuttons#50"{Scene})(::GLFW.Window, ::GLFW.MouseButton, ::GLFW.Action, ::Int32) at C:\Users\vilim\.julia\packages\GLMakie\DK7aq\src\events.jl:109
 [9329] _MouseButtonCallbackWrapper(::GLFW.Window, ::GLFW.MouseButton, ::GLFW.Action, ::Int32) at C:\Users\vilim\.julia\packages\GLFW\e257h\src\callback.jl:43
 [9330] PollEvents at C:\Users\vilim\.julia\packages\GLFW\e257h\src\glfw3.jl:585 [inlined]
 [9331] #renderloop#42(::Float64, ::GLMakie.var"#43#45", ::typeof(GLMakie.renderloop), ::GLMakie.Screen) at C:\Users\vilim\.julia\packages\GLMakie\DK7aq\src\rendering.jl:7
 [9332] renderloop(::GLMakie.Screen) at C:\Users\vilim\.julia\packages\GLMakie\DK7aq\src\rendering.jl:2StackOverflowError:

I am running MakieLayout, GLMakie and AbstractPlotting on the master branch on Julia 1.3 on Windows.

Slider observables should infer type

Making a slider with something as simple as:

slider = LSlider(scene, range = 0:0.1:1)

makes an Observable{Any} , which makes bugs harder to hide, because you don't get errors when updating the slider's value. It should be easy to just use the eltype(range) as the parameter of the observable?

Legend inside axis

I really like how the LLegend works, basically giving one the ability to create legend entries for arbitrary plot types. I was wondering, though, if there is any way to have the legend appear inside/overlapped with the plot itself? I find that if I try to create a normal Makie text annotation, the text gets all distorted.
This example hopefully illustrates what I mean:

using Makie, MakieLayout
scene = Scene(resolution=(300,400), camera=campixel!)
layout = GridLayout(scene, alignmode=Outside(20))
la = LAxis(scene)
layout[1,1] = la

lines!(la, [1,2,3],[1,4,9],color="red")
lines!(la, [1,2,3],[1,8,27], color="blue")
text!(la, "y=x^2", position=(4,6),textsize=1.0,color="red")
text!(la, "y=x^3", position=(4,9),textsize=1.0,color="blue")
scene

legend_test

Mouse picking transformation

I am trying to make an interactive interface with MakieLayout, which involves picking on the canvas (at some point I would also like to implement a toyplot-like theme). However I am struggling to find the appropriate methods and properties for the mouse-to-data coordinates transformation.

scene, layout = layoutscene(30, resolution = (600, 600))
ax = (layout[1,1] = LAxis(scene))
hmp = heatmap!(ax, rand(100,100));
mouse_st = MakieLayout.addmousestate!(scene, hmp)

# make a node list of points for the crosshairs
draw_lines = lift(mouse_st) do mst
   if mst.typ == MakieLayout.MouseOver()
       x, y = to_world(hmp.parent, mst.pos)
       p = [Point2f0(x, 0),
            Point2f0(x, 100),
            Point2f0(0, y),
            Point2f0(100, y)]
    else
       p = [Point2f0(0,0)] 
    end
    p
end

lsgs = linesegments!(ax, draw_lines, color="red", linewidth=3) # is there a function for infinite horizontal/vertical lines?
display(scene)

This is the closest I have gotten, but there is still a mysterious offset between the mouse and crosshairs coordinates.

Performance question

Perhaps this is a makie question in general, but as I'm using MakieLayout I thought I'd ask here first.

I've got the following code:

using Makie
using MakieLayout
using AbstractPlotting

outer_padding = 30
scene, layout = layoutscene(outer_padding, resolution = (600, 600),
                backgroundcolor = RGBf0(0.98, 0.98, 0.98))
axes = [LAxis(scene) for i in 1:5, j in 1:4 ]
for ax in axes
   ax.titlevisible = false
   ax.xlabelvisible = false
   ax.ylabelvisible = false
   ax.xticklabelsvisible = false
   ax.yticklabelsvisible = false
   ax.xticksvisible = false
   ax.yticksvisible = false
   ax.bottomspinevisible = false
   ax.leftspinevisible = false
   ax.topspinevisible = false
   ax.rightspinevisible = false
end

tightlimits!.(axes)
layout[1:5, 1:4] = axes
display(scene)
for x in 1:100
   imgs = [ rand(28,28) for i in 1:20]
   for (i,ax) in enumerate(axes)
      image!(ax, imgs[i])
   end
   sleep(0.0001)
end

A couple of things I notice performance-wise:

  1. even after the outerloop is finished I see pretty high CPU useage:

PID USER PR NI VIRT RES SHR S %CPU %MEM TIME+ COMMAND
28488 phil 20 0 2301848 804876 155368 R 95.4 2.5 7:00.30 julia

  1. Resizing the scene window is very visibly slow. I find this kind of odd given that I've played with lots of interactive Makie 3d plots, for example, which are very responsive. Is this because I have 20 'subplots' (for lack of a better term)? Is there a more efficient way to do this?

[FR] Slider that displays its value

I use slider, but I can imagine that many would want a slider that displays its value. Here is a simple code snippet I came up with:

slider = LSlider(scene, range = range(...))
text_prev = LText(scene, "T =", halign = :right)
text_after = LText(scene, lift(a -> string(a), slider.value), halign = :left)

This works very neatly for horizontal sliders, but I imagine that it is not optimal for vertical ones. But it seems an easy fix to simply make both halign arguments :center for vertical sliders.

Maybe worth including this as possibility when making a slider? I assume that if both texts are always zero, layouting won't be affected.

assigning to grid doesn't replace previous axis

Given the assignment syntax used to place a LayoutedAxis in a GridLayout I expected that I could replace it as below, but it seems that both axes are present afterwards. Obviously I wouldn't have this code as-is, but it comes up when working iteratively at the REPL.

scene = Scene(resolution = (1200, 900), camera=campixel!)

layout = GridLayout(2,2, parent=scene, alignmode=Outside(20))
layout[1,1] = LayoutedAxis(scene)
layout[1,1] = LayoutedAxis(scene, titlevisible=false, ylabelvisible=false)

Placing a 3D scene in a layout

This is the currently accepted hack (using an LRect):

 scene, layout = layoutscene()
dummyrect = layout[1, 1] = LRect(scene, visible = false)
scene3d = Scene(scene, lift(IRect2D, dummyrect.layoutnodes.computedbbox),
    camera = cam3d!, raw = false)
surface!(scene3d, 1:10, 1:10, rand(10, 10))

Issues plotting an image

Hey @jkrumbiegel !

I am having a weird issue. When I plot an image, the bounds are correct: 1600 x 1600

However, when I zoom in or plot a sub-image, the coordinates from the image on my computer, let's say (1500, 700), do not show the same location.

For some reason, the location in the makie window shows up 150 pixels up on the y-axis from where I would expect it to be.

I am using las[3, 1].aspect = DataAspect().

Any thoughts as to what could be causing this issue?

Unable to resize grid?

This could be a result of me wanting to live on the edge, but the automatic layout resizing triggered by indexing outside the current grid seems broken at the moment. For example, running the example here, I get an error on the last line:

julia> # index into the 0th row, thereby adding a new row into the layout and place
       # a text object across the first four columns as a super title
       layout[0, 1:4] = LText(scene, text="MakieLayout Facets", textsize=50)
ERROR: TypeError: in setfield!, expected Array{MakieLayout.GridContent,1}, got Array{MakieLayout.GridContent{GridLayout,_A} where _A,1}

Bounds error with `ax.xticklabelsvisible = false`

using MakieLayout, Makie, AbstractPlotting

function mwe(series)
    scene, layout = layoutscene()
    axs = [LAxis(scene), LAxis(scene)]
    linkxaxes!(axs...)
    for i = 1:2
        ax = axs[i]
        ax.xticklabelsvisible = false
        lines!(ax, 1:length(series), series)
        layout[i, 1] = ax
    end

    scene
end

# s = rand(2)
s = [0.6735411040113073, 0.7751331011468388]

mwe(s)

Results in

ERROR: LoadError: BoundsError: attempt to access 0-element UnitRange{Int64} at index [1]
Stacktrace:
 [1] throw_boundserror(::UnitRange{Int64}, ::Int64) at ./abstractarray.jl:537
 [2] getindex at ./range.jl:643 [inlined]
 [3] bs_getindex(::UnitRange{Int64}, ::Int64) at /home/eric/.julia/packages/AbstractPlotting/v7HgF/src/utilities/utilities.jl:141
 [4] _broadcast_getindex_evalf at ./broadcast.jl:648 [inlined]
 [5] _broadcast_getindex at ./broadcast.jl:621 [inlined]
 [6] (::Base.Broadcast.var"#19#20"{Base.Broadcast.Broadcasted{Base.Broadcast.Style{Tuple},Nothing,typeof(AbstractPlotting.bs_getindex),Tuple{Tuple{UnitRange{Int64},FreeTypeAbstraction.FTFont,Array{Tuple{String,Point{2,Float32}},1},Symbol,Float32,Tuple{Symbol,Symbol},Float32,Float64,Float64},Int64}}})(::Int64) at ./broadcast.jl:1041
 [7] macro expansion at ./ntuple.jl:50 [inlined]
 [8] ntuple at ./ntuple.jl:45 [inlined]
 [9] copy(::Base.Broadcast.Broadcasted{Base.Broadcast.Style{Tuple},Nothing,typeof(AbstractPlotting.bs_getindex),Tuple{Tuple{UnitRange{Int64},FreeTypeAbstraction.FTFont,Array{Tuple{String,Point{2,Float32}},1},Symbol,Float32,Tuple{Symbol,Symbol},Float32,Float64,Float64},Int64}}) at ./broadcast.jl:1041
 [10] materialize at ./broadcast.jl:837 [inlined]
 [11] broadcast_foreach(::Function, ::UnitRange{Int64}, ::Vararg{Any,N} where N) at /home/eric/Code/InfoBugMWE/mwe.jl:53
 [12] (::AbstractPlotting.var"#379#381"{Array{Point{3,Float32},1},Array{ColorTypes.RGBA{Float32},1},Array{Float32,1},Array{FreeTypeAbstraction.FTFont,1},Array{Quaternion{Float32},1},Text{...}})(::StaticArrays.SArray{Tuple{4,4},Float32,2,16}, ::String, ::Array{Tuple{String,Point{2,Float32}},1}, ::Symbol, ::Vararg{Any,N} where N) at /home/eric/.julia/packages/AbstractPlotting/v7HgF/src/basic_recipes/basic_recipes.jl:412
 [13] (::Observables.OnUpdate{AbstractPlotting.var"#379#381"{Array{Point{3,Float32},1},Array{ColorTypes.RGBA{Float32},1},Array{Float32,1},Array{FreeTypeAbstraction.FTFont,1},Array{Quaternion{Float32},1},Text{...}},Tuple{Observable{Any},Observable{Any},Observable{Array{Tuple{String,Point{2,Float32}},1}},Observable{Any},Observable{Any},Observable{Any},Observable{Any},Observable{Any},Observable{Any}}})(::Array{Tuple{String,Point{2,Float32}},1}) at /home/eric/.julia/packages/Observables/0wrF6/src/Observables.jl:218
 [14] setindex!(::Observable{Array{Tuple{String,Point{2,Float32}},1}}, ::Array{Tuple{String,Point{2,Float32}},1}; notify::Observables.var"#6#8") at /home/eric/.julia/packages/Observables/0wrF6/src/Observables.jl:130
 [15] setindex! at /home/eric/.julia/packages/Observables/0wrF6/src/Observables.jl:126 [inlined]
 [16] MapUpdater at /home/eric/.julia/packages/Observables/0wrF6/src/Observables.jl:241 [inlined]
 [17] (::Observables.OnUpdate{Observables.MapUpdater{AbstractPlotting.var"#189#191"{Int64},Array{Tuple{String,Point{2,Float32}},1}},Tuple{Observable{Tuple{Array{Tuple{String,Point{2,Float32}},1}}}}})(::Tuple{Array{Tuple{String,Point{2,Float32}},1}}) at /home/eric/.julia/packages/Observables/0wrF6/src/Observables.jl:218
 [18] setindex!(::Observable{Tuple{Array{Tuple{String,Point{2,Float32}},1}}}, ::Tuple{Array{Tuple{String,Point{2,Float32}},1}}; notify::Observables.var"#6#8") at /home/eric/.julia/packages/Observables/0wrF6/src/Observables.jl:130
 [19] setindex!(::Observable{Tuple{Array{Tuple{String,Point{2,Float32}},1}}}, ::Tuple{Array{Tuple{String,Point{2,Float32}},1}}) at /home/eric/.julia/packages/Observables/0wrF6/src/Observables.jl:126
 [20] (::AbstractPlotting.var"#213#215"{DataType,Observable{Tuple{Array{Tuple{String,Point{2,Float32}},1}}}})(::Tuple{}, ::Tuple{Array{Tuple{String,Point{2,Float32}},1}}) at /home/eric/.julia/packages/AbstractPlotting/v7HgF/src/interfaces.jl:563
 [21] (::Observables.OnUpdate{AbstractPlotting.var"#213#215"{DataType,Observable{Tuple{Array{Tuple{String,Point{2,Float32}},1}}}},Tuple{Observable{Tuple{}},Observable{Tuple{Array{Tuple{String,Point{2,Float32}},1}}}}})(::Tuple{Array{Tuple{String,Point{2,Float32}},1}}) at /home/eric/.julia/packages/Observables/0wrF6/src/Observables.jl:218
 [22] setindex!(::Observable{Tuple{Array{Tuple{String,Point{2,Float32}},1}}}, ::Tuple{Array{Tuple{String,Point{2,Float32}},1}}; notify::Observables.var"#6#8") at /home/eric/.julia/packages/Observables/0wrF6/src/Observables.jl:130
 [23] setindex! at /home/eric/.julia/packages/Observables/0wrF6/src/Observables.jl:126 [inlined]
 [24] MapUpdater at /home/eric/.julia/packages/Observables/0wrF6/src/Observables.jl:241 [inlined]
 [25] (::Observables.OnUpdate{Observables.MapUpdater{typeof(tuple),Tuple{Array{Tuple{String,Point{2,Float32}},1}}},Tuple{Observable{Array{Tuple{String,Point{2,Float32}},1}}}})(::Array{Tuple{String,Point{2,Float32}},1}) at /home/eric/.julia/packages/Observables/0wrF6/src/Observables.jl:218
 [26] setindex!(::Observable{Array{Tuple{String,Point{2,Float32}},1}}, ::Array{Tuple{String,Point{2,Float32}},1}; notify::Observables.var"#6#8") at /home/eric/.julia/packages/Observables/0wrF6/src/Observables.jl:130
 [27] setindex! at /home/eric/.julia/packages/Observables/0wrF6/src/Observables.jl:126 [inlined]
 [28] (::MakieLayout.var"#104#125"{Observable{Any},Observable{Any},Observable{Tuple{Float32,Tuple{Float32,Float32},Bool}},Observable{Array{Tuple{String,Point{2,Float32}},1}},Observable{Float32},Observable{Array{Float32,1}},Observable{Array{Point{2,Float32},1}}})(::Array{String,1}, ::Float32, ::Bool) at /home/eric/.julia/packages/MakieLayout/sn55V/src/lineaxis.jl:200
 [29] (::Observables.OnUpdate{MakieLayout.var"#104#125"{Observable{Any},Observable{Any},Observable{Tuple{Float32,Tuple{Float32,Float32},Bool}},Observable{Array{Tuple{String,Point{2,Float32}},1}},Observable{Float32},Observable{Array{Float32,1}},Observable{Array{Point{2,Float32},1}}},Tuple{Observable{Array{String,1}},Observable{Float32},Observable{Any}}})(::Float32) at /home/eric/.julia/packages/Observables/0wrF6/src/Observables.jl:218
 [30] setindex!(::Observable{Float32}, ::Float32; notify::Observables.var"#6#8") at /home/eric/.julia/packages/Observables/0wrF6/src/Observables.jl:130
 [31] setindex!(::Observable{Float32}, ::Float32) at /home/eric/.julia/packages/Observables/0wrF6/src/Observables.jl:126
 [32] (::Observables.MapUpdater{MakieLayout.var"#95#116",Float32})(::Float32, ::Vararg{Any,N} where N) at /home/eric/.julia/packages/Observables/0wrF6/src/Observables.jl:241
 [33] (::Observables.OnUpdate{Observables.MapUpdater{MakieLayout.var"#95#116",Float32},Tuple{Observable{Any},Observable{Float32},Observable{Any},Observable{Any},Observable{Any},Observable{Any}}})(::Bool) at /home/eric/.julia/packages/Observables/0wrF6/src/Observables.jl:218
 [34] setindex!(::Observable{Any}, ::Bool; notify::Observables.var"#6#8") at /home/eric/.julia/packages/Observables/0wrF6/src/Observables.jl:130
 [35] setindex!(::Observable{Any}, ::Bool) at /home/eric/.julia/packages/Observables/0wrF6/src/Observables.jl:126
 [36] setproperty!(::LAxis, ::Symbol, ::Bool) at /home/eric/.julia/packages/MakieLayout/sn55V/src/lobjects/lobject.jl:25
 [37] mwe(::Array{Float64,1}) at /home/eric/Code/InfoBugMWE/makie_layout_error.jl:9
 [38] top-level scope at /home/eric/Code/InfoBugMWE/makie_layout_error.jl:20
 [39] include(::String) at ./client.jl:457
 [40] top-level scope at REPL[7]:1
in expression starting at /home/eric/Code/InfoBugMWE/makie_layout_error.jl:20

The really strange this is that adding a logging statement to AbstractPlotting.broadcast_foreach makes the error go away, on Julia 1.4 and master, which seems like it must be some kind of Julia bug. I made a gist to show this: https://gist.github.com/ericphanson/2471832c9875bfd29469a6de13eff8c0.

right yaxisposition looks funky

When yaxisposition = :right then the horizontal alignment of yticklabelalign should automatically be set to :left. Right now:

scene, layout = layoutscene()
ax = layout[1,1] = LAxis(scene, yaxisposition = :right)
scatter!(ax, rand(Point2f0, 5))

looks like this:
a
While this:

scene, layout = layoutscene()
ax = layout[1,1] = LAxis(scene, yaxisposition = :right, yticklabelalign = (:left, :center))
scatter!(ax, rand(Point2f0, 5))

looks great:
a

title! and ylabel!

Currently, title!doesn't exist and therefore doesn't work on LAxis. yalbel! doesn't work on LAxis either.

Plotting lines onto an image not working as expected.

Hey @jkrumbiegel I am not sure what I did here but the following does not show the lines anymore:

using Makie
using MakieLayout
using FileIO

x_vec = [1525.77173, 1525.77173, 1525.77173, 1525.77173]
y_vec =  [709.3146, 709.3146, 709.3146, 709.3146]
x_min = 1511
x_max = 1541
y_min = 694
y_max = 724

scene, maingl = layoutscene(resolution = (1500, 1500))
maingl = GridLayout(scene, alignmode = Outside(30))
nrows = 2
ncols = 3

las = maingl[1:nrows, 1:ncols] = [LAxis(scene, titlesize=20) for i in 1:nrows, j in 1:ncols]
tightlimits!.(las)

#TODO make this work with the new MakieLayout Slider function.
stepslider = slider(1:length(x_vec), "Steps", raw = true, camera = campixel!, start = length(x_vec))

positions = lift(stepslider[end][:value]) do val2
    Point2f0.(x_vec[1:val2], y_vec[1:val2])
end

#This is what we will use to fix the "Patchy plotting"...
function xlines(scene, points; kw...)
    l = lift(points) do points
        result = Point2f0[]
        for i in 1:(length(points)-1)
            push!(result, points[i], points[i + 1])
        end
        result
    end
    Makie.linesegments!(scene, l; kw...)
end

img = load("/Users/logankilpatrick/Desktop/zone-map.png")

image!(las[1, 1], rotr90(img))
image!(las[1, 2], x_min:x_max, y_min:y_max, rotr90(img[y_min:y_max, x_min:x_max])) # only rotate before showing
image!(las[1, 3], x_min:x_max, y_min:y_max, rotr90(img[y_min:y_max, x_min:x_max]))

image!(las[2, 2], x_min:x_max, y_min:y_max, rotr90(img[y_min:y_max, x_min:x_max]))
image!(las[2, 3], x_min:x_max, y_min:y_max, rotr90(img[y_min:y_max, x_min:x_max]))

las[1, 1].title = "a"
las[1, 2].title = "b"
las[1, 3].title = "c"

las[2, 1].title = "x"
las[2, 2].title = "y"
las[2, 3].title = "z"

las[1, 1].aspect = DataAspect()
las[1, 2].aspect = DataAspect()
las[1, 3].aspect = DataAspect()

las[2, 2].aspect = DataAspect()
las[2, 3].aspect = DataAspect()


xlines(las[1, 2], positions, overdraw=true, linewidth = 2, color = :black)
xlines(las[1, 3], positions, overdraw=true, linewidth = 2)
xlines(las[2, 2], positions, overdraw=true, linewidth = 2)
xlines(las[2, 3], positions, overdraw=true, linewidth = 2)

display(scene)

zone-map

Any thoughts as to how I can fix this?

How to change position of slider.

Hi!

I have a slider created by:

Using AbstractPlotting, GLMakie, MakieLayout
scene, layout = layoutscene()
sl = LSlider(scene, range=1:10)

If I move the slider with my mouse, to the middle, I can retrieve the value by:

sl.value[]

However, if I modify thi:

sl.value[] = 1

The position of the silder does not vary accordingly.

How can I make this happen?

My first thought was to implement an action similar to:

    on(attrs.value) do i
        #update displayed_sliderfraction[]
    end

at

However, changing sl.value from the outside doesn't seem to trigger this action.
Is there an easy way to solve this?

Setting ticks is missing from the docs

At the moment there seem to be no documentation on how to set ticks of axis.

I found out there is a constructor ManualTicks, yet I cannot actually instantiate it.

ManualTicks(1,2,3)
ManualTicks([1,2,3])

neither work and ManualTicks also has no docstring.

Textbox observable widget?

Hi there, the current interactive widges you guys have are amazing. I am preparing a totally mindblowing interactive application.

In parallel, I also want to port InteractiveChaos here and drop Blink dependencies and usage.

There is only one thing necessary for me to be able to do that: a textbox widget where the observable is the text the user writes, or that the text is updated as an observable via mechanisms during the animation.

Do you think it is possible to implement this here?

Placing sliders on a layouted scene

How do you place sliders (etc) on a layouted scene? - as illustrated by the animated GIF in the README.md. I see logankilpatrick (Issue #13) asked for the code that generated the GIF, but the link is broken.

Updating slider.value does not actually update the slider visuals

For interactive applications where reset buttons are used, some sliders need to be changed to some values programmatically.

After initializing a slider, doing slider.value[] = other_val does update the slider's value, but not the visuals. Visually the slider is stuck at the same position.

hide axis function

This is very useful to have:

function hide_axis!(ax)
    ax.bottomspinevisible = false
    ax.leftspinevisible = false
    ax.topspinevisible = false
    ax.rightspinevisible = false
    ax.xgridvisible = false
    ax.ygridvisible = false
    ax.xticksvisible = false
    ax.yticksvisible = false
    ax.xticklabelsvisible = false
    ax.yticklabelsvisible = false
end

if you let me know where to put it in the source, I'll add a PR.

button text is pixelated now

In the new version the button text is now pixelated with white pixels around it like heavy aliasing.

image

This is not the case for e.g. the LMenu button

image

When plotting an image with limits, the axis's limits change

Hey! I have the following:

Screen Shot 2019-12-12 at 5 34 57 PM

this comes from image!(axes[i, j], img[rand(400:500):1:500, rand(400:500):1:500])

I really want the axis to maintain the original values i.e. something between rand(400:500):1:500 400 and 500... How do I do this? When I plot lines on the image, the lines are relative to the 400-500 so when I add the lines it gets all messed up.

non-recursive show function

currently when coding interactively and missing a ; after an LAxis object, the whole REPL is spammed with a huge bulk of code.

Assigning a legend to a variable doesn't work

I find that this works:

layout[1,3] = LLegend(scene, ...)

but not this:

leg = LLegend(scene, ...)
layout[1,3] = leg

The legend doesn't show. I tested this with manually created legend entries. I am on:

(displacement) pkg> st
Status `~/coffeebeetlearticle/displacement/Project.toml`
  [537997a7] AbstractPlotting v0.9.26 #jk/text-layouting (https://github.com/JuliaPlots/AbstractPlotting.jl.git)
  [13f3f980] CairoMakie v0.1.3 #jk/scatter-glyphs (https://github.com/JuliaPlots/CairoMakie.jl.git)
  [5a521ce4] MakieLayout v0.5.0 #master (https://github.com/jkrumbiegel/MakieLayout.jl.git)

among other things...

StackOverflowError in Auto

    scene = Scene(resolution = (1000, 1000), font="SF Hello");
    screen = display(scene)
    campixel!(scene);

    nrows = 1
    ncols = 1

    maingl = GridLayout(
        nrows, ncols,
        parent = scene,
        colsizes = Auto(false, 1),
        rowsizes = Auto(false, 1),
        alignmode = Outside(30, 30, 30, 30))

ERROR: StackOverflowError:
Stacktrace:
 [1] Auto(::Bool, ::Int64) at C:\Users\Mus\.julia\packages\MakieLayout\iWLYK\src\types.jl:77 (repeats 80000 times)

How do I set axis limits?

Something that is missing from the docs is how to set and/or adjust the limits of the axis (meaning in data points). I think this is too often used in real plotting for e.g. papers and thus should be supported more "rigorously". I recall @jkrumbiegel instructed me to use targetlimits at some point, but this doesn't work here.

MWE:

using MakieLayout
parname = "p"
scene, layout = layoutscene()
display(scene)
odax = layout[1,1] = LAxis(scene)

odax.xticks = ManualTicks(0:0.25:1, ["$(parname)", " ", " ", " ", "$(parname)"])
odax.yticks = ManualTicks(0:0.25:1, ["u₋", " ", " ", " ", "u₊"])
odax.ylabel = "u" # lift(o -> "u"*subscript(o), i)
odax.xlabel = parname
odax.targetlimits[] = BBox(1, -1, -1, 1)

gives error

ERROR: BoundsError: attempt to access 0-element UnitRange{Int64} at index [1]
Stacktrace:
 [1] throw_boundserror(::UnitRange{Int64}, ::Int64) at .\abstractarray.jl:537
 [2] getindex at .\range.jl:619 [inlined]
 [3] bs_getindex(::UnitRange{Int64}, ::Int64) at C:\Users\datse\.julia\dev\AbstractPlotting\sr\utilities\utilities.jl:141
 [4] _broadcast_getindex_evalf at .\broadcast.jl:631 [inlined]
 [5] _broadcast_getindex at .\broadcast.jl:604 [inlined]
 [6] (::Base.Broadcast.var"#19#20"{Base.Broadcast.Broadcasted{Base.Broadcast.Style{Tuple},Nothng,typeof(AbstractPlotting.bs_getindex),Tuple{Tuple{UnitRange{Int64},FreeTypeAbstraction.FTFon,Array{Tuple{String,Point{2,Float32}},1},Symbol,Float32,Tuple{Symbol,Symbol},Float32},Int64}}}(::Int64) at .\broadcast.jl:1024
 [7] macro expansion at .\ntuple.jl:50 [inlined]
 [8] ntuple at .\ntuple.jl:46 [inlined]
 [9] copy(::Base.Broadcast.Broadcasted{Base.Broadcast.Style{Tuple},Nothing,typeof(AbstractPloting.bs_getindex),Tuple{Tuple{UnitRange{Int64},FreeTypeAbstraction.FTFont,Array{Tuple{String,Pont{2,Float32}},1},Symbol,Float32,Tuple{Symbol,Symbol},Float32},Int64}}) at .\broadcast.jl:1024
 [10] materialize at .\broadcast.jl:820 [inlined]
 [11] broadcast_foreach(::Function, ::UnitRange{Int64}, ::Vararg{Any,N} where N) at C:\Users\dtse\.julia\dev\AbstractPlotting\src\utilities\utilities.jl:156
 [12] (::AbstractPlotting.var"#379#381"{Array{Point{3,Float32},1},Array{ColorTypes.RGBA{Float3},1},Array{Vec{2,Float32},1},Array{FreeTypeAbstraction.FTFont,1},Array{Quaternion{Float32},1},ombined{AbstractPlotting.text,Tuple{String}}})(::StaticArrays.SArray{Tuple{4,4},Float32,2,16},
::String, ::Array{Tuple{String,Point{2,Float32}},1}, ::Symbol, ::Vararg{Any,N} where N) at C:\sers\datse\.julia\dev\AbstractPlotting\src\basic_recipes\basic_recipes.jl:428
 [13] (::Observables.OnUpdate{AbstractPlotting.var"#379#381"{Array{Point{3,Float32},1},Array{ClorTypes.RGBA{Float32},1},Array{Vec{2,Float32},1},Array{FreeTypeAbstraction.FTFont,1},Array{Quternion{Float32},1},Combined{AbstractPlotting.text,Tuple{String}}},Tuple{Observables.Observabl{Any},Observables.Observable{Any},Observables.Observable{Array{Tuple{String,Point{2,Float32}},}},Observables.Observable{Any},Observables.Observable{Any},Observables.Observable{Any},Observales.Observable{Any}}})(::Array{Tuple{String,Point{2,Float32}},1}) at C:\Users\datse\.julia\pacages\Observables\0wrF6\src\Observables.jl:218
 [14] setindex!(::Observables.Observable{Array{Tuple{String,Point{2,Float32}},1}}, ::Array{Tupe{String,Point{2,Float32}},1}; notify::Observables.var"#6#8") at C:\Users\datse\.julia\package\Observables\0wrF6\src\Observables.jl:130
 [15] setindex! at C:\Users\datse\.julia\packages\Observables\0wrF6\src\Observables.jl:126 [inined]
 [16] MapUpdater at C:\Users\datse\.julia\packages\Observables\0wrF6\src\Observables.jl:241 [ilined]
 [17] (::Observables.OnUpdate{Observables.MapUpdater{AbstractPlotting.var"#187#189"{Int64},Arry{Tuple{String,Point{2,Float32}},1}},Tuple{Observables.Observable{Tuple{Array{Tuple{String,Poit{2,Float32}},1}}}}})(::Tuple{Array{Tuple{String,Point{2,Float32}},1}}) at C:\Users\datse\.jula\packages\Observables\0wrF6\src\Observables.jl:218
 [18] setindex!(::Observables.Observable{Tuple{Array{Tuple{String,Point{2,Float32}},1}}}, ::Tule{Array{Tuple{String,Point{2,Float32}},1}}; notify::Observables.var"#6#8") at C:\Users\datse\julia\packages\Observables\0wrF6\src\Observables.jl:130
 [19] setindex!(::Observables.Observable{Tuple{Array{Tuple{String,Point{2,Float32}},1}}}, ::Tule{Array{Tuple{String,Point{2,Float32}},1}}) at C:\Users\datse\.julia\packages\Observables\0wr6\src\Observables.jl:126
 [20] (::AbstractPlotting.var"#211#213"{DataType,Observables.Observable{Tuple{Array{Tuple{Strig,Point{2,Float32}},1}}}})(::Tuple{}, ::Tuple{Array{Tuple{String,Point{2,Float32}},1}}) at C:\sers\datse\.julia\dev\AbstractPlotting\src\interfaces.jl:561
 [21] (::Observables.OnUpdate{AbstractPlotting.var"#211#213"{DataType,Observables.Observable{Tple{Array{Tuple{String,Point{2,Float32}},1}}}},Tuple{Observables.Observable{Tuple{}},Observabls.Observable{Tuple{Array{Tuple{String,Point{2,Float32}},1}}}}})(::Tuple{Array{Tuple{String,Poit{2,Float32}},1}}) at C:\Users\datse\.julia\packages\Observables\0wrF6\src\Observables.jl:218 
 [22] setindex!(::Observables.Observable{Tuple{Array{Tuple{String,Point{2,Float32}},1}}}, ::Tule{Array{Tuple{String,Point{2,Float32}},1}}; notify::Observables.var"#6#8") at C:\Users\datse\julia\packages\Observables\0wrF6\src\Observables.jl:130
 [23] setindex! at C:\Users\datse\.julia\packages\Observables\0wrF6\src\Observables.jl:126 [inined]
 [24] MapUpdater at C:\Users\datse\.julia\packages\Observables\0wrF6\src\Observables.jl:241 [ilined]
 [25] (::Observables.OnUpdate{Observables.MapUpdater{typeof(tuple),Tuple{Array{Tuple{String,Pont{2,Float32}},1}}},Tuple{Observables.Observable{Array{Tuple{String,Point{2,Float32}},1}}}})(:Array{Tuple{String,Point{2,Float32}},1}) at C:\Users\datse\.julia\packages\Observables\0wrF6\sc\Observables.jl:218
 [26] setindex!(::Observables.Observable{Array{Tuple{String,Point{2,Float32}},1}}, ::Array{Tupe{String,Point{2,Float32}},1}; notify::Observables.var"#6#8") at C:\Users\datse\.julia\package\Observables\0wrF6\src\Observables.jl:130
 [27] setindex! at C:\Users\datse\.julia\packages\Observables\0wrF6\src\Observables.jl:126 [inined]
 [28] (::MakieLayout.var"#103#123"{Observables.Observable{Any},Observables.Observable{Any},Obsrvables.Observable{Tuple{Float32,Tuple{Float32,Float32},Bool}},Observables.Observable{Array{Tule{String,Point{2,Float32}},1}},Observables.Observable{Float32},Observables.Observable{Array{Pint{2,Float32},1}}})(::Array{String,1}, ::Float32, ::Bool) at C:\Users\datse\.julia\packages\MkieLayout\lNeFw\src\lineaxis.jl:199
 [29] (::Observables.OnUpdate{MakieLayout.var"#103#123"{Observables.Observable{Any},Observable.Observable{Any},Observables.Observable{Tuple{Float32,Tuple{Float32,Float32},Bool}},Observable.Observable{Array{Tuple{String,Point{2,Float32}},1}},Observables.Observable{Float32},Observabls.Observable{Array{Point{2,Float32},1}}},Tuple{Observables.Observable{Array{String,1}},Observales.Observable{Float32},Observables.Observable{Any}}})(::Array{String,1}) at C:\Users\datse\.jlia\packages\Observables\0wrF6\src\Observables.jl:218
 [30] setindex!(::Observables.Observable{Array{String,1}}, ::Array{String,1}; notify::Observabes.var"#6#8") at C:\Users\datse\.julia\packages\Observables\0wrF6\src\Observables.jl:130      
 [31] setindex!(::Observables.Observable{Array{String,1}}, ::Array{String,1}) at C:\Users\dats\.julia\packages\Observables\0wrF6\src\Observables.jl:126
 [32] (::MakieLayout.var"#100#120"{Observables.Observable{Any},Observables.Observable{Any},Obsrvables.Observable{Tuple{Float32,Tuple{Float32,Float32},Bool}},Observables.Observable{Array{Pont{2,Float32},1}},Observables.Observable{Array{String,1}}})(::Array{Float64,1}) at C:\Users\dase\.julia\packages\MakieLayout\lNeFw\src\lineaxis.jl:178
 [33] (::Observables.OnUpdate{MakieLayout.var"#100#120"{Observables.Observable{Any},Observable.Observable{Any},Observables.Observable{Tuple{Float32,Tuple{Float32,Float32},Bool}},Observable.Observable{Array{Point{2,Float32},1}},Observables.Observable{Array{String,1}}},Tuple{Observabes.Observable{Array{Float64,1}}}})(::Array{Float32,1}) at C:\Users\datse\.julia\packages\Obserables\0wrF6\src\Observables.jl:218
 [34] setindex!(::Observables.Observable{Array{Float64,1}}, ::Array{Float32,1}; notify::Observbles.var"#6#8") at C:\Users\datse\.julia\packages\Observables\0wrF6\src\Observables.jl:130    
{Float32,Tuple{Float32,Float32},Bool}, ::Vararg{Any,N} where N) at C:\Users\datse\.julia\packages\Observables\0wrF6\src\Observables.jl:241
 [37] (::Observables.OnUpdate{Observables.MapUpdater{MakieLayout.var"#99#119",Array{Float64,1}},Tuple{Observables.Observable{Tuple{Float32,Tuple{Float32,Float32},Bool}},Observables.Observable{Any},Observables.Observable{Any}}})(::Tuple{Float32,Float32}) at C:\Users\datse\.julia\packages\Observables\0wrF6\src\Observables.jl:218
 [38] setindex!(::Observables.Observable{Any}, ::Tuple{Float32,Float32}; notify::Observables.var"#6#8") at C:\Users\datse\.julia\packages\Observables\0wrF6\src\Observables.jl:130
 [39] setindex! at C:\Users\datse\.julia\packages\Observables\0wrF6\src\Observables.jl:126 [inlined]
 [40] (::Observables.var"#3#4"{Any,Observables.Observable{Any}})(::Tuple{Float32,Float32}) at 
C:\Users\datse\.julia\packages\Observables\0wrF6\src\Observables.jl:47
 [41] #invokelatest#1 at .\essentials.jl:712 [inlined]
 [42] invokelatest at .\essentials.jl:711 [inlined]
 [43] setindex!(::Observables.Observable{Tuple{Float32,Float32}}, ::Tuple{Float32,Float32}; notify::Observables.var"#6#8") at C:\Users\datse\.julia\packages\Observables\0wrF6\src\Observables.jl:132
 [44] setindex! at C:\Users\datse\.julia\packages\Observables\0wrF6\src\Observables.jl:126 [inlined]
 [45] MapUpdater at C:\Users\datse\.julia\packages\Observables\0wrF6\src\Observables.jl:241 [inlined]
 [46] (::Observables.OnUpdate{Observables.MapUpdater{typeof(MakieLayout.xlimits),Tuple{Float32,Float32}},Tuple{Observables.Observable{GeometryBasics.HyperRectangle{2,Float32}}}})(::GeometryBasics.HyperRectangle{2,Float32}) at C:\Users\datse\.julia\packages\Observables\0wrF6\src\Observables.jl:218
 [47] setindex!(::Observables.Observable{GeometryBasics.HyperRectangle{2,Float32}}, ::GeometryBasics.HyperRectangle{2,Float32}; notify::Observables.var"#6#8") at C:\Users\datse\.julia\packages\Observables\0wrF6\src\Observables.jl:130
 [48] setindex!(::Observables.Observable{GeometryBasics.HyperRectangle{2,Float32}}, ::GeometryBasics.HyperRectangle{2,Float32}) at C:\Users\datse\.julia\packages\Observables\0wrF6\src\Observables.jl:126
 [49] adjustlimits!(::LAxis) at C:\Users\datse\.julia\packages\MakieLayout\lNeFw\src\lobjects\laxis.jl:564
 [50] #154 at C:\Users\datse\.julia\packages\MakieLayout\lNeFw\src\lobjects\laxis.jl:330 [inlined]
 [51] (::Observables.OnUpdate{MakieLayout.var"#154#178"{LAxis},Tuple{Observables.Observable{GeometryBasics.HyperRectangle{2,Int64}},Observables.Observable{Any}}})(::GeometryBasics.HyperRectangle{2,Float32}) at C:\Users\datse\.julia\packages\Observables\0wrF6\src\Observables.jl:218 
 [52] setindex!(::Observables.Observable{Any}, ::GeometryBasics.HyperRectangle{2,Float32}; notify::Observables.var"#6#8") at C:\Users\datse\.julia\packages\Observables\0wrF6\src\Observables.jl:130
 [53] setindex!(::Observables.Observable{Any}, ::GeometryBasics.HyperRectangle{2,Float32}) at 
C:\Users\datse\.julia\packages\Observables\0wrF6\src\Observables.jl:126

[Doc] How to "auto-readjust" axis limits for interactive plotting?

Hi, I am doing something simple like:

tsax = layout[end+1, :] = LAxis(scene)
tsobs = Observable(zeros(size(A, Time)))
lines!(tsax, 1:size(A, Time), tsobs)

on(spoint) do  pos
    i = findnearest(pos[1], lon)
    j = findnearest(pos[2], lat)
    tsobs[] = Array(A)[i, j, :]
end

I.e. I am plotting a line on an axis and then interactively I change the line to something else. But, unfortunately, this doesn't readjust the y-axis. I guess that there is a command to do this, but I couldn't find it in the docs.

Spurious repeated mouse event

(Or maybe a plotting issue?)

The following is a simple adaptation from https://gist.github.com/jkrumbiegel/7be90a08be76f44233bc2a206dc86fbd

The issue is that onmouseleftdragstop can get fired multiple times per onmouseleftdragstart event. This seems to only happen when the onmouseleftdragstop event triggers some more plotting (but not, e.g., if you do svd(rand(500,500)) or sleep(2) instead, so it doesn't seem like it's necessarily an async issue). If you run the following code and do some rectangle-selecting, you should soon see some Impossible! messages in the log. Thanks to @SimonDanisch for helping me reduce the MWE. (My workaround is to use the dragging bool and early return if we're in an impossible state, and that works fine but it seems like there's an underlying issue somewhere.)

using Makie, MakieLayout

##
scene, layout = layoutscene()

ax = layout[1, 1] = LAxis(scene)
layout[2,1] = bottom_ax = LAxis(scene)

heatmap!(ax, randn(500, 500))
tightlimits!(ax)

start_pos = Ref(Point2f0(0, 0))
current_pos = Ref(Point2f0(0, 0))
rectnode = Node(BBox(0, 10, 0, 10))
rectplot = Ref{Union{Nothing, Poly}}(poly!(ax, rectnode, color = (:blue, 0.05), strokecolor = (:blue, 0.5),
    strokewidth = 2,xautolimits = false, yautolimits = false, visible = false))

dragging = Ref(false)

scenestate = MakieLayout.addmousestate!(ax.scene)

MakieLayout.onmouseleftdragstart(scenestate) do state
    @info "onmouseleftdragstart triggered"
    dragging[] = true
    start_pos[] = state.pos
end

MakieLayout.onmouseleftdrag(scenestate) do state
    current_pos[] = state.pos
    c = current_pos[]
    s = start_pos[]

    rectnode[] = let
        minx, miny = min.(s, c)
        maxx, maxy = max.(s, c)
        
        BBox(minx, maxx, miny, maxy)
    end
    rectplot[].visible = true
end

MakieLayout.onmouseleftdragstop(scenestate) do state
    @info "onmouseleftdragstop triggered"
    if !dragging[]
        @info "Impossible!"
        return
    else
        dragging[] = false
    end
    rectplot[].visible = false
    ax.limits[] = rectnode[]
    lines!(bottom_ax, rand(100)) # key to trigger the issue
end

scene

strange scaling with scatter + layoutscene

I obtained an unexpected scaling of points with this examples

scene, layout = layoutscene(1, 2, resolution = (800, 400))
axis = [LAxis(scene) for k = 1:2]
layout[1, 1:2] = axis
for k = 1:2
    scatter!(axis[k], rand(20), rand(20) / 10) 
end

scatter

How to rotate an image?

Hey!

I am doing this: image!(axes[i, j], img[rand(400:500):1:500, rand(400:500):1:500])

However, the image is not correctly orientated. How can I fix this?

Docs outdated

I know, there's a note, that the docs are outdated, but without the information that types have been renamed (from LayoutedX to LX), the docs are mostly rendered useless. OTOH with that information I still could get a lot to run. Thus, it'd might be good to add that information to the note. And you should also invalidate the link in the announcement post.

Syntax ideas for plotting with layouts

Creating a scene with a grid layout

scene = Scene(cols = 3, rows = 5, colgap = 0.05, rowgap = 0.03)

Plotting into a scene that has a grid layout

scene[1:2, 2:4] = scatter!(x, y, z)

pros:

  • easily specify grid location

cons:

  • can't save plot object in a variable
scatterobj = scatter!(scene[1:2, 2:4], x, y, z)

pros:

  • easily specify grid location
  • save plot object in variable

cons:

  • ?

Manipulating the scene layout

The layout parameters should be observables that then update the scene

scene.layout.columngap[] = 0.05

Nested grid layouts

Should be easy for manual use and recipes (for example a main plot with two marginal histograms).

gl = GridLayout(rows = 2, cols = 2)
scene[1:2, 2:4] = gl
scatter!(gl[1:2, 1], x, y, z)

Common convenience functions with AbstractPlotting

This came up in reference with this recent PR to AbstractPlotting.jl. There are a number of functions here that would be nice for users to have consistent interface. For the ticks methods I did you could probably just have a per axis method for setting tick labels and rotations (xticks!, yticks!, zticks!, xtickrotation!, etc.).

labels cropped unless using layoutscene

If I run this:

scene = Scene(camera=campixel!)
layout = GridLayout(scene, 1, 1)
ax = layout[1,1] = LAxis(scene, ylabel = "Y Label")
scatter!(ax, rand(Point2f0, 5))

I get this cropped image:
b
Which is weird, cause this works:

scene, layout = layoutscene(0)
ax = layout[1,1] = LAxis(scene, ylabel = "Y Label")
scatter!(ax, rand(Point2f0, 5))

a

Apparent excess padding

I'm trying to create a not too complicated layout of subplots, similar to the attached figure. This is the code I use to generate it:

function show_example()
	scene = Scene(resolution=(1000,700),camera=campixel!)
	nrows = 2
	ncols = 4
	layout = GridLayout(scene, nrows, ncols, colsizes=[Relative(0.45), Relative(0.45), Relative(0.05), Relative(0.05)], alignmode=Outside(20))
	las = [LAxis(scene) for i in 1:nrows,j in 1:ncols-2]
	linkxaxes!(las...)
	linkyaxes!(las...)
	layout[1:2,1:2] = las
	h1 = heatmap!(las[3], rand(100,100))
	heatmap!(las[1], rand(100, 100))
	heatmap!(las[2], rand(100, 100))
	heatmap!(las[4], rand(100, 100))
	layout[2,3] = LColorbar(scene, h1, width=Relative(0.3), label="Performance",
                        alignment=(:left, :center), ticklabelspace=35.0f0,
                        ticklabelsize=12)
	cmplot = layout[1,3:4] = LAxis(scene)
	barplot!(cmplot, [1.0, 2.0, 3.0], rand(3))

	cmplot.attributes.xticks = ManualTicks([1.0, 2.0, 3.0], ["D1→D2", "D2→D1","T1→T2"])
	cmplot.attributes.xticklabelrotation = -pi/6
	cmplot.attributes.xticklabelalign = (:left, :top)
	cmplot.attributes.xticklabelsize = 10.0
	cmplot.attributes.yaxisposition = :right
	cmplot.attributes.yticklabelalign = (:left, :center)
	cmplot.attributes.xlabelvisible = false
	cmplot.attributes.titlevisible = false
	cmplot.attributes.ylabel = "Index"

	las[1].attributes.titlesize = 20
	las[1].attributes.xlabelvisible = false
	las[1].attributes.xticklabelsvisible = false

	las[2].attributes.titlesize = 20
	las[2].attributes.ylabelvisible = false

	las[3].attributes.titlesize = 20
	las[3].attributes.ylabelvisible = false
	las[3].attributes.yticklabelsvisible = false
	las[3].attributes.xlabelvisible = false
	las[3].attributes.xticklabelsvisible = false

	las[4].attributes.titlesize = 20
	las[4].attributes.ylabelvisible = false
	las[4].attributes.yticklabelsvisible = false
	layout[1,0] = LText(scene, "Another title",rotation=pi/2)
	layout[2,1] = LText(scene, "Another title",rotation=pi/2)
	scene
end
show_example()

test_plot

My first question is why is there so much extra space at the bottom of the figure? If I remove the "Another title" text on the left, the extra space disappears, which leads me to think that the layout algorithm somehow adds the same space to the bottom as is added to the left in order to perhaps preserve aspect ratio? I'm wildly speculating here, of course. Is there a way to set some attributes to avoid the extra space?
Another question is how do I update the axis limits for an LAxis? When I try to update the limits on the upper right plot, I get the following error:

AbstractPlotting.update_limits!(cmplot, FRect(0.5, -0.1, 3, 1.0))
ERROR: MethodError: no method matching update_limits!(::LAxis, ::GeometryTypes.HyperRectangle{2,Float32})
Closest candidates are:
  update_limits!(::Scene, ::GeometryTypes.HyperRectangle) at /Volumes/Users/grogee/.julia/packages/AbstractPlotting/wH5Av/src/scenes.jl:596
  update_limits!(::Scene, ::GeometryTypes.HyperRectangle, ::Any) at /Volumes/Users/grogee/.julia/packages/AbstractPlotting/wH5Av/src/scenes.jl:596

Recommend Projects

  • React photo React

    A declarative, efficient, and flexible JavaScript library for building user interfaces.

  • Vue.js photo Vue.js

    🖖 Vue.js is a progressive, incrementally-adoptable JavaScript framework for building UI on the web.

  • Typescript photo Typescript

    TypeScript is a superset of JavaScript that compiles to clean JavaScript output.

  • TensorFlow photo TensorFlow

    An Open Source Machine Learning Framework for Everyone

  • Django photo Django

    The Web framework for perfectionists with deadlines.

  • D3 photo D3

    Bring data to life with SVG, Canvas and HTML. 📊📈🎉

Recommend Topics

  • javascript

    JavaScript (JS) is a lightweight interpreted programming language with first-class functions.

  • web

    Some thing interesting about web. New door for the world.

  • server

    A server is a program made to process requests and deliver data to clients.

  • Machine learning

    Machine learning is a way of modeling and interpreting data that allows a piece of software to respond intelligently.

  • Game

    Some thing interesting about game, make everyone happy.

Recommend Org

  • Facebook photo Facebook

    We are working to build community through open source technology. NB: members must have two-factor auth.

  • Microsoft photo Microsoft

    Open source projects and samples from Microsoft.

  • Google photo Google

    Google ❤️ Open Source for everyone.

  • D3 photo D3

    Data-Driven Documents codes.