| description |
|---|
Apache Pinot is a real-time distributed OLAP datastore purpose-built for low-latency, high-throughput analytics, and perfect for user-facing analytical workloads. This page introduces Pinot, highlighting its strengths. |
{% hint style="info" %} We'd love to hear from you! Join us in our Slack channel to ask questions, troubleshoot, and share feedback. {% endhint %}
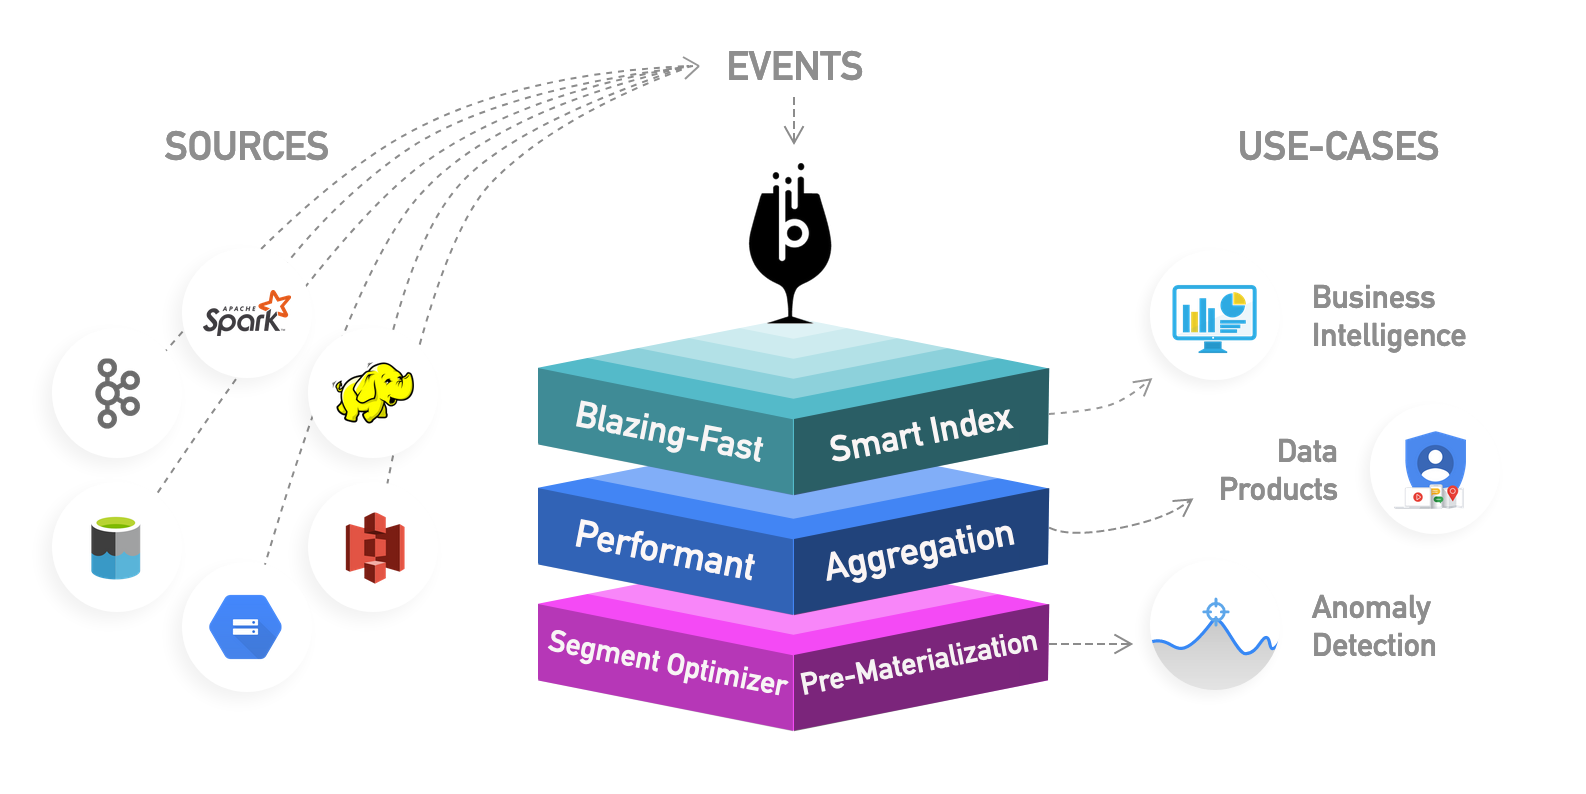
Apache Pinot is a real-time distributed online analytical processing (OLAP) datastore. Use Pinot to ingest and immediately query data from streaming or batch data sources (including, Apache Kafka, Amazon Kinesis, Hadoop HDFS, Amazon S3, Azure ADLS, and Google Cloud Storage).
Apache Pinot includes the following:
- Ultra low-latency analytics even at extremely high throughput.
- Columnar data store with several smart indexing and pre-aggregation techniques.
- Scaling up and out with no upper bound.
- Consistent performance based on the size of your cluster and an expected query per second (QPS) threshold.
It's perfect for user-facing realtime analytics and other analytical use cases, including internal dashboards, anomaly detection, and ad hoc data exploration.
{% embed url="https://youtu.be/_lqdfq2c9cQ" %} What is Apache Pinot? (and User-Facing Analytics) by Tim Berglund {% endembed %}
User-facing analytics, or site-facing analytics, refers to the analytical tools and applications exposed directly to the end users of your product. In a user-facing analytics application, all users receive personalized analytics on their devices (think hundreds of thousands of queries per second). Because these queries are triggered by apps, and not written by people, the scale grows in proportion to the number of active users on the app (millions of events per second).
Pinot is designed to provide the freshest possible data and supports real-time analytics. Data generated in Pinot is immediately available for analytics in latencies under one second.
User-facing real-time analytics is challenging because it requires some very specific things from the underlying infrastructure.

- Such apps require the freshest possible data, so the system needs to be able to ingest data in real time and make it available for querying, also in real time.
- Data for apps like this tends to be event data for a wide range of actions and from multiple sources, so the data comes in at a very high velocity and tends to be highly dimensional.
- Queries are triggered by end users interacting with apps – with queries per second in hundreds of thousands, with arbitrary query patterns, and latencies are expected to be in milliseconds for good user-experience.
- This type of app also needs to be scalable, reliable, highly available, and having a low cost to serve.
Watch the video below to learn more about user-facing real-time analytics and Pinot's capabilities.
{% embed url="https://www.youtube.com/watch?v=L5b_OJVOJKo&t=576s" %} Using Kafka and Pinot for Real-Time User-Facing Analytics {% endembed %}
Here's another great video that goes into the details of how Pinot tackles some of the challenges faced in handling a user-facing analytics workload.
{% embed url="https://youtu.be/JV0WxBwJqKE" %} Building Latency Sensitive User-facing Analytics via Apache Pinot {% endembed %}
Pinot powers a wide variety of real time analytical use cases across several big players, including LinkedIn, Uber, Walmart, WePay, Factual, Weibo and more. Find a detailed list of companies using Pinot here.
Pinot is designed to execute OLAP queries with low latency. It works well where you need fast analytics, such as aggregations, on both mutable and immutable data.
User-facing analytics products
Pinot is the perfect choice for user-facing analytics products. Pinot was originally built at LinkedIn to power rich interactive real-time analytics applications, such as Who Viewed Profile, Company Analytics, Talent Insights, and many more. UberEats Restaurant Manager is another example of a customer-facing analytics app built with Pinot.
Real-time dashboard for business metrics
Pinot can be also be used to perform typical analytical operations such as slice and dice, drill down, roll up, and pivot on large scale multi-dimensional data. For instance, at LinkedIn, Pinot powers dashboards for thousands of business metrics. You can also connect various BI tools such as Superset, Tableau, or PowerBI to visualize data in Pinot.
To integrate Pinot and Superset, see the Superset integration page.
Anomaly detection
In addition to visualizing data in Pinot, one can run machine learning algorithms to detect anomalies in the data stored in Pinot. See ThirdEye for more information on how to use Pinot for anomaly detection and root cause analysis.
While Pinot doesn't match the typical mold of a database product, it is best understood based on your role as either an analyst, data scientist, or application developer.
Enterprise business intelligence
For analysts and data scientists, Pinot is best viewed as a highly-scalable data platform for business intelligence. In this view, Pinot converges big data platforms with the traditional role of a data warehouse, making it a suitable replacement for analysis and reporting.
Enterprise application development
For application developers, Pinot is best viewed as an aggregate store that sources events from streaming data sources, such as Kafka, and makes it available for a query using SQL.
As is the case with a microservice architecture, data encapsulation ends up requiring each application to provide its own data store, as opposed to sharing one OLTP database for reads and writes. In this case, it becomes difficult to query the complete view of a domain because it becomes stored in many different databases. This is costly in terms of performance since it requires joins across multiple microservices that expose their data over HTTP under a REST API. To prevent this, Pinot can be used to aggregate all of the data across a microservice architecture into one easily queryable view of the domain.
Pinot tenants prevent any possibility of sharing ownership of database tables across microservice teams. Developers can create their own query models of data from multiple systems of record depending on their use case and needs. As with all aggregate stores, query models are eventually consistent.
Our documentation is structured to let you quickly get to the content you need and is organized around the different concerns of users, operators, and developers.
If you're new to Pinot and want to learn things by example, take a look at our Getting Started section:
{% content-ref url="basics/getting-started/" %} getting-started {% endcontent-ref %}
To start importing data into Pinot, check out our guides on batch import and stream ingestion based on our plugin architecture:
{% content-ref url="basics/data-import/" %} data-import {% endcontent-ref %}
Pinot works very well for querying time series data with many dimensions and metrics over a vast unbounded space of records that scales linearly on a per-node basis. Filters and aggregations are both easy and fast.
SELECT sum(clicks), sum(impressions) FROM AdAnalyticsTable
  WHERE
       ((daysSinceEpoch >= 17849 AND daysSinceEpoch <= 17856)) AND
       accountId IN (123456789)
  GROUP BY
       daysSinceEpoch TOP 100
Pinot supports SQL for querying read-only data. Learn more about querying Pinot for time series data in our PQL (Pinot Query Language) guide.
Pinot can be deployed to and operated on a cloud provider or a local or virtual machine. You can get started either with a bare-metal installation or a Kubernetes one (either locally or in the cloud). To get immediately started with Pinot, check out these quick start guides for bootstrapping a Pinot cluster using Docker or Kubernetes.
{% content-ref url="basics/getting-started/running-pinot-locally.md" %} running-pinot-locally.md {% endcontent-ref %}
{% content-ref url="basics/getting-started/running-pinot-in-docker.md" %} running-pinot-in-docker.md {% endcontent-ref %}
{% content-ref url="basics/getting-started/kubernetes-quickstart.md" %} kubernetes-quickstart.md {% endcontent-ref %}
{% content-ref url="./" %} . {% endcontent-ref %}
For a high-level overview that explains how Pinot works, check out the Concepts section:
{% content-ref url="basics/concepts.md" %} concepts.md {% endcontent-ref %}
To understand the distributed systems architecture that explains Pinot's operating model, take a look at our basic architecture section:
{% content-ref url="basics/architecture.md" %} architecture.md {% endcontent-ref %}


