Code Monkey home page Code Monkey logo

anichart.js's Introduction


Custom badge NPM npm GitHub last commit GitHub closed issues

中文 | English

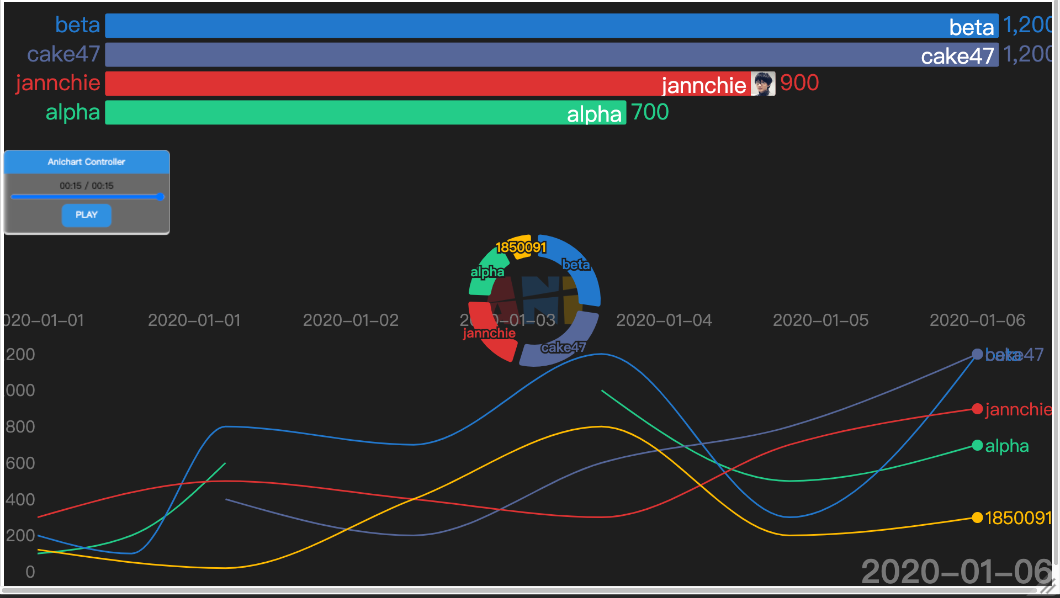
Easily create data visualization animated video.

DEMO

anichart-preview

Online editable DEMO

Warning

Due to a browser security policy update, online editing is now only supported for browsing, and no longer directly supports video export.

Edit anichart 2.x

TJDXT

This project is open source and free.

This is a web environment, using TypeScript programming animation library. It can be used in data visualization, video animation display, opening and ending and other fields.

Currently under development, although the features have been implemented, but does not provide a friendly interface, want to make their own work need to read the source code and understand Typescript programming.

If you feel that the wasm version of FFmpeg is too slow, it also supports exporting Png sequences and calling local FFmpeg to generate videos.

This project needs the technical support of all the technical personnel. But if you're just a regular user, you can also support it through sponsorship. You can use Alipay or WeChat to support through AZZ. It can also be supported by GitHub Sponsor (one credit card is required).

Brief

This is a better template for visualization.

Compared with its predecessor,the main advantage lies in:

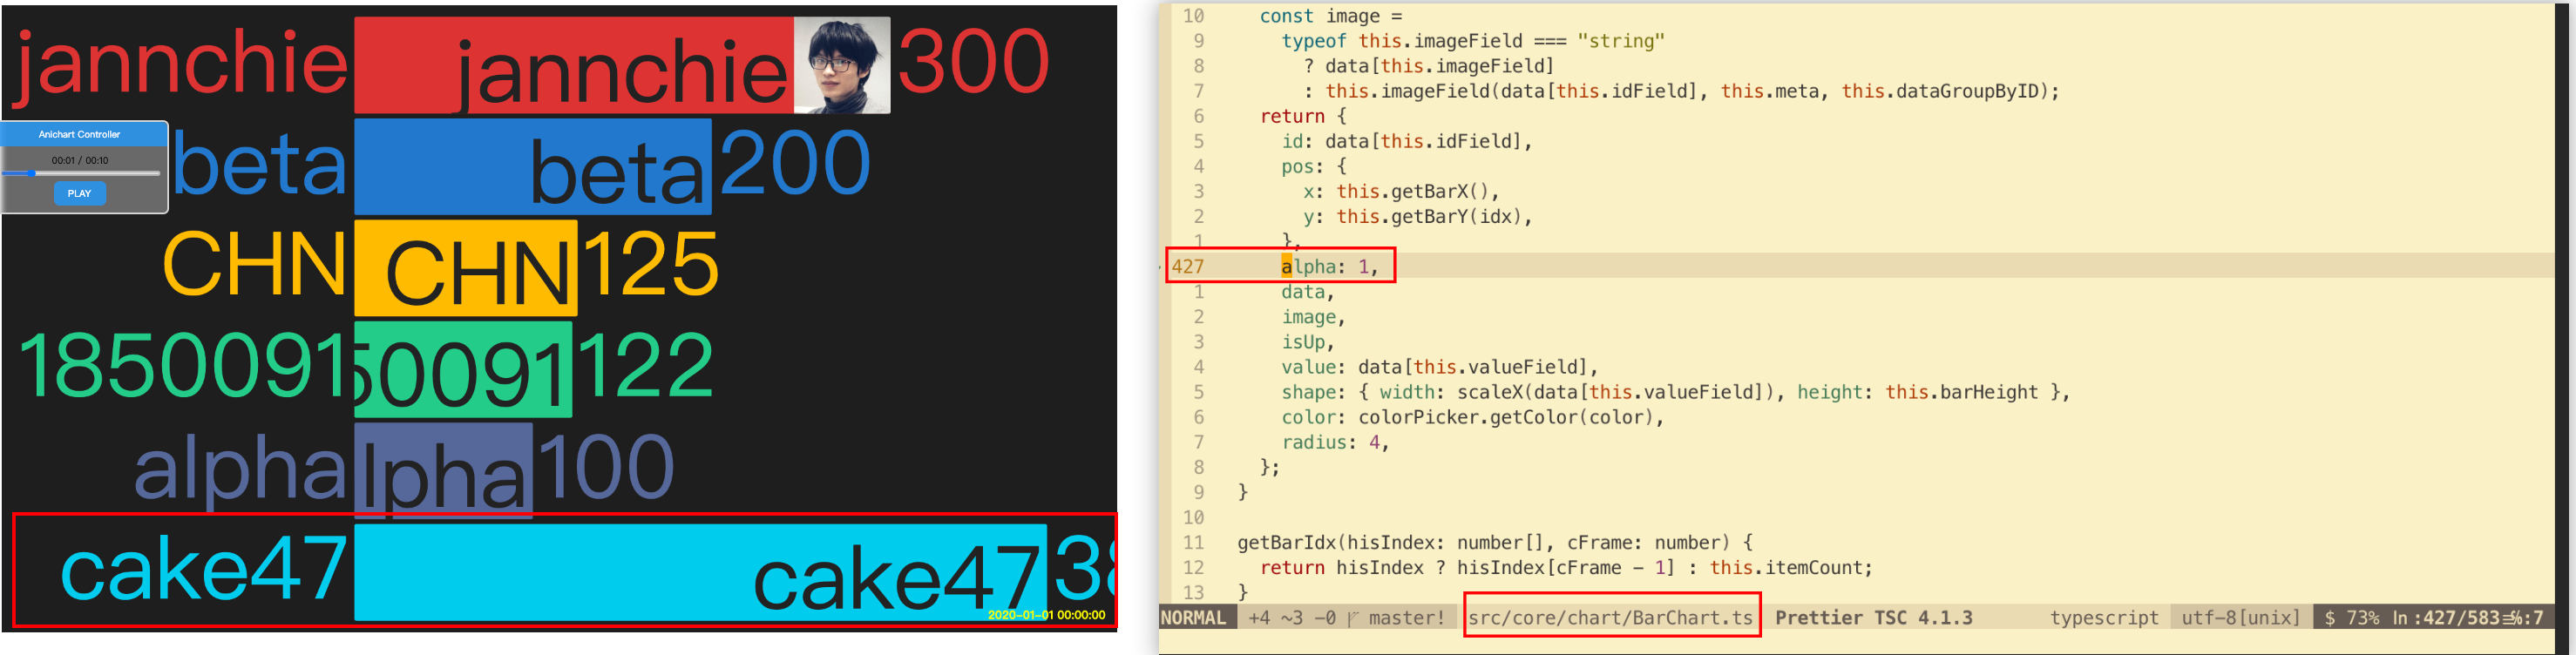
  • Programmable: Open interfaces that allow the insertion of custom code, data calculated by the framework, drawing based on the Canvas API.
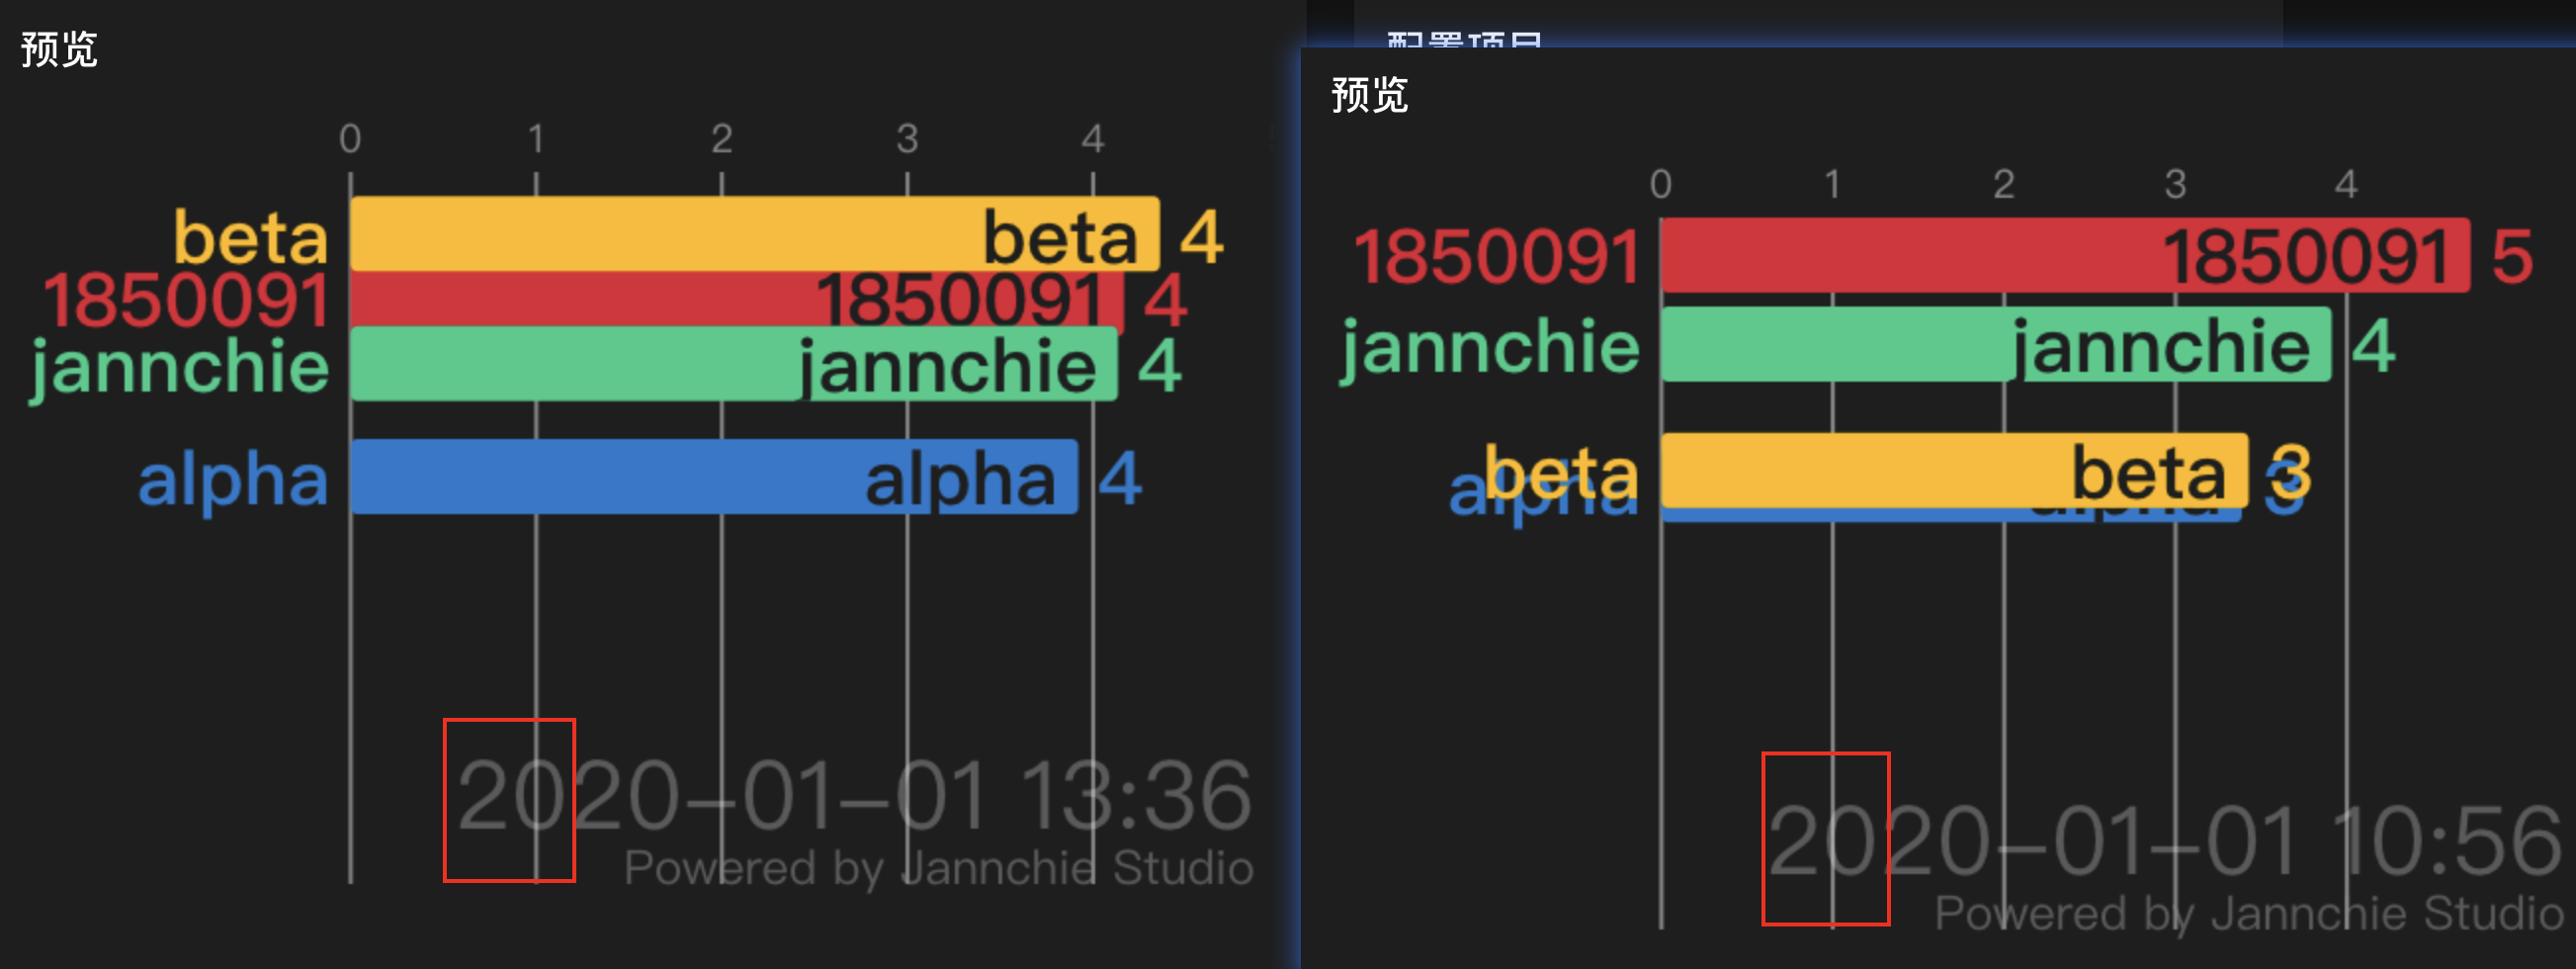
  • Straight out video: Video can be rendered directly from each image frame without any screen recording tools. Maintains FPS stability and rendering speed.And thanks to this, you can now export any resolution, regardless of the screen range displayed. At the same time through the built-in API to achieve the progress of the drag, easy debugging.
  • Convention over configuration: simplifies the user's configuration to the greatest extent, without too many complex Settings you can get a beautiful chart.
  • Virtual components: Similar to virtual DOM, it further enhances extensibility by splitting components and renderers. Ease of porting to more platforms and support for more efficient WebGL rendering in the future.

Use

Currently, anichart for general users is under development, and what is described below is geared towards developers and is more hardcore. If you have data visualization needs right now, you can use the predecessor project, or use the aforementioned online editing project codesandbox.io/s/anichart-2x-m3xbz?fontsize=14&hidenavigation=1&theme=dark).


For general developers, you can use this repository as a template for data visualization projects. You need to have some basic development in Javascript or Typescript.

Steps

yarn install
yarn start

Installation

For advanced developers who want to use anichart in their projects, you can install it as follows.

Via Package Manager

yarn add anichart

# or
npm i anichart

Via HTML tags

<script src="https://cdn.jsdelivr.net/npm/[email protected]/dist/anichart.min.js"></script>

Usage

Use Npm or Yarn imports

You can skip this step if you are using label imports, but if you are using NPM or Yarn you need to import the package with the following code:
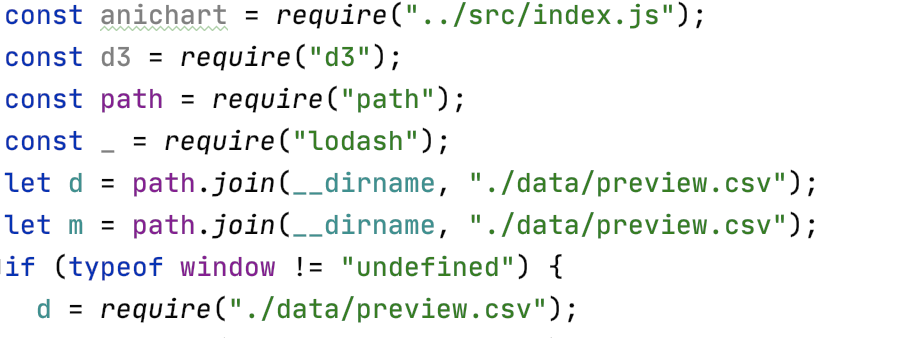
const anichart = require("anichart");

OR

import * as anichart from "anichart";

Prepare Data

For example, use CSV file.

name,date,value,channel,other
Jannchie,2020-01-01,1,科技,other
Jannchie,2020-01-03,6,科技,other
Jannchie,2020-01-05,3,科技,other
Jannchie,2020-01-07,-,科技,other
Jannchie,2020-01-09,7,科技,other
Jannchie,2020-01-12,12,科技,other
Cake47,2020-01-03,10,生活,other
Cake47,2020-01-02,5,生活,other
Cake47,2020-01-06,2,生活,other
Cake47,2020-01-09,3,生活,other
Cake47,2020-01-11,4,生活,other

Load Data

// Recourse By default, data needs to be loaded through a built-in recourse object
// The first argument is the path of the data, and the second argument is the name of the data
anichart.recourse.loadData("path/to/data.csv", "data")

Create the Object

// Create a Stage
let stage = new anichart.Stage();
// Create a chart that loads data named "data" by default
let chart = new anichart.BarChart();
// Mount the chart
stage.addChild(chart);

Play the Animation

You can use code to control playback.

stage.play();

Output Video

Built-in FFMPEG for export. The output is printed in the Console.

// Configure to export video
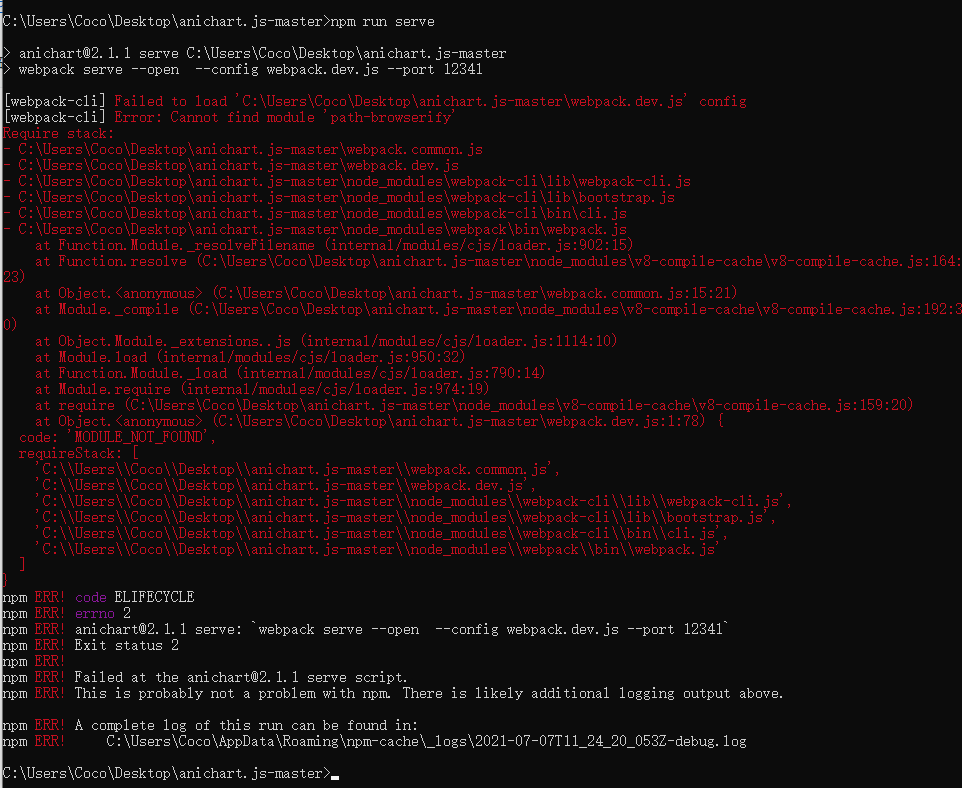
stage.output = true;

Test

Browser

yarn serve
# or
npm run serve

Node.js

If you have special needs, such as server side users who regularly export video, you can use the Node.js environment.

Node.js support is now available, you can run the project with Node without any configuration, you will be able to export PNG sequences directly for video integration in tools like FFmpeg (there are no plans to call native FFmpeg functionality at this time, we look forward to the developer coming up with PR). However, the Node environment is not the primary development test environment, and you may encounter unknown bugs while developing in this environment. My energy is limited and I may not be able to give feedback in time. I hope capable developers can work with me to maintain it.

You can test Anichart under Node.js using the following command:

cd test
ts-node index.ts # This project is written in TypeScript, so it requires a TS-Node environment. You can also compile it into JS and test the compiled file.

anichart.js's People

Contributors

dependabot[bot] avatar jannchie avatar lgtm-migrator avatar lqlsoftware avatar

Stargazers

 avatar  avatar  avatar  avatar  avatar  avatar  avatar  avatar  avatar  avatar  avatar  avatar  avatar  avatar  avatar  avatar  avatar  avatar  avatar  avatar  avatar  avatar  avatar  avatar  avatar  avatar  avatar  avatar  avatar  avatar  avatar  avatar  avatar  avatar  avatar  avatar  avatar  avatar  avatar  avatar  avatar  avatar  avatar  avatar  avatar  avatar  avatar  avatar  avatar  avatar  avatar  avatar  avatar  avatar  avatar  avatar  avatar  avatar  avatar  avatar  avatar  avatar  avatar  avatar  avatar  avatar  avatar  avatar  avatar  avatar  avatar  avatar  avatar  avatar  avatar  avatar  avatar  avatar  avatar  avatar  avatar  avatar  avatar  avatar  avatar  avatar  avatar  avatar  avatar  avatar  avatar  avatar  avatar  avatar  avatar  avatar  avatar  avatar  avatar  avatar

Watchers

 avatar  avatar  avatar  avatar  avatar  avatar  avatar  avatar  avatar  avatar  avatar  avatar  avatar  avatar  avatar

anichart.js's Issues

stage.options 的配置要怎样才生效

stage.options 的配置不生效吗,我配置如下
stage.options.fps = 30;
stage.options.sec = 120;
然后动画不到15秒就结束了,另外还有导出视频也差不多,设置的60秒,动画过了15秒左右就不动了,但是视频从15~60的画面一直不变。我的时间格式是 yyyy-mm-dd HH:ii,不知道是不是这里的问题,示例代码其他的没改,就是改了文件的内容

ts-node运行报错

代码

import { scaleLinear } from 'd3-scale'
import * as ani from 'anichart'
 
document.documentElement.style.background = '#223'
const stage = new ani.Stage()
 
void stage.renderController()
if (typeof window !== 'undefined') {
  // (window as any).stage = stage;
  // (window as any).ani = ani;
  // (window as any).map = map;
}

node --loader ts-node/esm test.ts
(node:35068) ExperimentalWarning: Custom ESM Loaders is an experimental feature. This feature could change at any time
(Use node --trace-warnings ... to show where the warning was created)
(node:35068) Warning: To load an ES module, set "type": "module" in the package.json or use the .mjs extension.
D:\work\nodejs\myff\node_modules\anichart\lib\index.js:7
export * from './core/Controller';
^^^^^^

SyntaxError: Unexpected token 'export'
at Object.compileFunction (node:vm:360:18)
at wrapSafe (node:internal/modules/cjs/loader:1088:15)
at Module._compile (node:internal/modules/cjs/loader:1123:27)
at Module._extensions..js (node:internal/modules/cjs/loader:1213:10)
at Object.require.extensions. [as .js] (D:\work\nodejs\myff\node_modules\ts-node\src\index.ts:1608:43)
at Module.load (node:internal/modules/cjs/loader:1037:32)
at Function.Module._load (node:internal/modules/cjs/loader:878:12)
at ModuleWrap. (node:internal/modules/esm/translators:169:29)
at ModuleJob.run (node:internal/modules/esm/module_job:193:25)
at async Promise.all (index 0)

用浏览器访问没有报错 开启了stage.output = true 主要想生成视频 浏览器里好像不能生成视频

新手请教几个问题

1.如何设置Barcharts数字后面的后缀呢,如您视频中的“xx/周”
2.如何设置Barcharts数字后缀后面的数字呢,如您视频中的“xx粉/每周 [xx万粉]”
3.如何显示Barcharts柱子上的文字前面的标签呢,如您视频中的“** - 张怡宁”
感谢见齐大大解答。

示例中视频中的数据有2处问题

每天刷新一遍看看有没有更新,期待视频下载功能的接口开放(看到代码已经有了,但无奈js代码不太看得懂)
运行之后有两个问题(如图)
image
修改方式(如图,不知道对不对)
image
改完之后的结果(如图)
image
这个月增加的粉丝和后面的总粉丝差不多, 这个业务逻辑有点不太理解

[TODO] Refactor the bar chart

Task name
Refactor the bar chart
Description of this task
Current bar chart is written in JavaScript. It is not well designed and is very difficult to maintain. We should migrate to typescript refactoring versions.

[TODO] Encapsulating animation effect

Description of this task
Currently, the effects of dynamically moving positions and changing transparency are not elegant for components. The external needs to pass in a function argument to specify the specific action.
Using functions to manipulate animations is really more manageable so that it is worth keeping. But I should provide an animation interface in the base component to make it easier for users to operate.

[Need Help] React函数式组件下如何使用anichart?

Jannchie你好,请问是否有React中使用anichart的成功案例?我按照渲染条形图中的方法进行尝试,得到getTime of undefined错误:
2021-09-04_14-46
这个错误是每计算一帧就打印一次,因此电脑的风扇马上就转了起来,还会造成电脑的卡顿。

我能确定csv文件中的数据已经在recourse中,因为我能在控制台打印出来。

研究了大半天源码,还是力不从心,故来提issue求助。

PS:我还克隆了本仓库,使用npm run serve跑了test,一切正常。

新手咨询几个问题

由于不是程序员,对js开发比较小白,但是很想用见齐大大的模板做折线图视频。
摸索了两天在线的模板,还是有几个问题找不到答案,希望可以解答。

  1. B站上您的折线图视频,数据随着时间,横轴的跨度范围是不变的,也就是在前面的数据会移出屏幕。但是默认的折线图代码和codesandbox上的例子,时间跨度会越来越大,也就是起始时间点一直在屏幕内,不知道怎么调。
  2. 如何将折线图的时间轴放在折线下面?如何把纵轴对应的grid画出来?
  3. 如何自定义折线的颜色,我照着以前的一个issue试了,好像不行。看了下代码,似乎1.x版本和现在的api有了很大变化。
  4. 如果比较简单的话,还想请教您如何自定义折线头的label,比如变化的数字,文字位置等。

how to ues labelFormat or other configuration to design bar label ?and how to change ranklabel configuration?

i want to hidden the right label which out of bar but to show the left label which in bar。

the green rect show two label i want change
(the green rect show two labels which i want change)
how ever, i use labelFormat function to return empty string
image
next the vision show that two of label all hidden...
image
i want know how to made it,thx !

and second question, how to change ranklabel configuration?
image
(the green rect show the ranklabel)
i want to change font size and color to adapt background-image's color

best wish to you!

[BUG?] bar数比实际bar数少1

Jannchie你好~

最近发现了一个以前一直没留心的问题,即如题目中描述的那样,bar数比实际的bar数少1:
image

这是官方sandbox中的demo,可以看到下方其他图表中都有5个数据,但是barChart只有4个。事实上,在中间变换的过程中,可以出现5个bar同时出现的情况,但是变换稳定后只有5-1=4个。data.csv中的确是5个数据。

且这和itemCount这个配置项没有关系,显示的bar永远是data.csv中实际的bar数(id数)- 1。

我自己调试源码后,发现把alpha设置成1就能让所有bar显示出来,但是最后那条被我强制显示的bar的位置显然又是不正确的:
image

类似的,当data.csv中只有1个id的数据时,barChart将不会显示任何bar(1-1=0),也就是说进度条会走,但是stage上本该出现的1条bar没有出现。请问这是设计上无法避免的,还是说这是一个bug?

能否提供播放结束后的hook?

Jannchie你好~

我之前是这样实现“播放”和“重播”功能的:

  • 在stage.play()后让“播放”按钮隐藏,然后紧接着一个setTimeout(),该定时器的时长为整个duration+1s
  • stage播放完毕后,这个定时器也差不多走完了,定时器的内容是让“播放”按钮再次显示,达到“重播”的目的

这个定时器的方法实在不优雅,我之所以这么做是因为:目前我没有找到anichart.js在stage.play()结束后提供了相关的回调函数,从而允许用户做一些自定义的操作。

最近我还发现这个方法不仅不优雅,还很致命。这是因为:stage.play()会先加载好所有资源,但是如果资源请求的时间比较长的话,播放按钮已经消失了,但是动画还没开始走。于是定时器还是按照规定时间触发了,但是动画还没走完。造成了播放按钮提前出现的问题。

总而言之,请问Jannchie能否提供这个hook?或是有别的建议可以让我达到类似的效果?

感激不尽!

cnpm安装报错

× Install fail! Error: [[email protected][email protected][email protected] › web-streams-polyfill@git://github.com/gwicke/web-streams-polyfill.git#spec_performance_improvements] Run "C:\Windows\system32\cmd.exe /d /s /c git clone https://github.com/gwicke/web-streams-polyfill.git C:\Users\wang2\node_modules.tmp\4cd98833-b454-46c8-ab59-a1ab89c4f784" error, exit code 1
Error: [[email protected][email protected][email protected] › web-streams-polyfill@git://github.com/gwicke/web-streams-polyfill.git#spec_performance_improvements] Run "C:\Windows\system32\cmd.exe /d /s /c git clone https://github.com/gwicke/web-streams-polyfill.git C:\Users\wang2\node_modules.tmp\4cd98833-b454-46c8-ab59-a1ab89c4f784" error, exit code 1
at module.exports (D:\node\node_modules\cnpm\node_modules\npminstall\lib\download\git.js:51:11)
at module.exports.throw ()
at onRejected (D:\node\node_modules\cnpm\node_modules\co\index.js:81:24)
at processTicksAndRejections (internal/process/task_queues.js:95:5)

Use kalman-Filter for substitution of convolutional operations

Currently, the memory, computational efficiency and effectiveness of the y-axis coordinates of bar chart charts and map chart focus shifts are not good enough.

In fact, this is the scenario in which filters are used. One of the filters that is easier to import and less computationally intensive is the Kalman filter. Using it yields a more silky smooth animation.

[TODO] Video export

Task name
Video export
Description of this task
The refactored library does not yet have a live video export capability. It should be added as soon as possible.

Feature request: 请求增加柱状图柱子变换速率的参数

有时候,当数据量很大时,使用remotion导出的速度会变得很慢。为了解决这个问题,我决定直接进行屏幕录制。然而,由于数据量太大,直接录制会导致掉帧的情况发生。为了解决这个问题,我考虑将录制的视频慢放10倍,然后在后期再加速10倍。然而,我发现anichart.js的变换速率它的前身不同。不论速度设置为多少,anichart.js的柱子变换速率始终保持一致。因此,我希望能在柱状图中添加一个参数,用于控制柱子变换的速率,这样用户就可以根据需要自行选择。
非常感谢您的耐心阅读和考虑!

TypeError: Cannot read property 'max' of undefined

您好,我是这样引入anichart的,

<script lang="ts">
import { onMounted } from "vue";
import * as anichart from "anichart";
export default {
  setup() {
    onMounted( async () => {
      const chart = new anichart.Bar();
      await (chart as any).loadCsv("../../data/test-meta.csv");
      (chart as any).initCanvas();
      (chart as any).readyToDraw();
      console.log(chart);
      (chart as any).play()
    });
  }
}
</script>

但是浏览器报错如下图,

image

具体报错代码为

image

请问这个可能是什么原因呢

导出的mp4视频无法打开。

使用的是静态资源引入的2.1.1版本。设置stage.output = true; 浏览器生成的mp4文件大小没问题,但是打开是空白的。

请问一开始数值为0的bar可以不显示吗?

Jannchie你好,我现在将interpolateInitValue设置为0(默认是NaN),因此一开始只有一个人“solo”的时候,其他还没登场的bar就会显示一堆0.00(如果是默认的NaN也是差不多的情况)。有没有办法能让一开始还没登场的bar先藏起来?

Peek 2021-09-21 14-59

这是我的代码:

import React from "react";
import { useEffect, useState, useRef } from "react";
import * as ANI from "anichart";
import {format} from 'd3';
import PlayButton from "./PlayButton/PlayButton";

interface DynamicBarProps {
  theme: "light" | "dark";
  width: number;
  height: number;
  barNumber: number;
  digitNumber: number;
  dataUrl: string;
  duration: number;
  dateLabelSize: number;
}

const DynamicBar: React.FC<DynamicBarProps> = (props) => {
  const { theme, width, height, barNumber, digitNumber, dataUrl, duration, dateLabelSize } = props;
  const canvasEL = useRef(null);
  const [playing, setPlaying] = useState(false);

  let stage: ANI.Stage;

  const play = () => {
    stage.interval = null; // 黑技巧:stage.doPlay()需要stage.interval=null
    stage.sec = 0; // 回到第1帧
    stage.play(); // 加载Recourse中的数据后调用stage.doPlay()
    setPlaying(true);
    // 没有提供播放结束的回调,自己黑一个
    setTimeout(() => {
      setPlaying(false);
    }, (duration + 1) * 1000);
  };

  // 载入数据到Recourse数据中心
  useEffect(() => {
    let idSet = new Set<string>();
    ANI.recourse.loadCSV(dataUrl, "data").then(() => {
      // 迫不得已调用了setup,之后stage.play()时还会调用一次
      ANI.recourse.setup().then(() => {
        // 提取id集合在BarChart.ts中实现过了,但是为private方法,没法直接调用
        ANI.recourse.data
          .get("data")
          .forEach((item: any) => idSet.add(item.id));
        // 遍历idSet载入头像图片到Recourse数据中心
        idSet.forEach((username) => {
          // Github获取用户头像的api,先写死在这里,以后再做得更通用
          ANI.recourse.loadImage(
            `https://avatars.githubusercontent.com/${username}?s=128&v=4`,
            username
          );
        });
      });
    });
  }, []);

  useEffect(() => {
    stage = new ANI.Stage(canvasEL.current as any);
    stage.options.fps = 30;
    stage.options.sec = duration;
    stage.output = false;

    const barChart = new ANI.BarChart({
      dataName: "data", // 使用的数据的名称,默认就是“data”
      idField: "id", // 别换成“username”之类的,因为源码一些地方写死了
      showDateLabel: true, // 是否显示右下角的日期
      itemCount: barNumber, // bar的数量,就算没有bar也会占位相应数量
      aniTime: [0, duration], //动画起始、终止时刻,总时间不要超过stage.options.sec
      swapDurationMS: 300, // 排名变动时,bar交换时的动画时间
      showRankLabel: false, // 是否在左边显示排名序号
      margin: {left: 20, right: 20, top: 20, bottom: 20},
      dateLabelOptions: {
        fontSize: dateLabelSize,
        fillStyle: "#777",
        textAlign: "right",
        fontWeight: "bolder",
        textBaseline: "alphabetic",
        position: {
          x: stage.canvas.width - 20,
          y: stage.canvas.height - 20
        },
      },
      valueFormat: (cData: any) => {return format(`,.${digitNumber}f`)(cData["value"]);},
      interpolateInitValue: 0,
    });

    stage.addChild(barChart);
  });

  // 初次渲染时,显示播放结束时的帧
  useEffect(() => {
    stage.render(duration);
  }, []);

  return (
    <div style={{ position: "relative" }}>
      <canvas width={width} height={height} ref={canvasEL} />
      <PlayButton
        isShow={!playing}
        theme={theme}
        size={dateLabelSize * 0.8}
        play={play}
      />
    </div>
  );
};
export default DynamicBar;

不胜感激!

有node版本了吗

想在前端页面放一个导出视频的按钮,当用户按下的时候请求node版本,并导出视频,在上传云存储输出地址给前端用户

mac ffmpeg本地已安装 output=true console没有输出ffmpeg信息

Describe the bug
A clear and concise description of what the bug is.

To Reproduce
Steps to reproduce the behavior:

  1. Go to '...'
  2. Click on '....'
  3. Scroll down to '....'
  4. See error

Expected behavior
A clear and concise description of what you expected to happen.

Screenshots
If applicable, add screenshots to help explain your problem.

Desktop (please complete the following information):

  • OS: [e.g. iOS]
  • Browser [e.g. chrome, safari]
  • Version [e.g. 22]

Smartphone (please complete the following information):

  • Device: [e.g. iPhone6]
  • OS: [e.g. iOS8.1]
  • Browser [e.g. stock browser, safari]
  • Version [e.g. 22]

Additional context
Add any other context about the problem here.

Bug report: X坐标轴值域

发现了一个关于X坐标轴的bug,X坐标轴的值域您把左右两侧的文字也算上了,我使用getBarX函数减去了左侧文字的宽度,右侧文字我没在源码中找到相对应的函数,请问有什么方法可以解决这个问题嘛,感谢解答。

请教一个关于BaseChart.interpolateInitValue的问题

请教一个小问题:
我的数据是这样的

id,value,date
a,1,2010
a,2,2011
b,2,2011
b,5,2012
c,4,2012

a没有2012年的数据,但是a仍然在柱状图上,数据保持在2,如果我不能设置a,0,2012,我该如何把a从柱状图上移除呢?
我尝试把BaseChart.interpolateInitValue设置成NaN或0但没有效果。
感谢见齐大大解答。

很棒的工具,但在react中使用bar出现如下报错

报错信息如下:

anichart.js:1 Uncaught (in promise) TypeError: Cannot set property 'textAlign' of undefined
    at fa.hintText (anichart.js:1)
    at fa.readyToDraw (anichart.js:1)
    at async fa.play (anichart.js:1)

具体代码如下:

import React,{ useEffect } from 'react';
// 将文件作为路径引入才能正常导入数据
import test from './test2.csv'
import * as anichart from "anichart";

function App() {
  useEffect(() => {
    // 创建一个柱状图
    let bar = new anichart.BarChart();

    (async () => {
      await bar.loadCsv(test);
      bar.play();
    })();
  }, [])
  return (
    <div className="App">
    </div>
  );
}
export default App;

如果可以的话,是否能够做一个codepen bar版本的demo实例以供研究。

有详细的api配置文档?示例数据有一部分配置数据,不是很明白。

Is your feature request related to a problem? Please describe.
A clear and concise description of what the problem is. Ex. I'm always frustrated when [...]

Describe the solution you'd like
A clear and concise description of what you want to happen.

Describe alternatives you've considered
A clear and concise description of any alternative solutions or features you've considered.

Additional context
Add any other context or screenshots about the feature request here.

导出视频又报错了

之前提了一个导出视频报错的issues,后面可以正常导出了,现在又报错了。可用那个issues发的沙箱地址重现,直接打开就是报错。
报错信息:SharedArrayBuffer is not defined

[TODO] Refactor Series and Sense

Task name

Refactor Series and Sense

Description of this task

I added Series to splice multiple scenes.I found that many attributes, such as FPS and Shape of the Canvas, should be controlled by Series first.

[TODO] Multiple play mode

Description of this task
Currently, animations would try to draw every frames. If render speed is too slow,the total time will exceed the target time (set by sec property). This mode is good for output video but sometimes not good for preview.
I want to add a new mode for preview. In this mode, animations will finish in time, although sometimes it might cause frames to drop.

用node运行时,无法生成图片

按照默认视频的导出方式,现在1秒钟大概导出1帧,速度有点慢。根据up主的提示,通过node运行生成图片后手动合成视频,但现在运行之后,没有生成序列图片,不知道是不是后面还有什么过程?还有如何设置输出图片的地址?
image

柱状动态图时,当背景为图片时,用node 导出图片时,所有图片都是黑的,浏览器模式是正常的

1.柱状动态图时,当背景为图片时,用node 运行该项目,导出图片时,所有图片都是没有内容的;同样的代码,浏览器模式却是正常显示

2.柱状动态图时,当背景为纯颜色时,用node运行该项目 导出图片时,为正常

这2种情况下,test-meta的中的image图片都是可以正常加载的

PS:node运行该项目 的命令是 node --experimental-wasm-threads --experimental-wasm-bulk-memory ./test/fans-month.js

image

image

image

Bug report: 使用柱状图时最后几个柱子异常消失

在使用anichart.js柱状图制作视频时,有时最后几个柱子会异常消失。
我注意到这个BUG在您的视频BV1sh411e7wa中的第21秒也出现过。
经过我的确认,我可以确定以下几点:

  1. 柱子确实是消失了,而不仅仅是变为白色。即使在更改背景颜色之后,问题仍然存在。
  2. 这个柱子的确是实实在在存在的一个ID。
  3. 如果删除这个ID,就不会出现柱子消失的情况。

非常感谢您的耐心阅读,期待您对这个问题的解决。

呃……请问我为什么连例子都跑不起来

呃……请问我为什么连例子都跑不起来……Console报下列错误……
Fetch API cannot load file:///H:/WWW/biliob-analytics/test.csv. URL scheme must be "http" or "https" for CORS request.

Feature request: 为条形图添加axis轴的绘制功能

您好,我是anichart.js的长期使用者,我非常感谢您在这个框架上所做的工作,我一直从您的努力中受益良多。我有一个特性请求,希望您能考虑一下。
我想在柱状图中增加一个参数,用于绘制axis轴。用户可以选择是否启用该轴,这对于展示视频中的数据变化和增长非常有用。axis轴的值可以反映数据的变化,并且还可以帮助阐明条形图的区间范围。
我一直渴望这个功能的加入,我相信它会丰富anichart.js的功能,使其变得更加强大,希望您能考虑。
再次感谢您对anichart.js的付出和支持!

Recommend Projects

  • React photo React

    A declarative, efficient, and flexible JavaScript library for building user interfaces.

  • Vue.js photo Vue.js

    🖖 Vue.js is a progressive, incrementally-adoptable JavaScript framework for building UI on the web.

  • Typescript photo Typescript

    TypeScript is a superset of JavaScript that compiles to clean JavaScript output.

  • TensorFlow photo TensorFlow

    An Open Source Machine Learning Framework for Everyone

  • Django photo Django

    The Web framework for perfectionists with deadlines.

  • D3 photo D3

    Bring data to life with SVG, Canvas and HTML. 📊📈🎉

Recommend Topics

  • javascript

    JavaScript (JS) is a lightweight interpreted programming language with first-class functions.

  • web

    Some thing interesting about web. New door for the world.

  • server

    A server is a program made to process requests and deliver data to clients.

  • Machine learning

    Machine learning is a way of modeling and interpreting data that allows a piece of software to respond intelligently.

  • Game

    Some thing interesting about game, make everyone happy.

Recommend Org

  • Facebook photo Facebook

    We are working to build community through open source technology. NB: members must have two-factor auth.

  • Microsoft photo Microsoft

    Open source projects and samples from Microsoft.

  • Google photo Google

    Google ❤️ Open Source for everyone.

  • D3 photo D3

    Data-Driven Documents codes.